
 ?Mathematical formulae have been encoded as MathML and are displayed in this HTML version using MathJax in order to improve their display. Uncheck the box to turn MathJax off. This feature requires Javascript. Click on a formula to zoom.
ABSTRACT
Sustainable development of urban areas demands, among others, a holistic approach for identification and monitoring of environmental changes caused by human activities. In this study, the human-made impact on the geo-environment is studied through the application of the change detection study based on Principal Component Analysis on Landsat imageries and comparison of the digital elevation models taken at different times. The analysis is set up to identify and quantify the anthropogenic geomorphological changes in the loess landscape in Lanzhou city, Northwest China. Since 2002 Lanzhou has been undergoing a rapid economic development associated with construction boom. Due to limited flat building ground in the narrowed Yellow River Valley and subsequent expansion into the surrounding loess mountains, massive earthworks are conducted for reclamation of the suitable building ground. The results of the change detection analysis show that approximately 10% of the semi-natural study area corresponding to 35 km2 has been reshaped by leveling and terracing since 1994. In particular, the geomorphology was significantly changed in these and adjacent areas. For the single developing area Taipingyang, a moving volume of up to 57 million m3 was roughly estimated.
1. Introduction
Human history records many cases of rising and fall of civilizations (e.g. Butzler, Citation2012; Ehrlich & Ehrlich, Citation2013). Among the complex socio-economic causes for the collapse, many of them also apparently suffered from unwise exploitation of environmental resources (e.g. McNeil, Burney, & Burney, Citation2010).
In modern times, since the industrial revolution, human activity has become an increasingly important global factor in ecological changes. In the environmental sciences, the impact of human activity is under discussion since March’s “Man and Nature” (Marsh, Citation1865). The term of “man as a geological agent” was introduced by Sherlock and Woodward (Citation1922). Recent studies, e.g. Wilkinson (Citation2005), show that compared to many natural processes acting on the earth surface, the human’s activity also becomes the most critical geomorphic agent. Price, Ford, Cooper, and Neal (Citation2016) emphasized that the annual shift of sediments by human activities exceeding that transported by rivers almost by the factor of three. Therefore, in terms of sustainable development, it seems to be a logical step to identify, monitor, and evaluate the consequences of the environmental changes caused by human activity.
Today, with the development of the satellite remote sensing, imageries from various satellite missions with repetition rates ranging between several days up to a couple of weeks are available. Utilizing these advanced data, monitoring of the environment has become an increasingly standardized process. With a focus on multispectral satellite data and open access policy to the products, the most suitable data are provided by missions such as Moderate-resolution Imaging Spectroradiometer (MODIS), Landsat and Sentinel-2, with repetition rates of 16 days for MODIS and Landsat and 10 days for Sentinel-2, respectively (Heute et al., Citation2002; Li & Roy, Citation2017). introduces some technical aspects of the mentioned remote sensing satellites.
Table 1. Technical data of most prominent remote sensing missions.
Also, different methods have been developed in the past to identify and map environmental changes based on remote sensing imagery. Comprehensive overviews of the existing methodologies are given, among others, by Lu, Mausel, Brondízio, and Moran (Citation2004) and Ban and Yousif (Citation2016). Methodological approaches range from the simple algebraic methods such as image differencing, rationing or index calculation, to more or less complex transformation algorithms such as Change Vector Analysis (e.g. Dewi, Bijker, & Stein, Citation2017; Xiaolu & Bo, Citation2011) or Principal Component Analysis (PCA) (e.g. Deng, Wang, Deng, & Qi, Citation2008; Gong, Citation1993; Munyati, Citation2004). Also, unsupervised and supervised classification algorithms provide valuable options for change detection.
The current study focuses on Lanzhou, the capital of the Province Gansu. Due to its geographically and strategically important location (“New Silk Road – Node”), the surroundings of Lanzhou are subject to rapid social and economic development enforced by the establishment of a so-called Economic-Technological Development Zone (ETDZ). ETDZs are selected areas dedicated to push the development of specific regions and attract foreign investment (Liu & Wu, Citation2011). Such ETDZs were established countrywide by the Chinese national-level programs started in 1978. Since 1984 the number of ETDZs has been continuously growing. According to the report of the Ministry of Commerce, P.R.C. (Ministry of Commerce, Citation2016), recently, there are about 54 national-level ETDZs. The development activities in the Lanzhou area comprehensively started in the year 2002. Since then, new urban and industrial facilities have been constructing on the rural outskirts of the city. For the preparation of the suitable building ground, large scale bulk earthworks are conducted before infrastructure construction. The extent of the activities at which the natural thick loess deposits shaping a hilly landscape in the northern Lanzhou area has been leveled, and terraced gave them the name of the largest “mountain-moving project” in Chinese history. In total, about 700 mountainous peaks have been leveled in the entire Lanzhou area to create more than 250 square kilometers of flat land (Li, Qian, & Wu, Citation2014). Such tremendous changes are supposed to have a significant impact on the natural environmental conditions controlling groundwater supply or slope stability.
As Lanzhou area suffers from recurring hazards such as earthquakes, mass movements, and debris flows, sustainable development of new urban areas is only possible by implementing appropriate assessment of the hazards and consequent risks in the early stage of the spatial planning process. At regional scales, the landslide susceptibility representing the spatial distribution of the landslide occurrence is usually assessed to approximate the landslide hazard. Recently popular are data-driven (statistical) approaches using observations of the landslides from the past to establish a predictive model for the future. The application of statistically-based approaches requires several assumptions to be made concerning the existing environmental conditions. One of the critical points is the assumption of the stationarity of the environmental factors. Given the rapid development of the ETDZ of Lanzhou, stationary assumptions appear missconductive (Torizin et al., Citation2018). Instead, there is a substantial demand for detection and quantification of the environmental changes to be considered in the landslide susceptibility assessment (Tian et al., Citation2017; Torizin et al., Citation2018).
The presented paper introduces a change detection study based on free available satellite remote sensing imagery and a pair of digital elevation models (DEM) aimed to detect and spatially and temporally quantify the large scale bulk earthworks in Lanzhou area.
2. Study area
The study area is located on the western margin of the Loess Plateau, one of the largest loess deposits of the world, covering an area of about 600,000 km2 (Wang, Citation2015). The thickness of the loess deposits in the surroundings of Lanzhou exceeds over vast areas 10 m and reaches up to 300 m in the northern part of Lanzhou (Derbyshire, Dijkstra, Unwin, & Wang, Citation2000; Dijkstra, Citation2000). Approximately 60% of the study area is covered by loess of different Pleistocene age ().
Figure 1. Project area depicting the generalized lithostratigraphic settings based on Geological Map (Gansu Bureau of Geology and Mineral Resources (GBGMR), Citation1987) with underlying shaded relief produced in 2012.
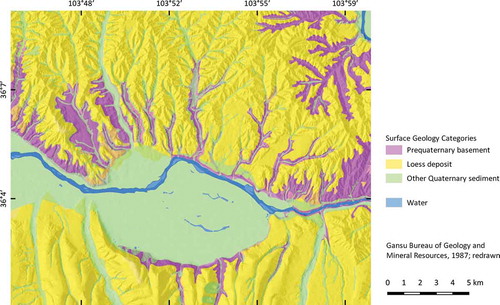
The natural topography of the study area is characterized by undulating furrowed loess deposits wrapping a paleo-landscape influenced by the river incision of the Yellow River and tectonic activity induced by the ongoing Himalayan orogenesis. The elevation of the mountainous area is oscillating between 1500 and 2200 m above sea level (m a. s. l.).
As introduced above, due to its narrowed position in the Yellow River Valley, extensive building activity and expansion since 2002, Lanzhou suffers from limited suitable building ground. Therefore, the ambitious plan of developing the Lanzhou New Area (LNZ) can only be realized by expansion into the semi-natural hilly landscape. Being comparably soft sediment loess can be excavated, moved, and densified to leveled building ground by heavy machinery such as bulldozers.
3. Methodology and analysis
3.1. Principal component analysis in change detection
Specific materials at the surface are exhibiting measurable spectral differences, which might be of interest for the application of change detection. The distinguishing of freshly exposed loess material as a result of earthwork activities from other spectral classes such as vegetation of varying vitality or urban area is the primary scope.
In the current study, PCA was chosen among the methods mentioned in the introduction part as the potentially appropriate method given the local conditions of the study area. Change detection PCA became a standard methodology in remote sensing over the past decades (e.g. Byrne, Crapper, & Mayo, Citation1980; Gong, Citation1993). Nevertheless, it is worth it to be briefly introduced.
PCA is a technique applied to reduce dimensions in multidimensional data and to identify patterns highlighting their similarities and differences. PCA is an orthogonal transformation method to convert a set of possibly correlated variables into a linear combination of a set of pair-wise uncorrelated variables called principal components (PCs). Thereby, the covariance of the variables subdivides into two parts: the scale part and direction part. The so-called eigenvectors characterize the direction part forming an orthonormal basis, and thus, constitute the independence (no correlation among eigenvectors) of the PCs. The scalar values of these eigenvectors the so-called eigenvalues are considered as a magnitude describing the variance in a particular direction. The PCs are defined in such a way that the maximum variance of the variables is held in the first PCs and the amount of variance is decreasing with subsequent PCs. This means, for the set of correlated variables, the sufficient amount of information is contained in the first few PCs allowing a reduction of the dimensions of the dataset. The normalized eigenvalues of the eigenvectors provide the proportion of the overall variance explained by the PC, in some packages dealing with PCA also denoted as importance. The decision of how many PCs should be considered in the analysis is frequently made applying the Kaiser Criterion. This criterion compares the normalized eigenvalues (importance) and provides a cutoff threshold for the PCs with importance ≤ 1.
Applied for change detection on a multi-temporal multispectral image stack, the first PC is bearing the information that is common to all images in the stack (unchanged areas). The differences marking changed areas are contained in the following PCs. Thus, changes are identifiable by the interpretation of the loadings of the eigenvectors and the binning of the factor values of the PCs (Drury, Citation1993; Gong, Citation1993).
To support the decision on how much difference is contained in which PC, a contrast of the eigenvector loadings C can be introduced. The contrast C can be calculated as:
where ciA is the ith band of scene A and ciB is the ith band of scene B.
The interpretation of the contrast is straightforward. The larger the contrast, the higher are the differences between the two scenes contained in the specific PC. Moreover, one can focus on the contrast of the eigenvector components (bands) most sensitive to particular surface changes and use them for the selection of the most appropriate PC to identify the changed areas. For geological mapping, short wave infrared (SWIR) bands are known to provide high contrast values. Focusing on the SWIR contrasts in the PCs supports the decision on the selection of the PC that is best for identification of areas modified by bulk earthworks. Once the PC with the most considerable SWIR contrasts among the two scenes is found, the factor values of this PC – rescaled between 0 and 255 – can be used to determine the threshold to separate the changed from unchanged areas. Because the factor values are usually nearly normally distributed, a threshold T for the delineation of such areas can be found, e.g. considering standard deviation σ with a value smaller or greater than T (Gong, Citation1993).
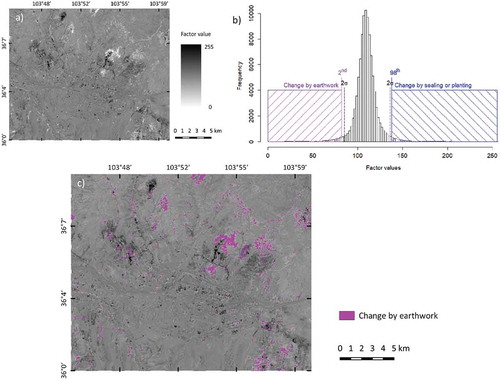
In this study, the 2nd and the 98th percentile were proved as applicable thresholds (). These percentiles are used as thresholds to separate approximately the extreme values in a normal distribution. The changed areas can be now interpreted in both directions, exposed areas due to earthwork activities or newly sealed areas, e.g. by greening or construction work. The decision which side of the distribution is to take to mark the exposure is obtainable from the loadings of the second time scene for the SWIR components. Negative loadings indicate exposed areas; positive loadings indicate sealing of the areas by construction or greening. Because sealing activities are post-earthwork activities, they are not in the focus of the current study.
Figure 2. Classification steps of changed areas, illustrated on PC2 from image stack 2013–10-11 to 2015–10-10: a) Selected greyscale coded PC containing the changes; b) Binning statistics of the factor values with 2nd and 98th percentiles representing changes; c) Mapping of the changed areas according to the binning statistics.
3.2. Tools and data
The change detection analysis was performed on Landsat imaginary in GRASS GIS (GRASS Development Team, Citation2017), providing the PCA as a standard processing tool. Postprocessing of the PCA results was made in QGIS (QGIS Development Team, Citation2017).
Landsat imagery from comparable annual time without cloud cover was used to minimize the influence caused by phenological or climate conditions. In total, six scenes from the Landsat 5 mission called as Thematic Mapper (TM), and two scenes from the Landsat 8 mission with the Operational Land Imager (OLI) were selected covering a period between 1994 and 2015 (). The Landsat imagery acquired from USGS Earth Explorer is atmospherically corrected and transformed to the surface reflectance (NASA, Citation2016). Each of the selected scenes contains six solar reflectance bands: blue, green, red, near-infrared (NIR), and the two SWIR. The obtained data stack enables a subdivision of the 21 years in seven intervals ranging from two to seven years.
Table 2. Landsat scenes included in the study.
The reflectance data of the blue, green, red, NIR, and both SWIRs were included in the PCA for each image and calculated pairwise. Thus, in each PCA, twelve bands were scrutinized starting with the scenes from the years 1994 and 2001, followed by scene combination for the years 2001 and 2004 and so on.
3.3. Analysis workflow
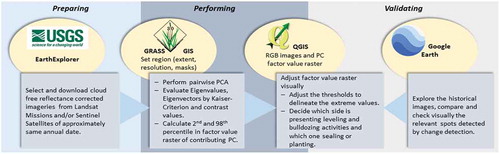
The general workflow for change detection in this study can be described in the following steps ():
Generation of the GRASS GIS project (import data, set region extent and resolution);
Perform PCA subsequently for Landsat scene pairs;
Dimension reduction to the significant PCs based on Kaiser-Criterion (e.g. Backhaus, Erichson, & Plinke et al., Citation2015);
Screening the contrast to reveal the PC containing the most significant differences among the loadings of the eigenvectors;
Estimation of the factor values thresholds indicating changes in selected PC layer based on the loadings of the SWIR bands;
Exclude the city area located in the Yellow River valley;
Visual adjustment of the chosen factor values with the respective images in QGIS;
Validation of the mapped changed areas
Perform area statistics per time interval.
Figure 3. Analysis flow chart.
For the area, descriptive statistics were calculated. The loadings of the input bands in the new PC were utilized for that purpose. The loadings indicate the contribution of the single input bands in the process of forming the PC. Based on the algebraic sign of contributions of the SWIR bands, it can be decided whether the low or the high factor values in the newly formed PC layer is representing earthwork areas.
4. Results
4.1. PCA results
lists the PCA results for PCs with eigenvalue importance greater than one. In particular, it displays the list of PCs for the seven scene pairs with corresponding eigenvector loadings describing the contribution of each component to the eigenvector.
Table 3. Important PCs, eigenvalues, loadings of the eigenvector for corresponding six bands, importance, and contrast C; the utilized PCs are in bold.
The interpretation of the results is straightforward. The respective first PC holds almost 90% of the variance of the original data and represents unchanged areas in the scenes of different dates emphasized by the loadings of the eigenvector, which are similar among the components (bands) of both scenes. Small variations in atmospheric and light and shadow conditions can explain small differences of the loadings. Also, the contrast value shows that the loading differences of the first PC are neglectable. For the majority of scene pairs, the second PC (PC2) possessed the highest contrast and was found appropriate to be used for change identification. For one scene pair, the third PC (PC3), for another, the fourth PC (PC4) showed the highest contrast and were consequently applied for further analysis. As expected, the contribution of both SWIR bands to the contrast value is comparably high in all PCs, which has been found suitable for identification of changes in loess, highlighted in .
depicts the changed areas for corresponding scene pairs based on the 2nd, and the 98th percentile classification. In total, the estimated study area is about 416 km2. However, the central area of Lanzhou City was excluded from the analysis as it was already entirely urbanized. Therefore, the total area considered for the change detection and used for calculation of the statistics is about 353 km2.
Figure 4. Changed areas in time intervals and validation spots; depicted on the Sentinel-2 scene [11/01/2016] (Natural colors: RGB bands 4, 3, 2). The city area is excluded.
![Figure 4. Changed areas in time intervals and validation spots; depicted on the Sentinel-2 scene [11/01/2016] (Natural colors: RGB bands 4, 3, 2). The city area is excluded.](/cms/asset/876cbdda-32b4-44eb-9a19-cd0f02a5218d/tbed_a_1640412_f0004_c.jpg)
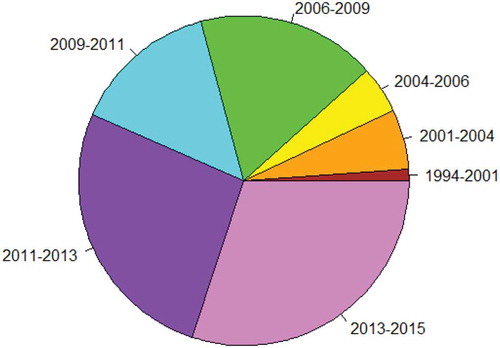
The results illuminate that in the last two decades, about 10% of the semi-natural loess area has been affected by bulk earthworks and construction activities (). These activities exhibit surficial removal of material at different scales. For large scale projects, these activities are associated with the massive reshaping of the landscape morphology, including leveling of hills and filling up of preexisting valleys.
Figure 5. The proportion of the leveled and bulldozed area in the respective periods.
4.2. Validation of PCA classification
Checking the accuracy of the results is based on the following validation sources:
Examination in the field;
Visual interpretation of the high-resolution imagery in Google Earth.
The spatial pattern of changed areas in shows that the majority of the leveling and reshaping activities have been conducted in the north of Lanzhou city.
The indicated geomorphological changes were validated in a field campaign on three spots, the Taipingyang-, Biguiyuan- and Jiuzhou development zone (), which are all located to the north of Lanzhou City. All three locations, which were a grassland or bare ground with a semi-natural loess morphology before, are now under preparation for construction or already occupied by housing communities and commercial business districts. The new land created by the leveling and reshaping activities was compacted, and the artificial slopes were engineered.
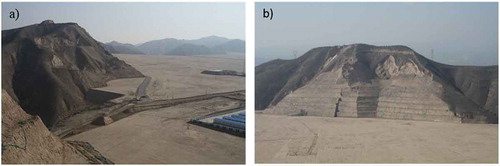
One zone, the Taipingyang development zone in the north-eastern part of Lanzhou City, is depicted in . In this area, the loess mountains were leveled in the period from 2012 to 2013. With an elevation model of 10 m resolution produced before the year 2013, the minimum and maximum altitude values in that area were estimated (NASG, Citation2012). At the beginning of 2012, the altitude ranged between 1564 m and 1840 m. In an area of about 4.4 km2, the morphology was changed from a hilly loess landscape with some fluvial channels to a peneplain by leveling of more than 200 m in height. Massive construction activities have not been started yet in this area.
Figure 6. Taipingyang development zone, July 2017, a) leveling and b) terracing work to generate construction land.
Comparable changes are observable in the Biguiyuan development zone. However, here the flat area is already consumed for erecting of high-rise buildings. The slopes on the boundary of the project area have been engineered by step-slope excavation ()).
Figure 7. a) Housing community in the Biguiyuan development zone, 27–04-2016, b) Commercial building district and housing community in the Jiuzhou development zone, 26–04-2016.
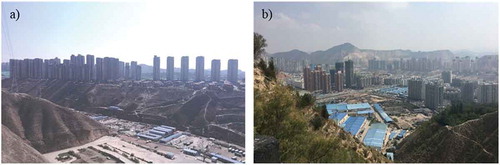
The Jiuzhou development zone, former an unused land located northeast of Lanzhou city, has now become a popular and busy region filled with housing communities and commercial buildings ().
For visual interpretation, we used the high-resolution imageries provided by Google Earth. The number of high-resolution images covering specific periods varies in Google Earth depending on the area of interest. For Lanzhou more than 60 images from different dates covering the period from 2001 until today are available allowing spot-wise validation of regions of interest for particular time intervals. shows an example of visual interpretation. In the eastern part of the today’s completely developed Biguiyuan project area changes were revealed between Landsat scenes from Oct 2001 and Oct 2004 by the PC 2 (). The high-resolution images available from November 2002 and January 2004 indicate that the leveling activities started in 2002 and were conducted mainly in 2003–2004 (). The shapes of automatically detected areas and visually recognizable changes are matching well, considering a different resolution of the compared imagery.
Figure 8. Example of a visual check with Google Earth, showing leveling activities in Biguiyuan development zone in 2002–2004: a) Factor values of the change detection between the scenes Oct 2001 – Oct 2004. b) The beginning phase of earthworks in 2002 [11/25/2002]; c) Shape of the development area in November 2004 [11/04/2004]. Differences in the brownish hues indicate the leveling area in the center of the picture.
![Figure 8. Example of a visual check with Google Earth, showing leveling activities in Biguiyuan development zone in 2002–2004: a) Factor values of the change detection between the scenes Oct 2001 – Oct 2004. b) The beginning phase of earthworks in 2002 [11/25/2002]; c) Shape of the development area in November 2004 [11/04/2004]. Differences in the brownish hues indicate the leveling area in the center of the picture.](/cms/asset/0a3ea4b8-8083-411b-a4b9-59b9edf810ad/tbed_a_1640412_f0008_c.jpg)
4.3. Estimation of moved volumes
At first glance, a comparison of two DEMs of different dates seems to be a straightforward method to estimate geomorphological changes directly from the DEM comparison. So, high-resolution DEMs based on airborne LiDAR are recently used to visualize and to quantify geomorphological changes in dynamic regions such as coastal erosion processes, e.g. after storm events (e.g. Burvingt, Masselink, Russel, & Scott, Citation2016). Unfortunately, this proves to be not that easy for arbitrary areas of the world in which no consequent monitoring program and subsequently no repetitive airborne laser scanning (LiDAR) measurements were conducted during the last years. Although different satellite missions provide DEMs in a ground resolution of 10 m covering a large part of the world, some issues remain in a direct comparison of these data. For the project area, we acquired two DEMs from different dates with a ground resolution of 10 m. The first DEM is a product from the ZY-3 satellite mission (optical sensor) generated from a stack of scenes of 2012. The second DEM is a custom-tailored space born radar-based product from the TerraSAR-X satellite mission generated from the data acquired in the period from July to August 2016 (Astrium GEO-Information Services, Citation2011).
The first comparison of the two DEMs revealed that the differences between both DEMs are not interpretable without additional information due to different sensors and not comparable data processing approaches. Uncertainties in both DEMs cause general differences also in areas not affected by bulk earthwork activities. Especially in the southern part of the study area, high relief regions exhibit significant deviations between both DEMs that cannot be lead back to a specific change of the morphology. Because, the radar-based DEMs are generally known for issues in areas of high relief, the general interpretation of all computed differences between both DEMs as anthropogenic changes would be misleading. However, for large construction sites detected in the PCA as coherent areas and verified by field checks and visual interpretation of high-resolution imageries, the differences can be interpreted. Thus, based on the DEM data, the volumes of the displaced material during the development of the Taipingyang zone was roughly estimated ( and ). The results of the PCA change detection were used to generate a mask layer in which the differences between the two DEMs could be interpreted meaningfully. The obtained difference pattern inside the masked area reveals the former ridge and valley structure leveled during the reclamation earthwork (). Based on the obtained difference pattern, a rough balance for cut and fill activities was established. The results show that 1.7 km2 of the 4.6 km2 area was leveled by cutting and 1.9 km2 by filling. Considering elevation uncertainties of both DEMs of about 10 m, the morphology in the Taipingyang development zone was changed by cutting hills up to 110 m and filling valleys up to 100 m. In this area, the Precambrian granite and the Cretaceous sediments former outcropped in the valleys were covered by remolded loess of several tens of meters. A rough volume of the displaced material was estimated at 57 million m3.
Figure 9. Elevation difference classes on the validation spot Taipingyang a) elevation in 2012, b) elevation in 2016, c) cutting and filling difference classes depicted on a Sentinel-2 scene [11/01/2016] (Natural colors: RGB bands 4, 3, 2).
![Figure 9. Elevation difference classes on the validation spot Taipingyang a) elevation in 2012, b) elevation in 2016, c) cutting and filling difference classes depicted on a Sentinel-2 scene [11/01/2016] (Natural colors: RGB bands 4, 3, 2).](/cms/asset/5311e5a7-d14d-46eb-a139-553266d905b7/tbed_a_1640412_f0009_c.jpg)
5. Discussion and conclusions
The presented change detection applied with a one-sided interpretation of the PCA-results is suitable for identification areas in which the sediments were exposed and moved. In particular, in the loess dominated landscape, the bright reflectance of the freshly exposed loess in the SWIR bands contributes to the PCs indicating the changes between two dates. The contrasts of these bands contribute more than 50% of the total contrast in the two scenes.
Based on the change detection from multispectral satellite imageries, no information can be derived about the magnitude or type of earthwork activity that caused the detected change. However, the more coherent the changed areas are, the more likely is it that the earthworks were conducted as cut and fill activities. Additionally, change detection must be combined with other methods such as ground truth and a visual interpretation of high-resolution imageries.
Great care is needed comparing DEMs from different origins. The difference between the elevations of optical-based and radar-based DEMs cannot be interpreted successfully without additional information due to uncertainties of the DEMs caused by issues of data acquisition and processing. The introduced application of change detection can support the estimation of material volumes displaced by earthwork activity providing verified spots for which the differences of the DEMs can be interpreted more meaningfully. In this context, it should be noticed that, of course, elevation models based on LIDAR campaigns in fixed time intervals would provide more reliable and accurate results for volume estimation at those spots. However, such activities are costly and must have been done before the changes occurred to have a precise reference surface. Compared to LIDAR, utilization of increasingly popular photogrammetric solutions in the field of Unmanned Aerial Vehicles (UAV) could reduce the costs, but currently, the covered areas remain to be comparably small and still cannot serve for assessments at regional scales.
Economic zones, corridors, or spots in the P. R. of China are subject to continuous development. In particular, the northwestern part of the country, including the central loess plateau is affected by the increasing urbanization and establishment of new economic spots. The proposed method applied to identify changes caused by earthworks can be used for other loess dominated landscapes.
Characterization of the spatiotemporal environmental changes can provide constraints for many further analyses such as statistical landslide susceptibility assessment. Because statistical methods are not designed to reveal causal relations, but the association of specific variables, the knowledge of the locations and the speed of temporal changes have to be incorporated. The findings of this study help in the context of statistical landslide susceptibility analysis to create a framework describing the human-induced evolution of the landscape.
The continuation of the change detection time series based on Sentinel-2 data, or based on a combination of Landsat and Sentinel-2 would increase the probability to have access to cloudless scenes also in shorter time intervals.
Data availability statement
Derived data supporting the findings of change detection study are available from the corresponding author on request. Restrictions are given for the compared elevation models due to contract.
Disclosure statement
No potential conflict of interest was reported by the authors.
References
- Astrium GEO-Information Services. (2011). Geo Elevation10, technical product specification. Infoterra GmbH, 23. Retrieved from https://apollomapping.com/wp-content/user_uploads/2012/04/GEOElevation10_Technical-Product-Specification_v1.pdf
- Backhaus, K., Erichson, B., Plinke, W., & Weiber, R. 2015. Multivariate analysis methods: An application-oriented introduction. Berlin, Heidelberg: Springer. P. 637. (In German). doi:10.1007/978-3-662-46076-4
- Ban, Y., & Yousif, O. (2016). Change detection techniques: A review. In Y. Ban (Ed.), Multitemporal remote sensing. remote sensing and digital image processing (Vol. 20). Cham: Springer.
- Burvingt, O., Masselink, G., Russel, P., & Scott, T. (2016). Beach response to consecutive extreme storms using LiDAR along the SW coast of England. In: A. Vila-Concejo, E. Bruce, D. M. Kennedy, & R. J. McCarroll (Eds.), Journal of Coastal Research (Special Issue, No. 75, pp. 1052–1056). Proceedings of the 14th International Coastal Symposium (Sydney, Australia).Coconut Creek, FL. ISSN 0749-0208.
- Butzler, K. W. (2012). Collapse, environment, and society. Processing of the National Academy of Science of the United States of America, 109, 3632–3639.
- Byrne, G. F., Crapper, P. F., & Mayo, K. K. (1980). Monitoring land-cover change by principal component analysis of multitemporal Landsat data. Remote Sensing of Environment, 10(3), 175–184. ISSN0034-4257. doi:10.1016/0034-4257(80)90021-8
- Deng, J. S., Wang, K., Deng, Y. H., & Qi, G. J. (2008). PCA‐based land‐use change detection and analysis using multitemporal and multisensor satellite data. International Journal of Remote Sensing, 29(16), 4823–4838.
- Derbyshire, E., Dijkstra, T. A., Unwin, D., & Wang, S. (2000). Slope instability distribution mapping, 230-242. In E. Derbyshire & D. T. A. Meng (Eds.), Landslides in the thick loess terrain of North-West China (pp. 288). New Jersey, NJ: Wiley.
- Dewi, R. S., Bijker, W., & Stein, A. (2017). Change vector analysis to monitor the changes in fuzzy shorelines. Remote Sensing, 9(2), 147.
- Dijkstra, T. A. (2000) Loess slope stability in the Lanzhou region, China. Netherlands Geographical Studies, 301 p., Utrecht.
- Drury, S. A. (1993). Image Interpretation in Geology. (2nd ed., pp. 283). New York, NY: Chapman & Hall
- Ehrlich, P. R., & Ehrlich, A. H. (2013). Can a collapse of global civilization be avoided? Proceedings of the Royal Society B: Biological Sciences, 280, 20122845.
- Gansu Bureau of Geology and Mineral Resources (GBGMR) (1987). Geoenvironmental exploration report of Lanzhou city (in Chinese), Technical Report, Volume 3, Gansu, Lanzhou, 131 p.
- Gong, P. (1993). Change detection using principal component analysis and fuzzy set theory. Canadian Journal of Remote Sensing, 19(1), 22–29.
- GRASS Development Team (2017). Geographic Resources Analysis Support System (GRASS) Software, Version 7.2.1 Open Source Geospatial Foundation. http://grass.osgeo.org.
- Heute, A., Didan, K., Miura, T., Rodriguez, E. P., Gao, X., & Ferreira, L. G. (2002). Overview of the radiometric and biophysical performance of the MODIS vegetation indices. Remote Sensing of Environment, 83, 195–213.
- Li, J., & Roy, D. P. (2017). A global analysis of sentinel-2A, sentinel-2B and landsat-8 data revisit intervals and implications for terrestrial monitoring. Remote Sensing, 9(9). https://www.mdpi.com/2072-4292/9/9/902
- Li, P., Qian, H., & Wu, J. (2014). Accelerate research on land creation. Nature, 510(29). http://www.nature.com/news/environment-accelerate-research-on-land-creation-1.15327
- Liu, B. J., & Wu, Y.-Y. (2011). Development zones in China: Are STIPs a substitute for or a complement to ETDZs? Taipei Economic Inquiry, 47(1), 97–145. Retrieved from http://www.ntpu.edu.tw/econ/files/Journal/20110308170007.pdf
- Lu, D., Mausel, P., Brondízio, E., & Moran, E. (2004). Change detection techniques. International Journal of Remote Sensing, Taylor & Francis, 25, 2365–2401.
- Marsh, G. P. (1865). Man and nature; or physical geography as modified by human action (pp. 560). New York, NY: Charles Scribner & Co.
- McNeil, C. L., Burney, D. A., & Burney, L. P. (2010). Evidence disputing deforestration as the cause for the collapse of the ancient Maya polity of Copan, Honduras. Proceedings of the National Academy of Sciences of the United States of America, 107(3), 1017–1022.
- Ministry of Commerce (2016). A Brief Introduction of National Economic and Technological Development Zones in China. http://www.china.org.cn/english/SPORT-c/76751.htm
- Munyati, C. (2004). Use of principal component analysis (PCA) of remote sensing images in wetland change detection on the Kafue Flats, Zambia. Geocarto International, 19(3), 11–22.
- NASA (2016). NASA Land Processes Distributed Active Archive Center (LP DAAC) Products.
- NASG (2012). National administration of surveying mapping and geo-information, China. http://en.nasg.gov.cn/
- Price, S. J., Ford, J. R., Cooper, A. H., & Neal, C. (2016). Humans as major geological and geomorphological agents in the Anthropocene: The significance of artificial ground in Great Britain. Philosophical Transactions of the Royal Society A, 369, 1056–1084.
- QGIS Development Team (2017). QGIS geographic information system, open source geospatial foundation. http://qgis.osgeo.org
- Sherlock, R. L., & Woodward, A. S. (1922). Man as a geological agent: An account of his action on inanimate nature (pp. 372). London: Witherby.
- Tian, T., Balzer, D., Wang, L., Torizin, J., Wan, L., Li, X., … Tong, B. (2017). Landslide hazard and risk assessment Lanzhou, Province Gansu, China - project introduction and outlook. In Mikos M., Tiwari B., Yin Y., & Sassa K. (Eds.), Advancing culture of living with landslides: Volume 2 advances in landslide science (pp. 1027–1033). WLF 2017. Cham: Springer International Publishing.
- Torizin, J., Wang, L., Fuchs, M., Tong, B., Balzer, D., Wan, L., … Chen, L. (2018). Statistical landslides susceptibility assessment in a dynamic environment: A case study for Lanzhou city, Gansu Province, NW China. Journal of Mountain Sciences, 15(6), 1299–1318.
- Wang, Z. (2015). Boundary data of loess plateau region, global change research data publishing & repository. doi:10.3974/geodb.2015.01.09.V1
- Wilkinson, B. H. (2005). Humans as geologic agents: A deep-time perspective. Geology, 33(3), 161–164.
- Xiaolu, S., & Bo, C. (2011). Change detection using change vector analysis from landsat TM images in wuhan. Procedia Environmental Sciences, 11, 238–244.