
ABSTRACT
Through an analysis of station observations and reanalysis data, in this study, we investigate the variations of dust activity during 1979–2015 in western and southwestern Iran and their associated mechanisms. The dust day frequency (DDF) is used to identify dust activities. The results show larger interannual variabilities in the DDF in spring and summer, with standard deviations (σ) of 10% and 13%, respectively. Correlation analyses reveal that the interannual variability of DDF in western Iran is largely regulated by wind speed, precipitation and soil moisture in the region. The regional mean spring (March–May) DDF shows strong negative correlations with spring precipitation (correlation coefficient R = −0.5) and soil moisture (R = −0.6) over western to southwestern Iran, but strong positive correlations between the springtime DDF and surface winds can be found with the R reaching 0.4–0.6. Dust activity in the summer dry season (June–August) is mainly associated with surface winds over southwestern Iran, especially in regions near the Persian Gulf, where the R between the DDF and surface winds reaches 0.5. Meanwhile, the summer DDF also shows strong negative correlations (R < −0.4) with soil moisture of the top layer in the middle to southern part of the region. These results highlight the key roles of wind speed, precipitation and soil moisture in determining the interannual variation of dust activities in western and southwestern Iran.
1. Introduction
Dust activity has a significant impact on the environment and human health (e.g., Lin, Levy, Lei, & Bell, Citation2012), particularly in the “Dust Belt” that stretches from the Sahara across the Middle East to northeastern Asia (Middleton, Citation2019). Over the Middle East, dust emissions and concentrations have increased by 15% in the last decade (Yu, Kalashnikova, Garay, Lee, & Notaro, Citation2018), and it has been found that the formation of dust storms in the Middle East is influenced by both thermal and dynamic processes in the atmosphere. The strong wind speed and low humidity lead to the formation of dust in arid regions and in the deserts of the Middle East (Najafi et al., Citation2014); this dust formation is influenced by large-scale circulation, including Mediterranean trough and Azores Subtropical high pressure at 500 hPa and Saudi Arabia, Persian Gulf, Sudan, and Mediterranean low pressure at sea level. Dust sources and their temporal characteristics in the Middle East were investigated by Furman (Citation2003) using clustering analysis. Overall, there is a large area in the Middle East where the surface is prone to wind erosion due to the arid and semiarid nature of the climate in the region (Furman, Citation2003). The Iraqi Alluvial plain, the Syrian Desert, and the Rub al-Khali and Ad-Dahna deserts in Saudi Arabia are identified as the major sources of dust in the Middle East (e.g., Draxler, Gillette, Kirkpatrick, & Heller, Citation2001; Goudie & Middleton, Citation2001; Léon & Legrand, Citation2003). In addition, studies also reported that dust from sources located in other regions can intensify dust events through local dust emission (e.g., Boloorani et al., Citation2014).
Observations have shown a high frequency of dust storms in the western and southeastern parts of Iran (e.g., Cao, Liu, Wang, Yang, & Luo, Citation2015; Middleton, Citation2019; Modarres & Sadeghi, Citation2018), and the areas of western Iran, the Khuzestan Plain and the coastal plain of the Persian Gulf in southwestern Iran (the study areas in this research) constitute a regional belt of high-frequency dust outbreaks (Alizadeh-Choobari, Ghafarian, & Owlad, Citation2016). The high frequency of dust storms in these regions has been attributed to several factors, including low vegetation cover in the arid lands in Iran (Broomandi, Dabir, Bonakdarpour, & Rashidi, Citation2017a; Esmaili, Tajrishy, & Arasteh, Citation2006; Najafi et al., Citation2014), recent droughts in western Iran (Zoljoodi, Didevarasl, & Saadatabadi, Citation2013), and dust transportation from other regions (e.g., Alizadeh-Choobari et al., Citation2016; Yu, Notaro, Kalashnikova, & Garay, Citation2016). The seasonal variations of dust events in western Iran are remarkable, and the highest frequency of dust events is found in summer, when strong Shamal winds are persistent and little precipitation is received (Alizadeh-Choobari et al., Citation2016).
There are large interannual variations in dust event frequency in Iran, as shown in several previous studies (e.g., Alizadeh-Choobari et al., Citation2016; Rashki, Arjmand, & Kaskaoutis, Citation2017). There are concerns as to why dust activity varies interannually, and whether natural or anthropogenic factors can intensify dust storm occurrences and, consequently air pollution, in the western provinces of Iran (Zoljoodi et al., Citation2013). Although several researches have been carried out to characterize the general features, dust sources and transport pathways of dust particles over Iran through ground-based measurements and satellite remote sensing (e.g., Ghasem, Shamsipour, Miri, & Safarrad, Citation2012; Nabavi, Haimberger, & Samimi, Citation2016; Najafi, Sarraf, Zarrin, & Rasouli, Citation2017; Omidvar, Citation2006; Rashki et al., Citation2017), the long-term interannual dust variation and its mechanism in western and southwestern Iran have not been adequately studied. In particular, it is of primary importance to quantify the impact of climate factors, such as wind speed and precipitation, on the interannual variation of dust activities such that the contribution of anthropogenic activities during a specific period can be further identified. While the impact of upstream dust sources (Iraq, Syria, Saudi Arabia) on dust events over western Iran have been well investigated (e.g., Broomandi, Dabir, Bonakdarpour, & Rashidi, Citation2017b; Sotoudeheian, Salim, & Arhami, Citation2016), in this study, we focus on the impact of local meteorological factors (surface winds, precipitation, soil moisture) on dust phenomena over western and southwestern Iran.
Therefore, as a first step, we attempt to understand and quantify the role of the main climate factors influencing dust frequency in western and southwestern Iran, with a focus on the potential impacts of wind velocity, precipitation, and soil moisture on the interannual variations of dust events in the period of 1979–2015. Given the different possible mechanisms for dust activity in the spring (March-April-May, hereafter “MAM”) and summer (June-July-August, hereafter “JJA”) (Yu et al., Citation2015) seasons, the interannual variability of dust activity in spring and summer and their associations with climatic factors will be examined separately.
The paper is organized as follows. Section 2 briefly describes the area of study, and Section 3 introduces the research data. The results of interannual dust event variations and their possible mechanisms are presented in Section 4. Finally, conclusions are given in Section 5.
2. Regional background
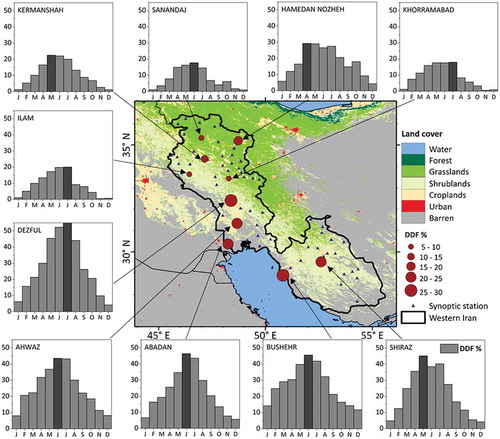
This study is focused on the western-southwestern part of Iran. As shown in , the area of study includes the Khuzestan, Kermanshah, Kurdistan, Hamedan, Lorestan, Ilam, Bushehr, and Fars provinces located between the high elevation in the Zagros Mountain Range and the low elevation in the western boundaries of Iran. Land cover maps show that there are grasslands in the northern part of western Iran, while shrublands, croplands, and barren lands are located in the central to southern part of the study area ().
Figure 1. Topographic map of the Middle East (gray shaded). Western and southwestern Iran provinces are shown in yellow. The white text denotes mountains.
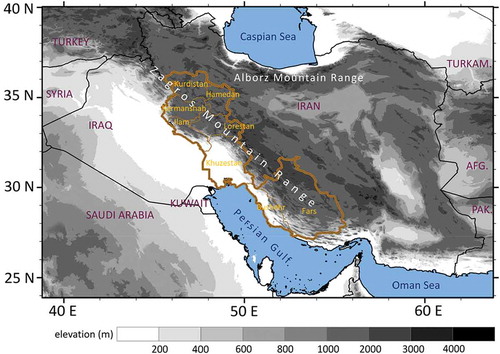
Figure 2. Map of western and southwestern Iran, with the shaded land cover product of MODIS (MCD12Q1). The stations used for dust observations in this study are shown, with the size of circles indicating the percentage frequency of dust days (DDF) from 1979 to 2015. The monthly mean DDF for each station are also shown, and the most active months are marked in a darker color.
In this region, the source of water vapor is humid air flows moving eastward and southeastward with low-pressure centers during a period of approximately 7 months per year, from mid-October to mid-April (Khalili & Rahimi, Citation2018). The climate in southwestern and western Iran is mainly shaped by the Zagros Mountain Range to the northeast under the influence of large-scale mid-latitude climate systems. The Zagros Mountains along with the Alborz Mountains in northern Iran serve as a boundary for the arid/semiarid climate zones in the south and the relatively humid climate zones in the north. High elevations in the central Zagros Mountains have a very cold climate with heavy snow in winter, while western and southwestern Iran are recognized as semiarid to hyperarid climate zones. The climatic conditions in these regions have been described in several studies (Khalili, Hajam, & Irannezhad, Citation1997; Khalili & Rahimi, Citation2018). These regions receive most of their precipitation in winter and spring but receive much less precipitation in summer, which leads to more dust events in summer than in other seasons (Zoljoodi et al., Citation2013). Note that winter snowfall and spring snowmelt can serve as a source of soil moisture in the northern part of the study area, and thus, they may impact wind erosion in spring and summer.
3. Data description and methodology
3.1. Dust data
Dust observations during 1979–2015 from 10 stations (with long term records) across western Iran were collected by the Islamic Republic of Iran Meteorological Organization (IRIMO) and are used in this study. For each station, the present weather code is recorded every 6 h; synoptic code “06” is for dust in suspension, “08” is for well-developed dust or sand whirl, “09” is for dust storm or sandstorm, and “30–32” is for slight or moderate dust storm/sandstorm. The full dust-related weather codes are listed in . In this study, a day was considered a “dusty day” if any dust-related weather code is reported once during the day, as suggested by Shao and Wang (Citation2003). Therefore, a dusty day is a combined measure of the frequency and intensity of dust events, similar to the measure used by Yu et al. (Citation2015). The spatial distribution of these stations is illustrated in , and their names and coordinates are given in .
Table 1. Phenomena related to dust according to the World Meteorological Organization (WMO) weather codes.
Table 2. List of the 10 western Iran stations used in this study.
Following Yu et al. (Citation2015), the monthly dust day frequency (DDF) at each station is calculated by dividing the number of dust days by the total number of days with available weather observations in a specific month. The regional mean DDF time series is based on the average of the 10 observation stations.
3.2. Meteorological station data
Time series data of monthly accumulated precipitation, average mean wind speed and maximum wind speed from 3-h observations at 66 synoptic stations over western Iran during the period of 1979–2015 were also obtained from IRIMO. The data are applied to investigate the relationship between climate factors and dust activities. The spatial distribution of these 66 synoptic stations is illustrated in . Note that only 10 of the 66 meteorological stations with long-term dust records are used in this study, as indicated in Section 3.1.
The Global Precipitation Climatology Centre (GPCC) Version 7 gridded monthly precipitation dataset with a spatial resolution of 1° × 1° (Schneider et al., Citation2017) is applied to calculate precipitation anomalies and identify the relationship between precipitation and dust activity in western Iran.
3.3. Reanalysis data
To explore the spatial patterns of wind velocity and their association with the dust event frequency, we also use gridded wind velocity data from the ERA‐Interim reanalysis, produced by the European Centre for Medium‐Range Weather Forecasts (ECMWF) on a 0.5° × 0.5° grid (Dee et al., Citation2011). We derived the monthly wind speed at the surface (10 m) from the six-hourly data.
To investigate local soil moisture conditions, soil moisture in the topsoil level (0–7 cm) is obtained from six-hourly ERA-Interim/Land reanalysis, a global land surface reanalysis data set covering the period 1979–2010 with a horizontal resolution of approximately 80 km. ERA-Interim/Land is derived from a 32-year simulation with the latest ECMWF land surface model. The ECWMF land surface model is driven by meteorological forcing from the ERA-Interim atmospheric reanalysis with precipitation adjustments based on the Global Precipitation Climate Project (Balsamo et al., Citation2015). The daily means are averaged to derive monthly means. shows summarized information about the dataset used in the study.
Table 3. A summary of datasets used in this study.
When calculating the correlation coefficient of the interannual variations between the DDF and the related climate factors, the linear trend of dust activities and climatic variables will be removed. A correlation coefficient calculated using the Pearson correlation with a p value smaller than 0.1 (90% significant) for the two-tailed significance test is regarded as statistically significant in this study. Note that the critical value of Pearson’s r for the two-tailed test at n = 37 is 0. 275.
4. Results
4.1. Seasonal variations
shows the annual mean spatial pattern of the DDF at 10 stations in western and southwestern Iran during 1979–2015. There is a positive meridional gradient of the DDF with a larger DDF in the south of study area than in the north. The largest dust activity (28%) is observed at the Dezful station in shrublands, while the lowest (8%) is observed the Sanandaj station located in grasslands in the northern region. The average DDF at 10 synoptic stations in western and southern Iran is 18%. The monthly variation of the DDF at each station is also shown in . The maximum DDF is observed in June and July at most stations, and overall, the seasonal cycle of the stations is similar.
) shows the seasonal cycle of the DDF averaged over the stations in the western-southern part of Iran (section 2). The regional mean precipitation, wind speed and maximum wind speed are also shown in ) to illustrate the reasons for the seasonal variations in the DDF. The observations show that 75% of yearly dust events occur in the months of March to August when the monthly DDF is above 15%, which is consistent with previous studies (Alizadeh-Choobari et al., Citation2016; Doabi, Afyuni, & Karami, Citation2017; Nabavi et al., Citation2016; Sarraf, Rasouli, Mohammadi, & Sadr, Citation2016). The DDF is lowest in December (4%), and after January, it begins to increase and peaks in June and July (33%), followed by a decrease from August to December. The seasonal mean DDF is 29% in summer (June to August), and it is only 7% in winter (December-January-February).
Figure 3. (a) Monthly mean DDF, precipitation, average wind speed and maximum wind speed during 1979–2015 and (b) wind speed frequency (WSF) in the months of March to August in western Iran.
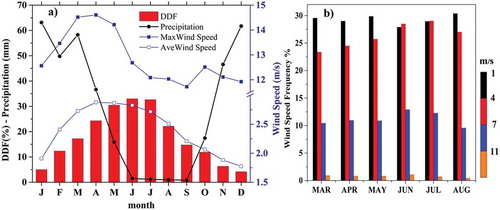
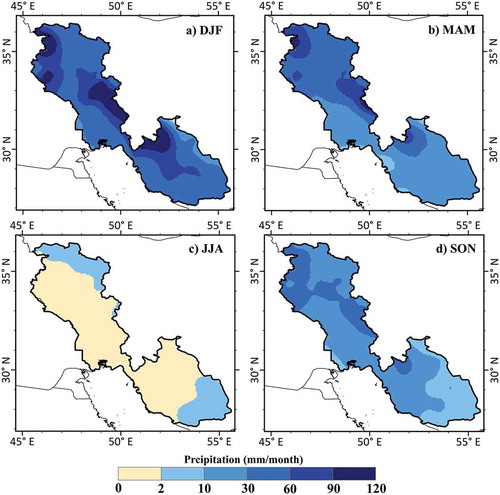
The seasonal variations of DDF are mainly determined by seasonal variations in precipitation and surface winds. As shown in ), precipitation in western Iran dramatically decreases from the cold seasons (December to March) to the warm seasons (June to September). The mean precipitation is approximately 1–2 mm/month in warm seasons, while the mean precipitation is approximately 50–60 mm/month in cold seasons ()). The spatial distributions of the seasonal mean precipitation in DJF, MAM, JJA, and SON are further shown in . Precipitation is lower than 2 mm/month in summer in almost the entire region, especially in the low elevation area, and precipitation is relatively higher (10–60 mm/month) in spring ()). In winter, precipitation is greatest with a magnitude exceeding 30 mm/month in the whole region and exceeding 120 mm/month in the high elevations. Precipitation is slightly lower in autumn than in spring. Therefore, the extremely dry weather conditions in summer have made the soil susceptible to wind erosion.
Figure 4. Mean monthly precipitation in (a) winter, (b) spring, (c) summer and (d) autumn in western Iran.
For wind speed, both the monthly maximum and mean wind speed peak in April (14.5 and 2.9 m/s, respectively) and gradually decrease later ()). The lowest value of the monthly maximum wind speed is approximately 11.8 m/s in September. As wind erosion occurs under strong wind conditions, we examine the number of 3-h observations with surface wind speed falling into each interval of the WMO classification (<1, 1–4, 4–7, 7–11, >11 m/s) at 10 synoptic weather stations across western Iran during 1979–2012. The frequency distribution of wind speed from March to August is shown in ). The frequency of calm wind speed conditions (1–4 m/s) (30%) is higher in August than in other months in summer and spring. July has the highest frequency (29%) of wind speeds between 4 and 7 m/s. Stronger wind speeds (> 7 m/s) have the highest frequency in June.
Based on the seasonal variation mentioned above, the DDF is much higher in spring and summer than in winter and autumn. Next, we will focus on the interannual variations of DDF in spring and summer.
4.2. Interannual variability of spring dust activities
The temporal variations of regional mean spring DDF during 1979–2015, both before and after removal of a linear trend, are shown in . The standard deviation of the spring DDF over western Iran during 1979–2015 is 10%, with a mean DDF of 25%, and the highest DDF (45%) occurred in 2012 ().
Figure 5. Time series of the dust day frequency (DDF) in spring (blue) and summer (red) during 1979–2015, and their time series after the removal of the linear trend (detrend). Horizontal lines represent the mean DDF in spring and summer.
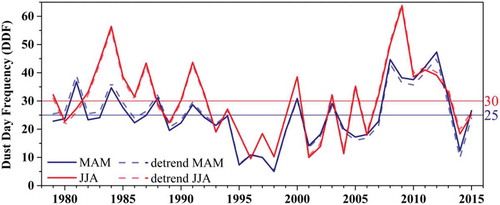
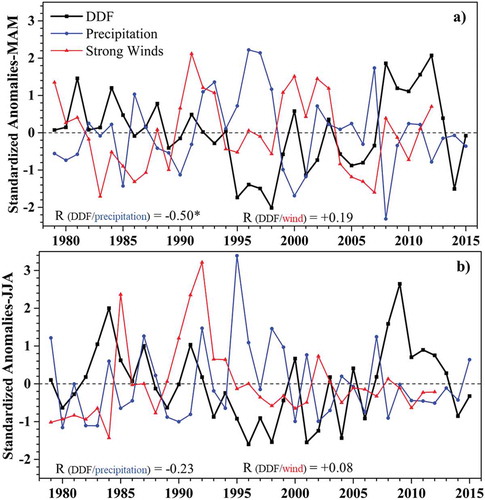
Dust activities are mainly determined by surface winds, precipitation, and soil moisture. ) also shows the temporal variations of regional mean spring surface wind speed and precipitation based on station observations. For comparison, standardized anomalies of the regional mean DDF, surface wind, and precipitation are shown here. We can see from ) that for regional means, dust activity is negatively correlated (−0.50) with precipitation and positively correlated (+0.19) with strong wind frequency (> 11 m/s) in spring over western Iran. The high dust activities in 2008 and 2012 coincide with both low precipitation and strong winds, while the low dust activities during 1995-1998 are associated with high precipitation and relatively weaker winds.
Figure 6. Anomalies (standardized by mean and standard deviation) of the regional mean DDF, precipitation and frequency of strong winds (wind speed more than 11 m/s) in (a) spring and (b) summer during 1979–2015. The correlation coefficients (R) between the DDF and precipitation/wind are also shown with the asterisk denoting a statistical significance at the 0.1 level.
The temporal correlation coefficients (TCCs) between the anomalies of DDF and the climate factors (precipitation, wind speed) at 10 observation stations in spring are further summarized in ). We observe positive correlations between the DDF and wind speed ()) with correlation coefficients reaching 0.59. This is expected, as wind is the driving force for dust emission and transportation. This relationship is greater for average wind speed than for maximum wind speed at some stations ().
Figure 7. Temporal correlation coefficient between DDF and precipitation and wind speed in spring (a) and summer (b) at the stations. The asterisks denote that the correlation is statistically significant at the 0.1 level. Note that if the correlation coefficient between the DDF and frequency of winds at any intervals (e.g., 1–4 m/s) is larger than that between the DDF and mean wind speed (AveWind), this larger correlation coefficient will be presented.
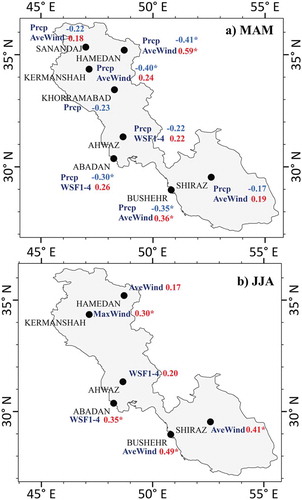
The large interannual variability of precipitation is a typical characteristic of arid and semiarid climates that significantly affects the soil and vegetation conditions (Liu, Yin, Zhang, & Yang, Citation2004; Xu, Levy, Lin, & Chen, Citation2006). In spring, we can see that the DDF is negatively correlated with precipitation at most stations, and the highest correlation can be observed at the Hamadan and Kermanshah stations (R around −0.40) in the northern region ()). This may be explained by the fact that precipitation has been shown to be a major factor in determining soil conditions and, thus, can significantly impact the DDF (e.g., Lin et al., Citation2012; Liu et al., Citation2004; Pu & Ginoux, Citation2018; Wu et al., Citation2018). A positive correlation between dust activity and rainfall in spring can also be found over the Arabian Peninsula (Yu et al., Citation2015). Yu et al. (Citation2015) showed that dust activity over Saudi Arabia is associated with dryness in the prior winter and concurrent spring (JFMAM) across the desert regions of the Arabian Peninsula.
Overall, it can be seen from ) that the TCC of precipitation/wind speed and DDF in spring follow the regional mean ()) at most stations, particularly in the northern region and Persian Gulf region.
As dust activities may not only occur at a station but also in the whole region, the temporal correlation between the DDF and key climate factors (surface winds, precipitation, soil moisture) in the whole regions is further examined.
The TCCs between the regional mean DDF in western Iran and surface wind speed (10 m) are shown in ). Strong positive correlations (R > 0.4) between the spring DDF and surface (10 m) wind speed are found across western Iran. The strongest correlations in the northern and southern region of the study area correspond to correlations at stations ()). In spring, the high DDF is largely controlled by southwesterly winds in the northern part of southwestern Iran and by northwesterly winds in the southern part of the region. The regression of surface wind upon the DDF suggests that a surface wind speed enhancement of approximately 1 m/s is responsible for a two standard deviation positive anomaly in the springtime DDF ()).
Figure 8. Temporal correlation coefficient (TCC) between regional mean the DDF in western Iran and concurrent wind speed at 10 m (a, d), precipitation (b, e), and soil moisture (c, f) at each grid box in spring (left column) and summer (right column) during 1979–2015. Wind speed data is from ERA-Interim reanalysis. Precipitation is from GPCC V7 reanalysis, and soil moisture is from ERA-Interim/Land reanalysis. Soil moisture is available only for 1979–2010, and thus, the TCC between the DDF and soil moisture is calculated for 1979–2010. Note only positive correlation coefficients for wind speed and negative correlation coefficients for precipitation and soil moisture are shown. The green vectors denote the regression of surface wind upon DDF. Note only areas with positive regression coefficients of wind speed upon DDF that are statistically significant at the 0.1 level are displayed. Dots in Figure 8(b,c,e,f) denote the statistical significance at 0.1 confidence level (i.e., correlation coefficients >0.275).
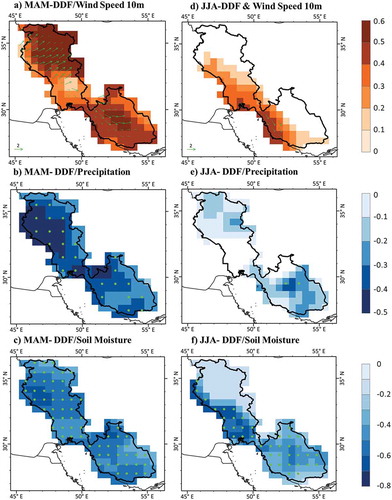
A strong correlation between the DDF and precipitation is found over western Iran ()), which is demonstrated by the TCC between the DDF and the precipitation from station observations. The strongest TCC between the DDF and precipitation is found in the northern region of the study area (−0.5), close to the TCC value at two stations in this region (Kermanshah, Hamedan).
Similar to precipitation, soil moisture in the top layers also showed a strong correlation (−0.6 to −0.8) with the spring DDF across western Iran ()). There are two centers with strongly negative correlation in the northern and southern regions of the study area.
4.3. Interannual variability of summer dust activities
The regional mean DDF in western Iran shows large variations in summer for the period 1979–2015 (). The standard deviation of summer DDF over western Iran is 13%, and the mean DDF is 30%, which is higher than that in spring. The highest DDF (64%) occurred in 2009.
The TCCs between the regional mean DDF and climate factors (precipitation and wind speed) in summer is shown in ). As summer precipitation is very low for almost all years, summer precipitation is not the dominant factor that can affect the interannual variation of occurrences of wind erosion in summer, and thus, we cannot imagine a high correlation between summer rainfall and the DDF ()). In fact, the regional mean of summer DDF and precipitation are only weakly correlated (−0.23). The regional mean of summer DDF also shows a weakly positive correlation (0.08) with the frequency of strong winds (>11 m/s) ()).
The TCC between the DDF and key climate factors at the observation stations are summarized in ). During the summer season, dust activity is positively correlated with surface wind speed at most stations, and the highest correlation is at the Bushehr and Shiraz stations (R = 0.49 and 0.41, respectively) in southwestern Iran. Although the TCC of strong wind and the DDF is weak for the regional mean ()), correlations at most stations are strong, especially in the southern region and Persian Gulf region ()).
At the regional scale, a positive correlation between the DDF and surface wind speed (10 m) in summer can be found in southwestern Iran and the coastal regions, with the highest correlation coefficient reaching 0.5 locally ()). In the dry season of summer, the north-westerly Shamal wind tends to persist, and it plays an important role in determining the occurrence of dust events in arid lands in western and southwestern Iran (Najafi et al., Citation2017).
The role of precipitation in western Iran during the summer season is less important than that in spring. None of the stations show a significant correlation between the DDF and precipitation ()), which is probably due to the extremely small amount of precipitation that quickly evaporates upon falling on the ground in this season. A similar result was also reported in the Middle East region (Yu et al., Citation2015). Although there is no correlation between precipitation and the DDF at all stations ()), there is a weak correlation between these factors in the regional mean ()). A similar result with a weak correlation is also found for the TCC between the regional mean DDF and GPCC precipitation over the study area ()).
The patterns of the TCC between the summer DDF and summer soil moisture show strong negative correlations between the DDF and soil moisture along local dust sources in the middle (−0.70) and southern (−0.40) section of the study area ()). However, it should be mentioned that antecedent precipitation can affect wind erosion in the Middle East region through the memory of antecedent soil moisture (Liu et al., Citation2004; Orth & Seneviratne, Citation2012; Zoljoodi et al., Citation2013) and the impact of vegetation growth.
5. Conclusion
Western and southwestern Iran has been identified as a region with frequent dust activity, which poses a range of hazards to the environment and human health. In this study, the interannual variabilities of dust activity in western and southwestern Iran were investigated at local to regional scales. Statistical correlation analysis was conducted to explain the mechanisms of these variabilities in dust activity. The results show dust events occur more frequently in spring (March–May) and summer (March–August) than in other seasons, which is consistent with previous studies (Alizadeh-Choobari et al., Citation2016; Sarraf et al., Citation2016). The high interannual variability of the dust day frequency (DDF) is also found in spring and summer, with standard deviations of 10% and 13%, respectively.
For the correlation of the DDF with key climate factors, we found positive (negative) correlations between the DDF and wind speed (precipitation) in spring at most stations. The summer DDF in western Iran is also strongly correlated with surface wind in the Iran–Iraq border and coastal regions ()). However, there is a much weaker correlation between the DDF and precipitation in summer, which may be due to the fact that there is very little precipitation (<2 mm/month) in summer in almost every year, and thus, the DDF is less dependent on precipitation. Despite this, the summer DDF is strongly correlated with summer soil moisture in western Iran, indicating the important role of soil conditions in determining the summer DDF.
The correlation between the DDF and key climate factors shown here indicates that the DDF in western Iran is largely regulated by surface wind, precipitation, and soil moisture. It should be noted that our results are mainly based on correlation analysis using monthly data, thus the physical associations between the DDF and key meteorological factors require further validation using high-frequent observations for dust events (e.g., satellite and station observations) and model simulations. Another limitation in this study is that the dust frequency information derived from synoptic weather station observations represents dust phenomena of all categories (), as the frequency for different categories of dust events is not currently available. However, it is desirable to separate different categories of dust events and to further investigate the associated mechanisms for each category of dust activity in the future.
Acknowledgments
We would like to thank the Islamic Republic of Iran Meteorological Organization (IRIMO) for access to weather data. The European Centre for Medium‐Range Weather Forecasts (ECMWF) reanalysis project for wind field and soil moisture data, and the Global Precipitation Climatology Centre (GPCC) for precipitation data over Middle East are gratefully acknowledged.
Data availability statement
Meteorological data are available on the Islamic Republic of Iran Meteorological Organization (IRIMO) website: https://data.irimo.ir. Reanalysis wind speed data from ERA-Interim and soil moisture data from ERA-Interim/Land data are available at the following website: https://apps.ecmwf.int/datasets. Precipitation dataset from GPCC V7 are available at the following website: https://www.esrl.noaa.gov/psd/data/gridded/data.gpcc.html.
Disclosure statement
No potential conflict of interest was reported by the authors.
Additional information
Funding
References
- Alizadeh-Choobari, O., Ghafarian, P., & Owlad, E. (2016). Temporal variations in the frequency and concentration of dust events over Iran based on surface observations. International Journal of Climatology, 36(4), 2050–2062.
- Balsamo, G., Albergel, C., Beljaars, A., Boussetta, S., Brun, E., Cloke, H., & Pappenberger, F. (2015). ERA-Interim/Land: A global land surface reanalysis data set. Hydrology and Earth System Sciences, 19(1), 389–407.
- Boloorani, A. D., Nabavi, S. O., Bahrami, H. A., Mirzapour, F., Kavosi, M., Abasi, E., & Azizi, R. (2014). Investigation of dust storms entering Western Iran using remotely sensed data and synoptic analysis. Journal of Environmental Health Science and Engineering, 12(1), 124.
- Broomandi, P., Dabir, B., Bonakdarpour, B., & Rashidi, Y. (2017a). Identification of dust storm origin in South–West of Iran. Journal of Environmental Health Science and Engineering, 15(1), 16.
- Broomandi, P., Dabir, B., Bonakdarpour, B., & Rashidi, Y. (2017b). Identification of the sources of dust storms in the City of Ahvaz by HYSPLIT. Pollution, 3(2), 341–348.
- Cao, H., Liu, J., Wang, G., Yang, G., & Luo, L. (2015). Identification of sand and dust storm source areas in Iran. Journal of Arid Land, 7(5), 567–578.
- Dee, D. P., Uppala, S., Simmons, A., Berrisford, P., Poli, P., Kobayashi, S., & Bauer, D. P. (2011). The ERA‐Interim reanalysis: Configuration and performance of the data assimilation system. Quarterly Journal of the Royal Meteorological Society, 137(656), 553–597.
- Doabi, S. A., Afyuni, M., & Karami, M. (2017). Multivariate statistical analysis of heavy metals contamination in atmospheric dust of Kermanshah province, western Iran, during the spring and summer 2013. Journal of Geochemical Exploration, 180, 61–70.
- Draxler, R. R., Gillette, D. A., Kirkpatrick, J. S., & Heller, J. (2001). Estimating PM10 air concentrations from dust storms in Iraq, Kuwait and Saudi Arabia. Atmospheric Environment, 35(25), 4315–4330.
- Esmaili, O., Tajrishy, M., & Arasteh, P. D. (2006). Results of the 50 year ground-based measurements in comparison with satellite remote sensing of two prominent dust emission sources located in Iran. In Remote sensing of clouds and the atmosphere XI (Vol. 6362, p. 636209). Stockholm, Sweden: International Society for Optics and Photonics.
- Furman, H. K. H. (2003). Dust storms in the Middle East: Sources of origin and their temporal characteristics. Indoor and Built Environment, 12(6), 419–426.
- Ghasem, A., Shamsipour, A., Miri, M., & Safarrad, T. (2012). Synoptic and remote sensing analysis of dust events in southwestern Iran. Natural Hazards, 64(2), 1625–1638.
- Goudie, A., & Middleton, N. (2001). Saharan dust storms: Nature and consequences. Earth-science Reviews, 56(1–4), 179–204.
- Khalili, A., Hajam, S., & Irannezhad, P. (1997). Integrated water plan of Iran. Iran: Meteorological Studies, Ministry of Power, 4, 59–88.
- Khalili, A., & Rahimi, J. (2018). Climate. In M. Roozitalab, H. Siadat, & A. Farshad (Eds.), The soils of Iran. World soils book series (Chap. 3, pp. 25). Cham: Springer. doi:10.1007/978-3-319-69048-3_3
- Léon, J. F., & Legrand, M. (2003). Mineral dust sources in the surroundings of the north Indian Ocean. Geophysical Research Letters, 30, 6.
- Lin, Z., Levy, J. K., Lei, H., & Bell, M. L. (2012). Advances in disaster modeling, simulation and visualization for sandstorm risk management in North China. Remote Sensing, 4, 1337–1354.
- Liu, X., Yin, Z. Y., Zhang, X., & Yang, X. (2004). Analyses of the spring dust storm frequency of northern China in relation to antecedent and concurrent wind, precipitation, vegetation, and soil moisture conditions. Journal of Geophysical Research: Atmospheres, 109(D16210).
- Middleton, N. (2019). Variability and trends in dust storm frequency on decadal timescales: Climatic drivers and human impacts. Geosciences, 9(6), 261.
- Modarres, R., & Sadeghi, S. (2018). Spatial and temporal trends of dust storms across desert regions of Iran. Natural Hazards, 90(1), 101–114.
- Nabavi, S. O., Haimberger, L., & Samimi, C. (2016). Climatology of dust distribution over West Asia from homogenized remote sensing data. Aeolian Research, 21, 93–107.
- Najafi, M. S., Khoshakhllagh, F., Zamanzadeh, S. M., Shirazi, M. H., Samadi, M., & Hajikhani, S. (2014). Characteristics of TSP loads during the Middle East springtime dust storm (MESDS) in Western Iran. Arabian Journal of Geosciences, 7(12), 5367–5381.
- Najafi, M. S., Sarraf, B., Zarrin, A., & Rasouli, A. (2017). Climatology of atmospheric circulation patterns of Arabian dust in western Iran. Environmental Monitoring and Assessment, 189(9), 473.
- Omidvar, K. (2006). Review and analysis of sand storms in Yazd-Ardakan basin. Geographical Researches Quarterly, 81, 43–58.
- Orth, R., & Seneviratne, S. I. (2012). Analysis of soil moisture memory from observations in Europe. Journal of Geophysical Research: Atmospheres, 117, D15.
- Pu, B., & Ginoux, P. (2018). Climatic factors contributing to long-term variations in surface fine dust concentration in the United States. Atmospheric Chemistry and Physics, 18(6), 4201–4215.
- Rashki, A., Arjmand, M., & Kaskaoutis, D. (2017). Assessment of dust activity and dust-plume pathways over Jazmurian Basin, southeast Iran. Aeolian Research, 24, 145–160.
- Sarraf, B. S., Rasouli, A., Mohammadi, G. H., & Sadr, A. H. (2016). Long-term trends of seasonal dusty day characteristics—West Iran. Arabian Journal of Geosciences, 9(10), 563.
- Schneider, U., Finger, P., Meyer-Christoffer, A., Rustemeier, E., Ziese, M., & Becker, A. (2017). Evaluating the hydrological cycle over land using the newly-corrected precipitation climatology from the Global Precipitation Climatology Centre (GPCC). Atmosphere, 8(3), 52.
- Shao, Y., & Wang, J. (2003). A climatology of Northeast Asian dust events. Meteorologische Zeitschrift, 12(4), 187–196.
- Sotoudeheian, S., Salim, R., & Arhami, M. (2016). Impact of Middle Eastern dust sources on PM10 in Iran: Highlighting the impact of Tigris‐Euphrates basin sources and Lake Urmia desiccation. Journal of Geophysical Research: Atmospheres, 121, 23.
- Wu, C., Lin, Z., Liu, X., Li, Y., Lu, Z., & Wu, M. (2018). Can climate models reproduce the decadal change of dust aerosol in East Asia? Geophysical Research Letters, 45(18), 9953–9962.
- Xu, X., Levy, J. K., Lin, Z., & Chen, H. (2006). An investigation of sand-dust storm events and land surface characteristics in China using NOAA NDVI data. Global and Planetary Change, 52, 182–196.
- Yu, Y., Kalashnikova, O. V., Garay, M. J., Lee, H., & Notaro, M. (2018). Identification and characterization of dust source regions across North Africa and the Middle East using MISR satellite observations. Geophysical Research Letters, 45(13), 6690–6701.
- Yu, Y., Notaro, M., Kalashnikova, O. V., & Garay, M. J. (2016). Climatology of summer Shamal wind in the Middle East. Journal of Geophysical Research: Atmospheres, 121(1), 289–305.
- Yu, Y., Notaro, M., Liu, Z., Wang, F., Alkolibi, F., Fadda, E., & Bakhrjy, F. (2015). Climatic controls on the interannual to decadal variability in Saudi Arabian dust activity: Toward the development of a seasonal dust prediction model. Journal of Geophysical Research: Atmospheres, 120(5), 1739–1758.
- Zoljoodi, M., Didevarasl, A., & Saadatabadi, A. R. (2013). Dust events in the western parts of Iran and the relationship with drought expansion over the dust-source areas in Iraq and Syria. Atmospheric and Climate Sciences, 3(03), 321–336.