
ABSTRACT
Brazilian biomes are home to a significant portion of the world’s biodiversity, with a total of 14% of existing species and still concentrate 20% of the world’s water resources. However, changes in biomes have a direct impact on rainfall patterns and water recycling. Based on this, the objective was to evaluate the variability of rainfall in the four existing biomes in the Northeast Brazil (NEB) and their interaction with the ENSO climate variability mode and regional scale meteorological systems via CHELSA product. For this, monthly rainfall data were used from 1979 to 2013, with a spatial resolution of 1 km × 1 km of the CHELSA product, and seasonal and annual rainfall patterns were extracted via boxplot. It was found that the rainy season in the Amazon, Caatinga and Cerrado biomes occurred between January and April, with varying intensities, except for the Atlantic Forest. Such seasonality patterns are associated with the NEB meteorological systems, with emphasis on ITCZ (all Biomes), UTCV (Amazon, Caatinga and Cerrado), Frontal Systems (extreme south of Caatinga, Cerrado and Atlantic Forest) and EWD/TWD in the (Atlantic Forest). In the inter-annual scale, the remarkable influence of ENSO was verified, mainly in the years 1983, 1985, 1989, 1993, 1998, 2009 and 2012. It is noteworthy that 1985 was the wettest year of the period, with a surplus in all biomes, while the driest year differs between the Amazon (1983), Atlantic Forest and Caatinga (1993) and Cerrado (2012) biomes. The study via orbital product in NEB showed that anthropogenic processes and natural variability interfere with the forms of rain interception in the biomes and hence in rainfall patterns and water recycling in NEB.
1. Introduction
Brazilian biomes are shelter to a significant portion of the world’s biodiversity (Agostinho, Thomaz, & Gomes, Citation2005), holding about 14% of all existing species (Lewinsohn & Prado, Citation2002). In the Atlantic Forest biome, the concentration of water resources is equivalent to 20% of the world’s existing water resources, being one of the important centers of biodiversity due to the combination of high levels of wealth and endemism (Agostinho et al., Citation2005; Clemente, Oliveira Júnior, & Louzada, Citation2017; Sano, Rosa, Brito, & Ferreira, Citation2010; Scarano & Ceotto, Citation2015), however little explored (Agostinho et al., Citation2005; Scarano & Ceotto, Citation2015). In the last century, Holdridge (Citation1947) proposed a classification of the world’s plant formations using climate data from a triangular diagram. It showed the relationship between potential evapotranspiration (PET) and rainfall, annual precipitation and biotemperature. Therefore, the origin and evolution of the biome concept goes through the relationship between phytophysiognomy and climate variables, especially rainfall. (Coutinho, Citation2006).
One of the main challenges for maintaining biomes is related to recent changes in land use and occupation, especially the replacement of natural landscape areas by agriculture, livestock and urban development (Barros Santiago, Correia Filho, de Oliveira-júnior, & da Silva Junior, Citation2019; Correia Filho, de Barros Santiago, de Oliveira-júnior, & da Silva Junior, Citation2019; Roesch et al., Citation2009; Santos et al., Citation2018; Scarano & Ceotto, Citation2015). Another challenge is linked to the impacts of land use and occupation on climate change (Marengo, Williams, Alves, Soares, & Rodriguez, Citation2016a; Salazar, Nobre, & Oyama, Citation2007), which are a constant threat to the biodiversity preservation of Brazilian biomes, especially those predominant forestry and with greater species richness and endemism: Amazon and Atlantic Forest (Aleixo, Albernaz, Grelle, Vale, & Rangel, Citation2010; Clemente et al., Citation2017; Marengo et al., Citation2016a; Panisset et al., Citation2018; Salazar et al., Citation2007).
The climate has a strong influence on triggering extreme events such as prolonged and severe droughts, which aggravates environmental degradation as the episode occurred in 2005 in the Amazon biome (Marengo et al., Citation2016a; Panisset et al., Citation2018), and also in the Caatinga biome (Barbosa, Kumar, Paredes, Elliott, & Ayuga, Citation2019; Lyra, Oliveira-Júnior, Gois, Cunha-Zeri, & Zeri, Citation2017; Marengo et al., Citation2018; Marengo, Torres, & Alves, Citation2016b), which resulted in huge socio-economic and environmental damage.
When it comes to the climate aspect, one of the factors responsible for the cyclical occurrence of these events is El Niño-Southern Oscillation (ENSO) variability mode, which influences the dynamics in the oceans and, consequently, alters large-scale circulation patterns (Kayano, Andreoli, & Souza, Citation2013; Kucharski, Polzin, & Hastenrath, Citation2008; Souza & Cavalcanti, Citation2009). This change in the circulation pattern affects the intensities and frequencies of regional and seasonal meteorological systems, and hence the rainfall on the biomes in northeastern Brazil (NEB) (Kayano et al., Citation2013; Kucharski et al., Citation2008; Marengo et al., Citation2016a).
To date, the assessment of rainfall dynamics in NEB biomes has been restricted to studies, considering only one biome (Barbosa et al., Citation2019; Martins & De Oliveira, Citation2011; Mataveli et al., Citation2017) or more than a biome at state level (Barros Santiago et al., Citation2019; Correia Filho, Dos Santos, Diogo, & de Amorim, Citation2018). However, a regional study with all biomes and their relationship with rainfall via orbital product need to be investigated by the Brazilian and global scientific community. Therefore, the objective is to evaluate the variability of rainfall in the four existing NEB biomes and their interaction with the ENSO climate variability mode and regional meteorological systems via CHELSA product.
2. Material and methods
2.1. Study area
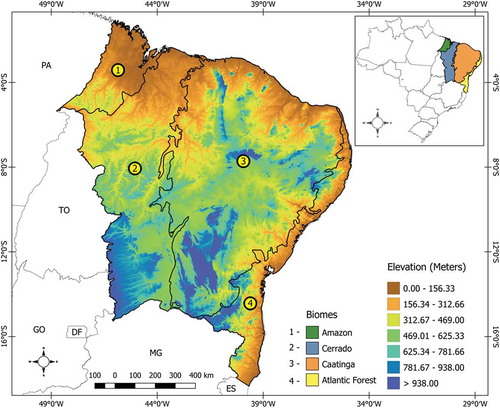
The evaluated biomes are located in the NEB region. The NEB is located between 01°02ʹ30” and 18°20ʹ07” S and 34°47ʹ30” and 48°45ʹ24” W. It is limited to the north (N) and east (E) with the Atlantic Ocean, to the south (S) with the states of Minas Gerais (MG) and Espírito Santo (ES), and to west (W) with the states of Pará (PA), Tocantins (TO) and Goiás (GO). The NEB is formed by nine states: Maranhão (MA), Piauí (PI), Ceará (CE), Rio Grande do Norte (RN), Paraíba (PB), Pernambuco (PE), Alagoas (AL), Sergipe (SE) and Bahia (BA). The NEB has an extension of 1,554 million km2, and an estimated population of 56.8 million (IBGE, Citation2019). In NEB are four biomes, they are: (a) Amazon; (b) Caatinga; (c) Cerrado; and (d) Atlantic Forest, illustrated in .
Figure 1. Study Area Location: (a) Brazil, (b) Northeast of Brazil (NEB), (c) biomes (Amazon, Caatinga, Cerrado and Atlantic Forest) located in the NEB.
2.2. NEB biomes
The Amazon biome is located in the state of Maranhão and has an estimated extension of 112.5 thousand km2, which represents 7% of the total NEB area (IBGE, Citation2002), at coordinates 0°47ʹ33”–05°37ʹ02” S and 43°37ʹ54”–48°53ʹ05” W. Amazon biome has great biodiversity and the existence of several conservation units (CUs), such as Gurupi Biological Reserve, Lençóis Maranhenses National Park, Mirador State Park and the newly created Chapada das Mesas National Park (Martins & De Oliveira, Citation2011).
The CUs are territorial spaces and their environmental resources, including jurisdictional waters, with relevant natural characteristics, legally established by the government aiming at conservation and with defined limits under special management regime, to which adequate guarantees of protection are applied (Brasil, Citation2000). Caatinga is located in the central NEB region, with an estimated area of 831.2 thousand km2 representing approximately 53% of NEB and 7% of Brazilian territory. In Caatinga there are several economic activities geared towards farming and industrial purposes followed by a wealth of environments and species, with 932 species of plants, 178 mammals and 590 birds (MMA, Citation2019).
The Cerrado is the second largest biome in South America, located in central Brazil with an estimated area of 2.03 million km2, corresponding to 22% of the national territory. It is located in the states of Maranhão, Piauí and Bahia with an estimated area of 465.5 thousand km2 (about 30% of the NEB area) (MMA – Ministério do Meio Ambiente, Citation2019). The Cerrado is recognized as savannah, being the most biodiverse biome in the world, sheltering 11,627 native plant species, of which approximately 4,400 are endemic species (existing only in this biome). In addition, it interacts with other biomes and has a phytophysiognomy (vegetation aspect of a region) diverse and unique (MMA – Ministério do Meio Ambiente, Citation2019).
The Atlantic Forest over NEB covers an area of approximately 164.7 thousand km2 (about 10%). However, of this total, the biome occupies an area of approximately 19.4 thousand km2 corresponding to 2.21% of its territory (Tabarelli, Melo, & Lira, Citation2006). This Biome is composed of Dense Ombrophylous Forest, Mixed Ombrophilous Forest, Open Ombrophilous Forest, Seasonal Semideciduous Forest, Deciduous Seasonal Forest, Savanna-Steppe Forested, Savanna-Steppe Forested, Savanna Woodland, Steppe Woodland, Pioneering Formations, Ecological Tension Areas and vegetation refuges (MMA – Ministério do Meio Ambiente, Citation2019).
2.3. Rainfall data – CHELSA
To evaluate the rainfall dynamics in the NEB biomes, we used rainfall data from the Climatologies at high resolution for the earth’s land surface areas (CHELSA) product (Karger et al., Citation2017). CHELSA data have a spatial resolution of 1 km × 1 km, with monthly timescale. The study period was from 1979 to 2013.
CHELSA product consists of data from weather stations arising from the Global Precipitation Climate Centre (GPCC), with a temporal resolution of 50 km × 50 km. This data set is subjected to the downscaling statistical technique for grid refinement from 50 km to 25 km, using the B-Spline interpolation method with the help of Era-Interim precipitation data. In the case of rainfall, we assessed the effects of the topography, wind pattern and Atmospheric Boundary Layer (ABL) height, which are refined from 25 km to 1 km (Karger et al., Citation2017).
In addition, this procedure includes the wind effect and ABL height for a grid adjustment from 25 km to 1 km, whose data are available at: <http://chelsa-climate.org/timeseries. They are stored in Geotiff extension files. After obtaining these files, rainfall data were pre-processed for the boundary regions of the four existing NEB biomes. After selecting each biome, the files were submitted to the following steps: (1) organization; (2) manipulation; (3) extraction of monthly rainfall values; (4) obtaining descriptive and exploratory statistics for the biomes.
All steps related to data processing, obtaining descriptive (mean, standard deviation, percentage and coefficient of variation, CV%) and exploratory (monthly boxplot) statistics, and the variability of the annual time series of biomes based on Oceanic Niño Index (ONI)-(Huang et al., Citation2015) were performed R software version 3.41 (R Development Team, Citation2017), using the packages raster version 2.6–7 (Hijmans, Citation2017), mapproj version 1.2–6 (McIlroy, Citation2018) and rgdal version 1.4–4 (Bivand, Tim Keitt, & Rowlingson, Citation2019). The ONI index is based on monthly Sea Surface Temperature (SST) anomalies in the Pacific Equatorial Region (available at: <https://origin.cpc.ncep.noaa.gov/products/analysis_monitoring/ensostuff/ONI_v5.php>) between latitudes 5°N to 5°S and longitudes 120° −170° W, known as the Niño 3.4 region. When the SST is greater than 0.5°C (below −0.5°C) is classified as El Niño (La Niña) (Huang et al., Citation2015), described in .
Table 1. Moderate and strong intensity ENSO (aTSM ± 0.5°C) from 1979–2017 (Huang et al., Citation2015).
3. Results and discussion
3.1. Descriptive statistics in NEB biomes
The annual, monthly and seasonal descriptive statistics of rainfall for the four NEB biomes are shown in –, respectively. It is verified by the mean ± standard deviation () that the Amazon ranged between 86.5 mm ± 77.5 mm (1983) and 217.0 mm ± 171.8 mm (1985), the Caatinga ranged between 32.5 mm ± 15.8 mm (1993) and 118.2 mm ± 90.8 mm (1985), the Cerrado between 83.5 mm ± 84.4 mm (1982) and 159.0 mm ± 133.3 mm (1985). In the Atlantic Forest, rainfall ranged from 78.2 mm ± 55.7 mm (1993) to 133.0 mm ± 70.8 mm (2011).
Table 2. Descriptive statistics (Mean, Standard Deviation – SD and Coefficient of Variation – CV) of annual precipitation for biomes located on NEB.
Table 3. Descriptive statistics (Mean, SD and CV) of monthly precipitation for biomes located on NEB.
Table 4. Descriptive statistics (Mean, SD and CV) of seasonal precipitation for biomes located on NEB.
Based on the annual CV%, the Amazon ranged from 66.8% to 116.0%, the Caatinga ranged from 48.6% to 125.0%, the Cerrado ranged from 76.8% to 129.3%, and the Atlantic Forest ranged from 30.5% to 71.2%. Highlighting the Caatinga and Cerrado biomes, with CV% values greater than 100% in 10 of the 35 years (28.5% of the total), this indicated greater dispersion of rainfall data, and although the time series is heterogeneous (Wilks, Citation1995). It is noteworthy that the standard deviation was higher than the average, this result showed high discrepancy in the time series, which in turn is associated with two factors: i) data from orbital products and ii) high spatiotemporal variability of rain in the NEB, already verified by previous studies (Lyra, Oliveira-Júnior, & Zeri, Citation2014; Rao, Hada, & Herdies, Citation1995). While the Atlantic Forest showed the lowest variability in rainfall, with values below 50%, in 20 of the 35 years of the time series (57.14% of the total) (Correia Filho, Lucio, & Spyrides, Citation2016; Lyra et al., Citation2014).
In the monthly scale (), the rainy season occurrence of each of the existing biomes in the NEB stands out. In the Amazon it occurred from December to May, with values between 111.6 mm ± 54.7 mm to 371.4 mm ± 86.4 mm, in Caatinga and Cerrado occurred between November and April, with values between 69.3 mm ± 47.7 mm to 143.1 mm ± 65.3 mm and 124.8 mm ± 43.5 mm to 203.1 mm ± 62.9 mm, respectively. In the Atlantic Forest, between March and August, with values between 101.8 mm ± 31.4 mm and 156.9 mm ± 50.3 mm.
In relation to the monthly CV%, for the Amazon and Cerrado biomes, the lowest values were found in the rainy season due to higher regularity of the rains, especially in the months of higher monthly accumulated, in this case, the lowest value occurred in March, 23.3% and 31.0%, respectively. In the case of Caatinga and Atlantic Forest, it occurred in July, with values of 38.7% and 26.0%, respectively.
Regarding seasonality (), the wettest quarter is identified, the months of March-April-May (MAM) in all NEB biomes, except for the Cerrado, whose quarter was December-January-February (DJF). The average rainfall for Amazonia, Caatinga and Atlantic Forest were 302.8 mm ± 128.4 mm, 107.6 mm ± 65.4 mm and 144.4 mm ± 56.1 mm, respectively. In the case of the Cerrado, it was 134.3 mm ± 82.2 mm. CV% in Amazonia was 42.4% for the MAM quarter, followed by 43.6% in Caatinga and Floresta Atlantica was 58.6% and 34.7% in the June-July-August (JJA) quarter, respectively. In the Cerrado, it was 43.6% in the quarter DJF.
3.2. Rainfall seasonality in NEB biomes
Seasonality of rainfall in NEB biomes via monthly boxplot showed high rainfall variability between biomes, especially in relation to median and interquartile range. Clearly, the Amazon (1847.9 mm ± 418.7 mm) ()), Caatinga (773.1 mm ± 212.5 mm) ()) and Cerrado (1196.6 mm ± 218.9 mm) ()) biomes showed that the rainy season occurred between January and April, but with varying intensities. The exception was the Atlantic Forest biome (1363.8 mm ± 217.0 mm) ()), with the rainy season between March and July. Outliers were remarkable in all biomes, especially in the rainy season, except for the Amazon biome.
Figure 2. Seasonal assessment of rainfall variability from 1979 to 2013, corresponding to NEB biomes: (a) Amazon; (b) Caatinga; (c) Cerrado and (d) Atlantic Forest.
It is noteworthy that in the Caatinga, Cerrado and Atlantic Forest biomes, the presence of outliers is associated with rainfall above the climatological average from CHELSA data. The months considered atypical were between January and March. When referring to the dry season in Amazon, Caatinga and Atlantic Forest biomes, it is between August and October, while in the Cerrado biome occurs between June and August (Nascimento, De Araújo, & Ferreira Júnior, Citation2011). During this dry season in NEB, mainly in the northeastern Amazon and Cerrado biomes, there is a significant increase in the number of fire outbreaks, mainly in the states of Maranhão. (Bezerra et al., Citation2018), Piauí and Bahia (Nascimento et al., Citation2011), from natural origin and/or anthropic activities (Bezerra et al., Citation2018; Caúla, Oliveira-Júnior, Lyra, Delgado, & Heilbron Filho, Citation2015; Mataveli et al., Citation2017; Sales et al., Citation2019).
Such a pattern of rainfall variability identified between biomes is directly associated with rainfall producing and inhibiting meteorological systems, which in turn act at distinct periods along the NEB (Lyra et al., Citation2014). It is noteworthy that NEB has a high interannual and intra-seasonal rainfall variability, with the thermal influence of the Pacific and Tropical Atlantic oceans, which control and modulate years of drought and flooding in the region (Alves et al., Citation2017; Correia Filho et al., Citation2016; Lyra et al., Citation2017), and therefore will drastically interfere with the rainfall dynamics of biomes.
Under rainy season analysis, the Atlantic Forest is located in the northeast coastal region, called Eastern NEB (ENEB) (Alves, Teixeira, & Ferreira, Citation2001; Correia Filho et al., Citation2016; Kouadio, Servain, Machado, & Lentini, Citation2012; Molion & Bernardo, Citation2002); this region is influenced by meteorological systems, called Eastern Wave Disturbance (EWD), Trade Wave Disturbance (TWD) and Mesoscale Convective Systems (MCS) (Alves et al., Citation2001; Gomes et al., Citation2019; Kouadio et al., Citation2012; Lyra et al., Citation2014). In relation to the northeastern Amazon, it is basically influenced by the performance of the Intertropical Convergence Zone (ITCZ) (Alves et al., Citation2017; Araújo, Andreoli, Cândido, Kayano, & Souza, Citation2009; Reboita & Santos, Citation2015; Silva, Alcântara, Souza, Olinda, & Gonçalves, Citation2017). ITCZ is located in the equatorial region of the globe and contributes significantly to rainfall in the northern NEB (NNEB). Furthermore, the moisture flow from the Amazon also contributes to the formation of Upper Tropospheric Cyclonic Vortex (UTCV), whose convective edge contributes to high rainfall rates (Correia, Aragão, Penaforte, & de Medeiros, Citation2019; Fedorova, Dos Santos, Segundo, & Levit, Citation2017; Kousky & Alonso Gan, Citation1981).
Finally, Caatinga and Cerrado, as they are located in much of the NEB, both biomes have similar rainfall characteristics; however, with intensities different, but both biomes are influenced by the ITCZ in the northern portion, while the far south is due to forays from the frontal systems that detach from the South Atlantic Convergence Zone (SACZ) (Kousky, Citation1979; Lyra et al., Citation2014). In addition to SACZ and ITCZ, there is also the UTCV acting in this period (Correia et al., Citation2019; Fedorova et al., Citation2017; Kousky & Alonso Gan, Citation1981).
3.3. Interannual rainfall variability in NEB biomes
In the annual analysis of rainfall in the NEB biomes (), there is a highly variable and similar cycle in the annual rainfall pattern common to all biomes, but with marked differences in their intensities. Regarding the annual mean totals, the highest rainfall was found in the Amazon compared to the other biomes with an annual mean around 1847.9 mm year−1. Annual rainfall totals identified in the Amazon biome are maintained by ITCZ in NNEB (Alves et al., Citation2017; Araújo et al., Citation2009; Reboita & Santos, Citation2015; Silva et al., Citation2017) and still associated with the process of evapotranspiration (ET) of the biome that contributes to the release of water vapor in the atmosphere and, consequently, causing the formation of rain-producing clouds (Fisch, Marengo, & Nobre, Citation1998; Salati, Dall’Olio, Matsui, & Gat, Citation1979; Xu, Agee, Wang, & Ivanov, Citation2019).
Figure 3. Illustration of the behavior of the annual time series: (a) biomes located in the NEB.
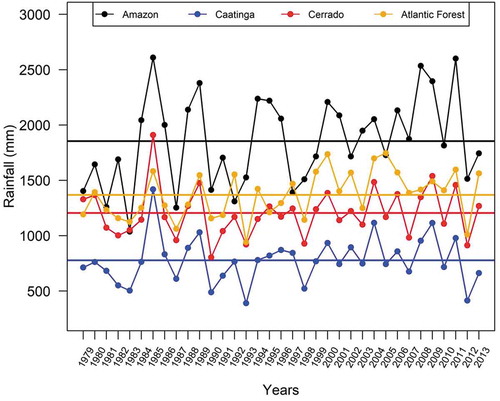
Regarding the Atlantic Forest and the Cerrado, the annual mean values were 1363.8 mm year−1 and 1196.6 mm year−1, respectively. In the Atlantic Forest is interconnected with the Inter-hemispheric Sea Surface Temperature Gradient (ISSTG) motivated by the Tropical Atlantic Variability (TAV) (Hounsou-gbo, Araujo, Bourlès, Veleda, & Servain, Citation2015; Lyra et al., Citation2017; Monerie, Robson, Dong, Hodson, & Klingaman, Citation2019; Tomaziello, Carvalho, & Gandu, Citation2016; Xie & Carton, Citation2004) and the occurrence of MCS and Mesoscale Convective Complexes (MCC), followed by the influence of EWD/TWD during the rainy season of NEB (Alves et al., Citation2001; Costa, Lima, Gonçalves, & Mattos, Citation2019; Gomes et al., Citation2019; Kouadio et al., Citation2012). In the Cerrado, the southern portion is influenced by the incursion of frontal systems (FS), which according to the literature is called “rest of cold fronts” (Kousky, Citation1979; Lyra et al., Citation2014; Silva & De Oliveira, Citation2017), in the northern portion is influenced by the ITCZ (Silva et al., Citation2017) and in the center is the UTCV that influences the rainfall pattern in the region (Correia et al., Citation2019; Fedorova et al., Citation2017; Kousky & Alonso Gan, Citation1981).
Regarding Caatinga, similar to the central pattern of the Northeastern Cerrado, UTCV influences the rainfall pattern in the region (Correia et al., Citation2019; Fedorova et al., Citation2017; Kousky & Alonso Gan, Citation1981). However, the low annual totals recorded are associated with their geographical position, situated in the northeastern semiarid region which has an irregular rainfall regime mainly motivated by the orography (Correia Filho et al., Citation2018; Reboita et al., Citation2016).
In this case, this occurs due to the positioning of orographic barriers, such as the Borborema Plateau and Diamantina and Araripe Plateaus (Correia Filho et al., Citation2018; Reboita et al., Citation2016), which prevent wind flow and humidity transport from the Atlantic Ocean to the interior of the NEB, thus inhibiting rainfall to the leeward of these orographic barriers.
Over the 34-year time series (1979–2013), there were well-defined annual cycles such as 1984/86, 1988/89, 1994/96, 2003/04, 2008/09, the exception was 2011, all above mentioned were above the climatological average, while the years 1979–1983, 1987, 1990–1993, 1997/98, 2002, 2005 and 2012/13 were below average. These annual variations in relation to the climatological average coincide with the action of the climate variability mode, El Niño-Southern Oscillation (ENSO) (Kayano et al., Citation2013; Marengo et al., Citation2018; Marengo & Hastenrath, Citation1993; Rodrigues, Haarsma, Campos, & Ambrizzi, Citation2011).
During the ENSO (El Niño) warm phase, there is a significant decrease in rainfall and prolonged drought regimes in NEB, especially in the northeastern semiarid region (Kayano et al., Citation2013; Marengo & Hastenrath, Citation1993; Marengo et al., Citation2016b; Rodrigues et al., Citation2011), where Caatinga is located. In addition, there is also a considerable increase in the number of fire records in the Amazon biome (Caúla et al., Citation2015; Fearnside, Citation2009). Regarding the Atlantic Forest, De Oliveira Souza et al. (Citation2018) found a decrease in vegetation cover along the NEB during ENSO episodes (except in Alagoas and Pernambuco); in addition, there was a reduction associated with urban sprawl and areas susceptible to desertification. Filgueira, Neto, and Barbosa (Citation2007) pointed out that the El Niño periods are marked by the record of low rainfall, preventing the outflow generation and the recovery of volumes stored in the dams, and mark the progressive decrease of the water mirrors, reaching the total emptying of the reservoirs.
During the ENSO (La Niña) cold phase, GISST, when associated with TAV negative in the southern Atlantic, affects the climatic positioning of the ITCZ, shifting it south of its climatic position (Reboita & Santos, Citation2015; Souza & Cavalcanti, Citation2009). This results in an increase in rainfall patterns and better distribution throughout the NEB (Kayano et al., Citation2013; Rodrigues et al., Citation2011). However, during the 2011–2012 La Niña occurrence, the negative Sea Surface Temperature Anomaly (SSTA) pattern in the combined Atlantic and Pacific Oceans resulted in the ITCZ displacement to north from its climatological position, which contributed to significantly decreased rainfall rates over the NEB (Rodrigues & McPhaden, Citation2014; Souza & Cavalcanti, Citation2009) which in turn especially affected the semiarid region and especially the Caatinga (Pereira, Justino, Malhado, Barbosa, & Marengo, Citation2014). Such effects have been devastating to NEB biomes, especially the economic sectors (Marengo et al., Citation2016b), and social and environmental problems (Marengo et al., Citation2018; Mariano et al., Citation2018; Pereira et al., Citation2014).
In addition, with the reduction of rainfall indices increased the biome ET, thus contributing to the reduction of soil moisture (Carrão, Russo, Sepulcre-Canto, & Barbosa, Citation2016) and hence aggravating the degradation of land use and occupation (Marengo & Bernasconi, Citation2015), and still contributing to the severity of the drought (Carrão et al., Citation2016; Marengo et al., Citation2018; Marengo & Bernasconi, Citation2015).
3.4. Actuation of ENSO phases on rainfall in NEB biomes
From the previous results (), four episodes of La Niña (1985, 1989, 2009 and 2012) and two episodes of El Niño (1983, 1993 and 1998) were selected for an intra-annual and annual total analyses, as shown in and . Comparing the monthly rainfall series and the climatological mean, it is verified that the anomalous series presented rainfall above (below) the climatological mean between the months of October and December (January and August), except for the years 1985, 1989 and 2009, in the occurrence of La Niña. In relation to the annual totals, the years mentioned had excess rainfall which in turn contributed significantly to the maintenance of the biomes in NEB, especially for Caatinga in 1985, with a gain of 645.0 mm year−1 (83.4% above the climatological mean).
Figure 4. Intra-annual behavior during ENSOs occurred in 1985, 1989, 1993, 1998, 2008 and 2012 in the biomes: (a) Amazon; (b) Caatinga; (c) Cerrado and (d) Atlantic Forest.
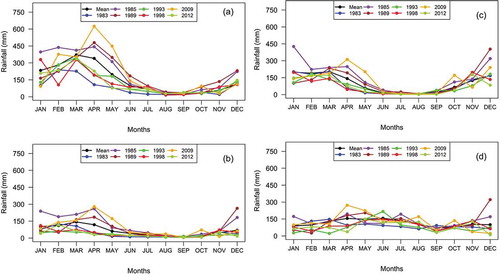
This situation was also verified in the Amazon and Cerrado biomes with a gain of 761.2 mm year−1 (41.2% above the climatological mean) and 712.6 mm year−1 (59.6% above the climatological mean). In the case of the Atlantic Forest this gain was modest, only 219.5 mm year−1 (16.1% above the climatological mean). These rainfalls above the climatological mean occurred in 1985 as a result of a La Niña categorized as weak according to the ONI index combined with positive TAV in the southern Atlantic. Both factors resulted in high NEB rainfall, with flooding records in several locations, mainly in the capitals of Piauí and Maranhão (Andrade et al., Citation2018; Chaves, Tavares, & de Andrade, Citation2017; De Oliveira, Guedes, & da Silva Costa, Citation2017; Pereira, Soares, Silva, de Assunção Montenegro, & de Souza, Citation2017).
In 1983, 1993 and 1998 years there was an annual loss of rainfall according to the El Niño episodes which in turn resulted in various impacts on biomes and various economic sectors (Confalonieri, Citation2015; Marengo et al., Citation2018, Citation2016b; Rao et al., Citation1995). Especially in 1983, where there was a significant reduction in total rainfall () with a loss of 816.9 mm year−1 for the Amazon biome, with an annual mean of 1037 mm.year−1. The largest percentage reduction was observed in Caatinga in 1993, with 49.5% below the climatological mean (Rao et al., Citation1995).
Table 5. Climatological mean and annual accumulated in mm/year (percentages in %) of the years 1983, 1985, 1989, 1993, 1998, 2009 and 2012, for the Amazon, Caatinga, Cerrado and Atlantic Forest biomes. EN and LN correspond to El Niño and La Niña, respectively.
However, among the episodes with the highest annual rainfall, the largest was in 2012, considered atypical because it is La Niña year. This episode of La Niña was extremely severe, especially for Caatinga, where there was a loss of 359.9 mm year−1, a 46.5% reduction in annual rainfall. This effect resulted in a huge $ 6 billion loss in the agricultural sector, and 997 of the 1794 NEB municipalities declared a state of emergency due to drought severity (Marengo et al., Citation2018).
3.5. Spatial distribution of rainfall in NEB biomes
Spatial distribution of rainfall on the dry and rainy period in the NEB biomes followed by the driest and wettest year of each biome in the period 1979–2013 were evaluated as shown in –. In common, all biomes presented the year as the wettest year, the driest year for the Amazon biome () was 1983, for the Caatinga () and the Atlantic Forest () was 1993, and for the Cerrado () was the year 2012. It is noteworthy that the biomes are strongly influenced by the rain-producing systems, previously evaluated. Moreover, there were marked differences in the drier years.
Figure 5. Spatial distribution of the dry (upper) and rainy (lower) periods for the climatological mean (a and b), the year 1985 (wetter) (c and d), and the year 1993 (drier) (e and f) for the Amazon biome.
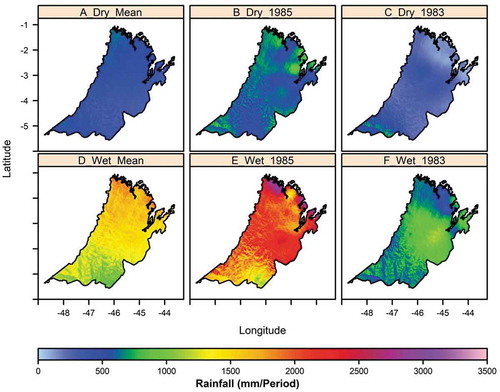
Figure 6. Spatial distribution of the dry (upper) and rainy (lower) periods for the climatological mean (a and b), the year 1985 (wetter) (c and d), and the year 2012 (drier) (e and f) for the Caatinga biome.
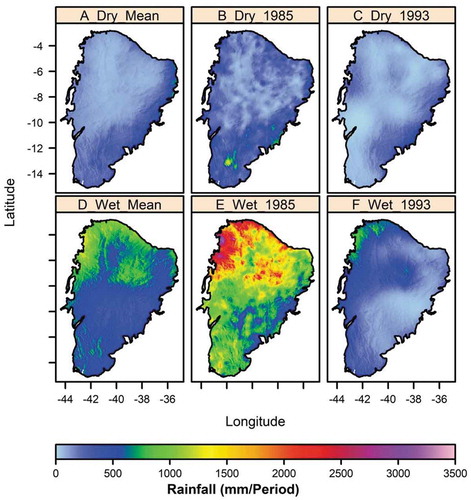
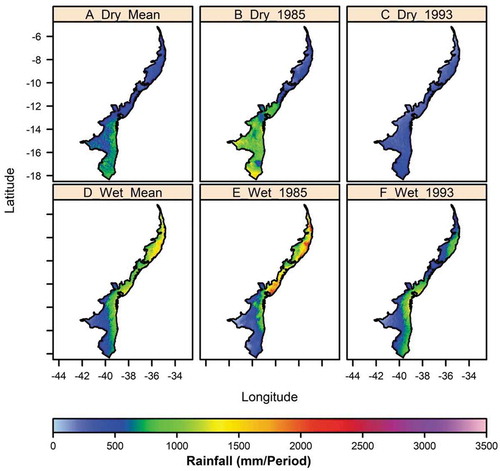
Figure 7. Spatial distribution of the dry (upper) and rainy (lower) periods for the climatological mean (a and b), the year 1985 (wetter) (c and d), and the year 1998 (drier) (e and f) for the Cerrado biome.
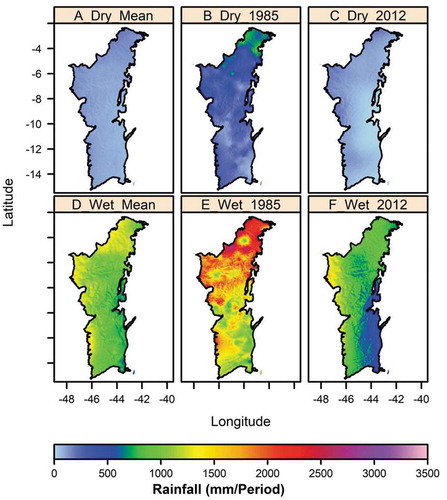
Figure 8. Spatial distribution of the dry (upper) and rainy (lower) periods for the climatological mean (a and b), the year 1985 (wetter) (c and d), and the year 1993 (drier) (e and f) for the Atlantic Forest biome.
In the Amazon Biome, it is found that rainfall decreases significantly in the south portion, especially in the dry season. Regarding spatial climatology, the dry period ()) presented a well-defined homogeneous rainfall along the biome, ranging from 500 to 775 mm, while in the rainy season ()), the largest accumulations occur in the northern portion, with values between 1000 and 2040 mm. This spatial variability is due to the performance of the ITCZ and squall lines (Alves et al., Citation2017; Araújo et al., Citation2009; Reboita & Santos, Citation2015; Silva et al., Citation2017). When analyzing the wettest year (,e)) and the driest year (,d)), again prevails the pattern defined by climatology, but with varying and distinct intensities, for example, in the wettest (dry) year, the northern portion was above the climatological mean with a maximum of 1193 mm (rainfall below the climatological mean between 112 and 521 mm) in the rainy season.
The Caatinga biome showed a rainy pattern ()) similar to the Amazon biome with distinct intensities, where the largest accumulated occurred in the coastal range located in the northern portion, with values between 800 and 1487 mm. While in the dry season ()), the eastern portion is influenced by EWD/TWD with values greater than 700 mm, while most of the biome values do not exceed 300 mm. When the wettest year (,e)) and the dry year (,f)) are evaluated, respectively, the difference is quite distinct between them and the climatology. During the wettest year, the Araripe Plateau region recorded twice the climatological mean for the rainy season ()) with values higher than 2500 mm, and in the northwest with a maximum of 3420 mm. In the driest year ()), the maximum occurred in the extreme northwest and north portions of the biome with maximum values reaching 1000 mm, while in much of the region, the values were below 350 mm and aggravated during the dry period with values below 200 mm. Such rainfall variability had a negative impact on the region, with significant agricultural and economic losses (Marengo et al., Citation2018, Citation2016b).
Regarding the Cerrado biome (), the differences in the climatic pattern between the dry ()) and rainy ()) periods are related to intensity and influence area. In the dry season ()), the rainfall is concentrated on the northern end of the biome with values between 45 and 200 mm, while in the rainy period ()) was well distributed with its maximum in the western portion of the biome, ranging from 1000 to 1757 mm. In relation to the wettest year (,e)), some regions in this biome double the rainfall rates in the rainy season, especially in the north with values exceeding 2500 mm and a maximum of 3210 mm, and decreasing towards the south, with a minimum of 590 mm. In the driest year, in relation to the dry season ()) did not reach the value of 400 mm while the rainy season ()) did not exceed 1540 mm.
The Atlantic Forest biome () showed a very distinct pattern between the dry and rainy periods (,d)) with values between 141 and 1893 mm and 185 and 993 mm, respectively. These patterns are influenced by the influence of EWD/TWD and frontal systems, respectively (Alves et al., Citation2001; Gomes et al., Citation2019; Kouadio et al., Citation2012; Lyra et al., Citation2014). As for the wettest (,e)) and driest (,f)) years, the variations in the rainfall indices were significant, being more intense in the wettest year, especially in the coastal region, during the rainy season ()) with values between 1350 and 2430 mm. While in the dry season ()), the rainfall was concentrated on the extreme south portion, due to the frontal systems (Kousky, Citation1979) which in turn ranged from 400 to 974 mm.
4. Conclusions
Rainfall dynamics in the NEB via CHELSA product shows that the rainy season in the biomes occurs between January and April, with varying intensities, except for the Atlantic Forest where this occurs between April and August. Rainfall seasonality in NEB biomes is associated with spatiotemporal variability of meteorological rain-producing systems, for example, the ITCZ (all Biomes), UTCV (Amazon, Caatinga and Cerrado), Frontal Systems (far south of Caatinga, Cerrado and Atlantic Forest) and EWD/TWD in (Atlantic Forest). Regarding the inter-annual rainfall variability in the NEB biomes, the influence of the ENSO climate variability mode is clearly shown, being found mainly in specific years of the time series, such as 1983, 1985, 1989, 1993, 1998, 2009 and 2012. In relation to the years mentioned above, we highlight 1985 (the wettest of the time series), with a surplus in all evaluated biomes. The driest year stands out in the time series among the biomes, for example, on Amazon in 1983, Caatinga and Atlantic Forest in 1993, and Cerrado in 2012.
On the spatial scale, rainfall in each biome varies significantly as a function of the positioning and action of rainfall producing weather systems, followed by ENSO phases. The study via CHELSA product in NEB brings a discussion about rainfall dynamics in the existing NEB biomes. However, if constant changes in biomes by land use and occupation, forest fires and burns, desertification process and prolonged droughts continue along with natural variability, forms of rain interception in biomes will impact rainfall patterns and water recycling in NEB.
Acknowledgments
The authors thank the University of Zurich for hosting CHELSA data and NOAA available through ONI. All authors are grateful for the CNPq-funded Project, Public Notice No. 016/2018, under No. 424605/2018-0. The first, ninth and eleventh authors thank the National Council for Research and Development (CNPq) for granting the DTI-C scholarship within the Universal Project nº 424605/2018-0. The fourth and sixth authors thank the Higher Education Personnel Improvement Coordination (CAPES) for granting the Doctoral and Postdoctoral fellowship, respectively. The seventh author thanks the CNPq Research Productivity Scholarship Level 2 with process number 304936/2015-4.
Disclosure statement
No potential conflict of interest was reported by the authors.
Additional information
Funding
References
- Agostinho, A. A., Thomaz, S. M., & Gomes, L. C. (2005). Conservation of the biodiversity of Brazil’s inland waters. Conservation Biology, 19(3), 646–652.
- Aleixo, A., Albernaz, A. L. M. K., Grelle, C. E. V., Vale, M. M., & Rangel, T. F. (2010). Mudanças Climáticas e a Biodiversidade dos Biomas Brasileiros: Passado, Presente e Futuro. Natureza & Conservação, 8(2), 194–196.
- Alves, J. M. B., Silva, E. M. D., Sombra, S. S., Barbosa, A. C. B., Santos, A. C. S. D., & Lira, M. A. T. (2017). Eventos Extremos Diários de Chuva no Nordeste do Brasil e Características Atmosféricas. Revista Brasileira De Meteorologia, 32(2), 227–233.
- Alves, J. M. B., Teixeira, R. F. B., & Ferreira, A. G. (2001). Um intenso Sistema Convectivo de Mesoescala no setor leste da Região Nordeste: O caso de 20 a 21 de maio de 1999. Revista Brasileira De Meteorologia, 16(1), 19–31.
- Andrade, A. R. S., Neto, A. H. G., da Silva Cruz, A. F., de Andrade, E. K. P., Dos Santos, V. F., & da Silva, T. N. P. (2018). Geoestatística aplicada à variabilidade espacial e padrões nas séries temporais da precipitação no agreste pernambucano. Journal of Environmental Analysis and Progress, 3(1), 126–145.
- Araújo, R. G., Andreoli, R. V., Cândido, L. A., Kayano, M. T., & Souza, R. A. F. (2009). A influência do evento El Niño - Oscilação Sul e Atlântico Equatorial na precipitação sobre as regiões norte e nordeste da América do Sul. Acta Amazonica, 43(4), 469–480.
- Barbosa, H. A., Kumar, T. L., Paredes, F., Elliott, S., & Ayuga, J. G. (2019). Assessment of Caatinga response to drought using Meteosat-SEVIRI Normalized Difference Vegetation Index (2008–2016). ISPRS Journal of Photogrammetry and Remote Sensing, 148, 235–252.
- Barros Santiago, D., Correia Filho, W. L. F., de Oliveira-júnior, J. F., & da Silva Junior, C. A. (2019). Mathematical modeling and use of orbital products in the environmental degradation of the Araripe Forest in the Brazilian Northeast. Modeling Earth Systems and Environment. doi:10.1007/s40808-019-00614-x
- Bezerra, D. D. S. B., Dias, B. C. C., Rodrigues, L. H. D. S., Tomaz, R. B., Dos Santos, A. L. S., & Junior, C. H. L. S. (2018). Análise dos Focos de Queimadas e seus impactos no Maranhão durante eventos de estiagem no período de 1988 à 2016. Revista Brasileira De Climatologia, 22, 446–462.
- Bivand, R., Tim Keitt, T., & Rowlingson, B. (2019). rgdal: Bindings for the ‘Geospatial’ Data Abstraction Library. R package version1.4-4. Retrieved from https://CRAN.R-project.org/package=rgdal
- Brasil. (2000). Lei nº 9.985, de 18 de julho de 2000. Institui o Sistema Nacional de Unidades de Conservação da Natureza e dá outras providências. Retrieved from http://www.planalto.gov.br/ccivil_03/leis/l9985.htm
- Carrão, H., Russo, S., Sepulcre-Canto, G., & Barbosa, P. (2016). An empirical standardized soil moisture index for agricultural drought assessment from remotely sensed data. International Journal of Applied Earth Observation and Geoinformation, 48, 74–84.
- Caúla, R. H., Oliveira-Júnior, J. F., Lyra, G. B., Delgado, R. C., & Heilbron Filho, P. F. L. (2015). Overview of fire foci causes and locations in Brazil based on meteorological satellite data from 1998 to 2011. Environmental Earth Sciences (Print), 74(2), 1497–1508.
- Chaves, S. C. V. V., Tavares, A. C., & de Andrade, C. S. P. (2017). Vulnerabilidade ás inundações em Teresina, Piauí e ações mitigadoras do Poder público. Sociedade E Território, 29(2), 175–197.
- Clemente, S. S., Oliveira Júnior, J. F., & Louzada, M. A. P. (2017). Focos de Calor na Mata Atlântica do Estado do Rio de Janeiro. Revista Brasileira De Meteorologia, 32(4), 669–677.
- Confalonieri, U. E. (2015). Variabilidade climática, vulnerabilidade social e saúde no Brasil. Terra Livre, 1(20), 193–204.
- Correia Filho, W. L. F., de Barros Santiago, D., de Oliveira-júnior, J. F., & da Silva Junior, C. A. (2019). Impact of urban decadal advance on land use and land cover and surface temperature in the city of Maceió, Brazil. Land Use Policy, 87, 104026.
- Correia Filho, W. L. F., Dos Santos, T. V., Diogo, A. M., & de Amorim, R. F. C. (2018). Diagnóstico da Precipitação e EVI em Dois Eventos de Seca no Nordeste do Brasil. Revista Do Departamento De Geografia, 35, 102–112.
- Correia Filho, W. L. F., Lucio, P. S., & Spyrides, M. H. C. (2016). Caracterização dos extremos de precipitação diária no nordeste do brasil. Boletim Goiano De Geografia, 36(3), 539–554.
- Correia, M. D. F., Aragão, M. R. D. S., Penaforte, A. G., & de Medeiros, R. L. B. (2019). Características de Dutos Atmosféricos de Superfície no Semiárido Brasileiro. Anuário Do Instituto De Geociências, 41(3), 375–381.
- Costa, M. S., Lima, K. C., Gonçalves, W. A., & Mattos, E. V. (2019). Sistemas Convectivos de Mesosescala Associados a Eventos Extremos de Precipitação Sobre o Semiárido do Nordeste do Brasil. Anuário Do Instituto De Geociências, 42, 317–328.
- Coutinho, L. M. (2006). O conceito de bioma. Acta Botanica Brasilica, 20(1), 13–23.
- De Oliveira, A. M., Guedes, J. C. F., & da Silva Costa, D. F. (2017). Usos e ocupações da terra na planície de inundação do baixo curso do rio Piancó-Piranhas-Açu (RN). Os Desafios Da Geografia Física Na Fronteira Do Conhecimento, 1, 3917–3927.
- De Oliveira Souza, T. C., Delgado, R. C., Magistrali, I. C., Dos Santos, G. L., de Carvalho, D. C., Teodoro, P. E., … Caúla, R. H. (2018). Spectral trend of vegetation with rainfall in events of El Niño-Southern Oscillation for Atlantic Forest biome, Brazil. Environmental Monitoring and Assessment, 190(11), 688.
- Fearnside, P. M. (2009). A vulnerabilidade da floresta amazônica perante as mudanças climáticas. Oecologia Brasiliensis, 13(4), 609–618.
- Fedorova, N., Dos Santos, D. M. B., Segundo, M. M. L., & Levit, V. (2017). Middle tropospheric cyclonic vortex in Northeastern Brazil and the Tropical Atlantic. Pure and Applied Geophysics, 174(1), 397–411.
- Filgueira, H. J. A., Neto, A. F. S., & Barbosa, M. P. (2007). Impacto dos eventos ENOS (El Niño-Oscilação Sul) nas precipitações pluviométricas, nos recursos hídricos superficiais e na degradação do solo em região do semi-árido brasileiro. Anais XIII Simpósio Brasileiro De Sensoriamento Remoto. Florianópolis-Santa Catarina, 13(1), 3893–3898.
- Fisch, G., Marengo, J. A., & Nobre, C. A. (1998). Uma revisão geral sobre o clima da Amazônia. Acta Amazônica, 28(2), 101–126.
- Gomes, H. B., Ambrizzi, T., da Silva, B. F. P., Hodges, K., Dias, P. L. S., Herdies, D. L., … Gomes, H. B. (2019). Climatology of easterly wave disturbances over the tropical South Atlantic. Climate Dynamics, 1–19. doi:10.1007/s00382-019-04667-7
- Hijmans, R. J. (2017). raster: Geographic data analysis and modeling. R package version 2.6-7. Retrieved from https://CRAN.R-project.org/package=raster
- Holdridge, I. R. (1947). Determination of world plant formations from simple climatic data. Science, 105, 367–368.
- Hounsou-gbo, G. A., Araujo, M., Bourlès, B., Veleda, D., & Servain, J. (2015). Tropical Atlantic contributions to strong rainfall variability along the Northeast Brazilian Coast. Advances in Meteorology, (2015, 902084.
- Huang, B., Banzon, V. F., Freeman, E., Lawrimore, J., Liu, W., Peterson, T. C., … Zhang, H. M. (2015). Extended reconstructed sea surface temperature version 4 (ERSST v4). Part I: Upgrades and intercomparisons. Journal of Climate, 28(3), 911–930.
- IBGE – Instituto Brasileiro de Geografia e Estatística. Censo (2002). Retrieved from http://www.ibge.gov.br
- IBGE – Instituto Brasileiro de Geografia e Estatística. Censo (2019, August 2). Retrieved from http://www.ibge.gov.br
- Karger, D. N., Conrad, O., Böhner, J., Kawohl, T., Kreft, H., Soria-Auza, R. W., … Kessler, M. (2017). Climatologies at high resolution for the earth’s land surface areas. Scientific Data, 4, 170122.
- Kayano, M. T., Andreoli, R. V., & Souza, R. A. F. (2013). Relations between ENSO and the South Atlantic SST modes and their effects on the South American rainfall. International Journal of Climatology, 33(8), 2008–2023.
- Kouadio, Y. K., Servain, J., Machado, L. A., & Lentini, C. A. (2012). Heavy rainfall episodes in the eastern northeast brazil linked to large-scale ocean-atmosphere conditions in the tropical atlantic. Advances in Meteorology, 2012, 1–16.
- Kousky, V. E. (1979). Frontal influences on northeast Brazil. Monthly Weather Review, 107(9), 1140–1153.
- Kousky, V. E., & Alonso Gan, M. (1981). Upper tropospheric cyclonic vortices in the tropical South Atlantic. Tellus, 33(6), 538–551.
- Kucharski, F., Polzin, D., & Hastenrath, S. (2008). Teleconnection mechanisms of northeast Brazil droughts: Modeling and empirical evidence. Revista Brasileira De Meteorologia, 23(2), 115–125.
- Lewinsohn, T. M., & Prado, P. I. (2002). Biodiversity of Brazil: A synthesis of the current state of knowledge. In T. M. Lewinsohnand & P. I. Prado (Eds.), Biodiversidade brasileira: Síntese do estado do conhecimento atual (pp. 139–144). São Paulo: Contexto Academica.
- Lyra, G. B., Oliveira-Júnior, J. F., Gois, G., Cunha-Zeri, G., & Zeri, M. (2017). Rainfall variability over Alagoas under the influences of SST anomalies. Meteorology and Atmospheric Physics (Print), 129(2), 157–171.
- Lyra, G. B., Oliveira-Júnior, J. F., & Zeri, M. (2014). Cluster analysis applied to the spatial and temporal variability of monthly rainfall in Alagoas state, Northeast of Brazil. International Journal of Climatology, 34(13), 3546–3558.
- Marengo, J. A., Alves, L. M., Alvalá, R. C. S., Cunha, A. P., Brito, S., & Moraes, O. L. L. (2018). Climatic characteristics of the 2010–2016 drought in the semiarid Northeast Brazil region. Anais Da Academia Brasileira De Ciências, 90, 1973–1985.
- Marengo, J. A., & Bernasconi, M. (2015). Regional differences in aridity/drought conditions over Northeast Brazil: Present state and future projections. Climate Change, 129, 103–115.
- Marengo, J. A., & Hastenrath, S. (1993). Case studies of extreme climatic events in the Amazon basin. Journal of Climate, 6, 617–627.
- Marengo, J. A., Torres, R. R., & Alves, L. M. (2016b). Drought in Northeast Brazil - past, present, and future. Theoretical and Applied Climatology, 129, 1189–1200.
- Marengo, J. A., Williams, E. R., Alves, L. M., Soares, W. R., & Rodriguez, D. A. (2016a). Extreme seasonal climate variations in the Amazon Basin: Droughts and floods. In L. Nagy, B. Forsberg, & P. Artaxo (Eds.), Interactions between biosphere, atmosphere and human land use in the Amazon Basin. Ecological Studies (Analysis and Synthesis) (Vol. 227.). Berlin, Heidelberg: Springer. doi:10.1007/978-3-662-49902-3_4
- Mariano, D. A., Dos Santos, C. A., Wardlow, B. D., Anderson, M. C., Schiltmeyer, A. V., Tadesse, T., & Svoboda, M. D. (2018). Use of remote sensing indicators to assess effects of drought and human-induced land degradation on ecosystem health in Northeastern Brazil. Remote Sensing of Environment, 213, 129–143.
- Martins, M. B., & De Oliveira, T. G. (Eds.). (2011). Amazônia maranhense: Diversidade e conservação (pp. 328). Belém: Museu Paraense Emílio Goeldi.
- Mataveli, G. A. V., Silva, M. E. S., Pereira, G., Kawakubo, F. S., Bertani, G., & Oliveira, B. S. (2017). Análise das queimadas e da precipitação em áreas de Cerrado do Maranhão a partir de dados do sensor MODIS e do satélite TRMM para o período 2002–2015. Boletim Paulista De Geografia, 96, 11–30.
- McIlroy, D. (2018). Packaged for R by Ray Brownrigg, Thomas P Minka and transition to Plan9 codebase by Roger Bivand. (2018). mapproj: MapProjections. R package version 1.2.6. Retrieved from https://CRAN.R-project.org/package=mapproj
- MMA - Ministério do Meio Ambiente (2019, August 2). Retrieved from https://www.mma.gov.br/biomas.html
- Molion, L. C. B., & Bernardo, S. O. (2002). Uma revisão da Dinâmica das Chuvas no Nordeste Brasileiro. Revista Brasileira De Meteorologia, 17, 1–10.
- Monerie, P. A., Robson, J., Dong, B., Hodson, D. L., & Klingaman, N. P. (2019). Effect of the Atlantic multidecadal variability on the global monsoon. Geophysical Research Letters, 46(3), 1765–1775.
- Nascimento, D. T. F., De Araújo, F. M., & Ferreira Júnior, L. G. (2011). Análise dos padrões de distribuição espacial e temporal dos Focos de Calor nos Bioma Cerrado. Revista Brasileira De Cartografia, 63(4), 461–475.
- Panisset, J. S., Libonati, R., Gouveia, C. M. P., Machado-Silva, F., França, D. A., França, J. R. A., & Peres, L. F. (2018). Contrasting patterns of the extreme drought episodes of 2005, 2010 and 2015 in the Amazon Basin. International Journal of Climatology, 38(2), 1096–1104.
- Pereira, M. L. T., Soares, M. P. A., Silva, E. A., de Assunção Montenegro, A. A., & de Souza, W. M. (2017). Variabilidade climática no Agreste de Pernambuco e os desastres decorrentes dos extremos climáticos. Journal of Environmental Analysis and Progress, 2(4), 394–402.
- Pereira, M. P. S., Justino, F., Malhado, A. C. M., Barbosa, H., & Marengo, J. (2014). The influence of oceanic basins on drought and ecosystem dynamics in Northeast Brazil. Environmental Research Letters, 9(12), 124013.
- R Development Core Team R: A language and environment for statistical computing version 3.4-1 (2017). R Foundation for Statistical Computing. Vienna, Austria. ISBN 3-900051-07-0. Retrieved from http://www.r-project.org
- Rao, V. B., Hada, K., & Herdies, D. (1995). On the severe drought of 1993 in north-east Brazil. International Journal of Climatology, 15(6), 697–704.
- Reboita, M. S., Rodrigues, M., Armando, R., Freitas, C., Martins, D., & Miller, G. (2016). Causas da Semi-Aridez do Sertão Nordestino. Revista Brasileira De Climatologia, 19, 254–277.
- Reboita, M. S., & Santos, I. (2015). Influência de alguns padrões de teleconexão na precipitação no norte e nordeste do Brasil. Revista Brasileira De Climatologia, 15, 28–48.
- Rodrigues, R. R., Haarsma, R. J., Campos, E. D. J., & Ambrizzi, T. (2011). The impacts of inter–El Niño variability on the tropical Atlantic and Northeast Brazil Climate. Journal of Climate, 24, 3402–3422.
- Rodrigues, R. R., & McPhaden, M. J. (2014). Why did the 2011–2012 La Niña cause a severe drought in the Brazilian Northeast? Geophysical Research Letters, 41(3), 1012–1018.
- Roesch, L. F. W., Vieira, F. C. B., Pereira, V. A., Schünemann, A. L., Teixeira, I. F., Senna, A. J. T., & Stefenon, V. M. (2009). The Brazilian Pampa: A Fragile Biome. Diversity, 2009(1), 182–198.
- Salati, E., Dall’Olio, A., Matsui, E., & Gat, J. R. (1979). Recycling of water in the Amazon Basin: An isotopic study. Water Resources Research, 15(5), 1250–1258.
- Salazar, L. F., Nobre, C. A., & Oyama, M. D. (2007). Climate change consequences on the biome distribution in tropical South America. Geophysical Research Letters, 34(9). doi:10.1029/2007GL029695
- Sales, L. L. N., da Silva, D. D. S., Lima, E. V., Fonseca, G. T. C., Almeida, G. S., & Botelho, J. (2019). 10 Municípios Maranhenses mais atingidos por Focos de Queimadas nos anos de 2014 e 2015. Revista De Geografia (Recife), 36(1), 59–74.
- Sano, E. E., Rosa, R., Brito, J. L. S., & Ferreira, L. G. (2010). Land cover mapping of the tropical savanna region in Brazil. Environmental Monitoring and Assessment, 166, 113–124.
- Santos, V. A. H. F. D., Ferreira, M. J., Rodrigues, J. V. F. C., Garcia, M. N., Ceron, J. V. B., Nelson, B. W., & Saleska, S. R. (2018). Causes of reduced leaf-level photosynthesis during strong El Niño drought in a Central Amazon forest. Global Change Biology, 24(9), 4266–4279.
- Scarano, F. R., & Ceotto, P. (2015). Brazilian Atlantic forest: Impact, vulnerability, and adaptation to climate change. Biodiversity and Conservation, 24(9), 2319–2331.
- Silva, C. B., & De Oliveira, L. F. C. (2017). Relação intensidade-duração-frequência de chuvas extremas na região nordeste do Brasil. Revista Brasileira De Climatologia, 20, 267–283.
- Silva, M. T., Alcântara, C. R., Souza, E. P. D., Olinda, R. A. D., & Gonçalves, W. A. (2017). Influência da Temperatura da Superfície do Mar na Ocorrência de Linhas de Instabilidade na Costa Norte e Nordeste do Brasil. Revista Brasileira De Meteorologia, 32(2), 260–268.
- Souza, P., & Cavalcanti, I. F. A. (2009). Atmospheric centres of action associated with the Atlantic ITCZ position. International Journal of Climatology, 29(14), 2091–2105.
- Tabarelli, M., Melo, M. D. V. C., & Lira, O. C. (2006). A Mata Atlântica do nordeste. Mata Atlântica Uma Rede Pela Floresta. Brasília, Rede De Ongs Da Mata Atlântica, 149–164. Retrieved from http://www.academia.edu/download/31826375/mata_atlantica_nordeste.pdf
- Tomaziello, A. C. N., Carvalho, L. M. V., & Gandu, A. W. (2016). Intraseasonal variability of the Atlantic Intertropical Convergence Zone during austral summer and winter. Climate Dynamics, 47(5–6), 1717–1733.
- Wilks, D. S. (1995). Statistical methods in the atmospheric sciences: An introduction (Vol. 59, pp. 467). San Diego: Academic Press.
- Xie, S.-P., & Carton, J. A. (2004). Tropical Atlantic variability: Patterns, mechanisms, and impacts. Earth Climate: The Ocean-Atmosphere Interaction, Geophysical Monograph, 147, 121–142.
- Xu, D., Agee, E., Wang, J., & Ivanov, V. Y. (2019). Estimation of evapotranspiration of Amazon rainforest using the maximum entropy production method. Geophysical Research Letters, 46(3), 1402–1412.