
 ?Mathematical formulae have been encoded as MathML and are displayed in this HTML version using MathJax in order to improve their display. Uncheck the box to turn MathJax off. This feature requires Javascript. Click on a formula to zoom.
ABSTRACT
For the area of Eurasia concentrated with developing countries (referred to here by the abbreviation DPEA), mainly located in Asia and Eastern Europe, this work presents datasets of gridded meteorological drought events and country-based drought risk by combining multiple drought indices and socio-economic data. A basic gridded dataset of the drought events during 1950–2015 is extracted from three drought indices: the self-calibrating Palmer Drought Severity Index, the Standardized Precipitation Index, and the Standardized Precipitation Evapotranspiration Index. The three drought indices generally show consistent characteristics of drought events in DPEA. A second-level dataset (a drought risk dataset) is then produced as the product of drought hazard, exposure and vulnerability during 2000–2015. For drought exposure, the indicators of population and livestock density, agricultural land and water stress are chosen, while drought vulnerability composites multiple social, economic and infrastructural factors. Drought hazard tends to concentrate at the southern rim of Eurasia. Relatively large differences in drought exposure exist between different countries, but for drought vulnerability the differences are small. After considering the socio-economic components in risk assessment, most countries in West, South-Central and South Asia have the highest drought risk in DPEA. The datasets of drought events and risks are available at http://www.dx.doi.org/10.11922/sciencedb.898.
1. Introduction
Drought is a recurring natural hazard, mainly due to the lack of precipitation over a region during an extended period. It is also one of the most costly natural disasters, especially when intense and prolonged drought events are involved (e.g. Barriopedro, Gouveia, Trigo, & Wang, Citation2012). Recent studies have focused on changes in the area, frequency, intensity, and duration of drought events in nature (e.g. Andreadis & Lettenmaier, Citation2006; Guo et al., Citation2018; Sheffield, Andreadis, Wood, & Lettenmaier, Citation2009; Spinoni, Naumann, Carrao, Barbosa, & Vogt, Citation2014). Drought has exerted significant and widespread societal and environmental influences, and increasingly serves as an indicator of growing societal vulnerability (Hayes, Wilhelmi, & Knutson, Citation2004; Neri & Magaña, Citation2016; Shahid & Behrawan, Citation2008). Therefore, in addition to the physical aspects, drought is also defined or determined by its negative impacts on socio-economic and environmental systems (Blauhut et al., Citation2016). Drought-associated risk assessment, combined with comprehensive drought climatological data, will be beneficial towards improving our understanding and decision-making with respect to water management, environmental protection and sustainable socio-economic development for a region or country, especially developing countries. It is well known that the exposure and vulnerability of a society to drought highly depends on the geographical features of the region’s topography, climate, economy, and population density. There are many densely populated, developing countries concentrated in Asia, Eastern Europe and Africa (Guzmán, Martine, McGranahan, Schensul, & Tacoli, Citation2009), and history has taught us that these countries are the most likely to be affected by drought. Therefore, in this paper, we present an analysis of the drought characteristics and an assessment of the associated vulnerability and risk in the area of Eurasia concentrated with developing countries (hereafter referred to by the abbreviation DPEA), which mainly includes Eastern Europe, Asia, and the country of Egypt. Technically, Russia and some countries in Eastern Europe are not classified as developing countries; however, given that their levels of economic and social development are less than in other developed countries, such as those in Western Europe, we include them in our developing area (i.e. DPEA) in this study.
Drought can occur everywhere, both in dry and humid regions. Since the 1950s, an increasing trend of drought has been reported over many land areas, which is attributable to decreased precipitation and increased evaporation driven by global warming (Dai, Citation2012; Spinoni et al., Citation2014). However, some studies have revealed that the occurrence of increasing global drought is disputable or overestimated (e.g. Sheffield, Wood, & Roderick, Citation2012). DPEA covers most of the landmass of Eurasia, including East Asia, North Asia, Central Asia, West Asia, South Asia, Southeast Asia, the Middle East, and Eastern Europe (). In the context of the complex characteristics of climate and climatic change over Eurasia, drought varies widely among the sub-regions of DPEA. As a typical interior area in Asia, Central Asia has complicated drought characteristics in response to the ongoing global warming. Previous research has revealed a weak wetting trend indicated by the Palmer Drought Severity Index (PDSI), reflecting the dramatic warming but slight change in precipitation (Li, Chen, Fang, & Li, Citation2017). As a part of the arid Central Asia, Northwest China has shifted to wetter conditions since the mid-1980s (Shi et al., Citation2007). Based on changes in precipitation and evaporation, there has been a significant increase in the frequency and severity of drought since the late 1990s in North China (Chen & Sun, Citation2015). In South Asia, previous studies suggest that India now has an increased risk of drought, caused by global warming (e.g. Mishra & Liu, Citation2014). The Middle East and Southwest Asia are also highly water-stressed regions and prone to severe droughts for which the roles of temperature and evaporation are important (Barlow et al., Citation2016). For Europe, enhanced droughts in southern Europe, particularly the Mediterranean area (Spinoni, Naumann, & Vogt, Citation2017; Spinoni, Naumann, Vogt, & Barbosa, Citation2015), induced by increases in temperature and evaporation, are in contrast to increased precipitation and decreased drought frequency in northern Europe. Such regional disagreements or differences in terms of whether drought is increasing or decreasing not only rely on the different responses to temperature and precipitation fluctuations, e.g. drought exhibits a larger response to temperature variations in northern China whereas there are larger responses to precipitation anomalies in southern China (Chen & Sun, Citation2015), but also depend on the discrepancies among different drought indices and the method of calculation for drought indices (Sheffield et al., Citation2012; Stagge, Kingston, Tallaksen, & Hannah, Citation2017).
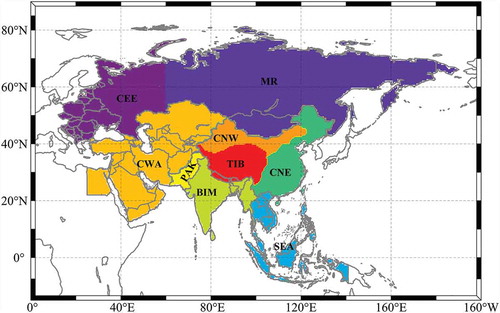
Figure 1. Map of the nine sub-regions of DPEA.
Thus, considering the complexity of drought variability and its impact on environmental and socio-economic sectors in DPEA, it is vital to choose scientific techniques to analyze and monitor drought. Drought is generally classified into four types – meteorological, agricultural, hydrological, and socio-economic (Wilhite & Glantz, Citation1985) – and many quantitative indices have been developed and applied in drought detection and monitoring (Dai, Citation2011; Mishra & Singh, Citation2010). Among these indices, several meteorological drought indices have been widely used (Kingston, Stagge, Tallaksen, & Hannah, Citation2015), including the PDSI, the Standardized Precipitation Index (SPI), and the Standardized Precipitation Evapotranspiration Index (SPEI) (McKee, Doesken, & Kleist, Citation1993; Palmer, Citation1965; Vicente-Serrano, Beguería, & López-Moreno, Citation2010a). All three of these indices are standardized measures of relative local climatology and are comparable across different climate zones. Thereinto, PDSI is based on a soil water balance equation involving local soil characteristics and historical records of precipitation and potential evapotranspiration (PET). PDSI and SPIs/SPEIs are approximately equivalent at a time scale between 9 and 12 months, although there is not a fixed time scale defined in the original PDSI method (Chen & Sun, Citation2015; Lloyd-Hughes & Saunders, Citation2002; van der Schrier, Barichivich, Briffa, & Jones, Citation2013). SPI and SPEI are relatively simply constructed and can be calculated at multiple temporal resolutions (Vicente-Serrano et al., Citation2010a), where the former is based on precipitation only but the latter includes both precipitation and PET. This study uses these three indices to obtain a basic dataset of DPEA drought events, which can then be employed to extract robust characteristics of the drought in this region.
The goal of this work is to construct a dataset for assessing the risk of drought for DPEA. To achieve this objective, the frequency, severity and spatial extent of drought occurrence are essential characteristics, as well as the analysis of hazard and vulnerability (Hayes et al., Citation2004). Similar to heatwave risk assessment over a specific region or the entire globe, drought hazard can be described as the probability of drought occurrence. Meanwhile, drought vulnerability represents the level or characteristics of a system or social group susceptible to drought hazard (Hayes et al., Citation2004; Naumann, Barbosa, Garrote, Iglesias, & Vogt, Citation2014; Russo et al., Citation2019). It is hard but necessary to select valid proxies or indicators to elucidate the vulnerability to drought stress. Considering the relatively low level of economic development across most countries in DPEA, we recognized that the infrastructural and socio-economic sectors might be affected the most by drought events in different sub-regions and countries. Therefore, to establish a primary dataset for drought risk over DPEA, the focus here is to quantify the drought hazard and map the drought risk at the national level based on publicly released economic, social and infrastructural data sources.
The paper is organized as follows: Firstly, a systematic hazard analysis of the spatial variation and trends is performed for different drought indices. The characteristics of different severity drought events are also demonstrated in this part. After that, a relative estimate of the exposure and vulnerability to drought is made based on the exposure and vulnerability indicators for DPEA. We further concentrate on the drought risk by combining the drought hazard, exposure, and vulnerability (Carrão, Naumann, & Barbosa, Citation2016). We hope that the establishment of this drought risk assessment over DPEA may be beneficial for sustainable development over this vast but relatively less developed region.
2. Materials and methods
2.1. Study area
displays the study region (i.e. DPEA), which mainly covers Asia, most of Europe, and part of Africa. The classical integrated natural regionalization method (Wu et al., Citation2019), which is an application of the Köppen climate classification (Lutgens & Tarbuck, Citation2007), is used to divide DPEA into nine sub-regions. In this method, water and heat are the core climate factors, whilst simultaneously considering the level of economic development and the characteristics of soil moisture, vegetation, topography and hydrology. The regional division, shown in , is very similar to that firstly defined by Giorgi and Francisco (Citation2000) and then used by Sheffield and Wood (Citation2008). In this work, the regional division represents not only those regions with different climatic regimes and physiographic backgrounds, as is the case in the criteria presented by Giorgi and Francisco (Citation2000), but also the economic, social and cultural differences between different countries. The nine sub-regions (Wu et al., Citation2019) in this study include (): Central and Eastern Europe sub-region with cold and humid climate (CEE), Mongolia and Russia sub-region with cold and arid climate (MR), Central and Western Asia arid sub-region (CWA), Southeastern Asia sub-region with warm and humid climate (SEA), Pakistan arid sub-region (PAK), Bangladesh–India–Myanmar sub-region with warm and humid climate (BIM), Eastern China monsoon sub-region (CNE), Northwestern China arid sub-region (CNW), and the Tibetan Plateau sub-region (TIB).
2.2. Compilation and construction of drought indices
Drought occurrence is directly related to a reduction in precipitation during a specific time period. Under the circumstances of a growing population and expanding agricultural, energy and industrial sectors, drought will induce further stress on society (Mishra & Singh, Citation2010). It is necessary to understand the nature of drought and its social and economic impacts before providing support for further research and policymaking (Huang et al., Citation2017). The development of drought displays varying time scales and spatial characteristics in different parts of the world. Drought indices play essential roles in examining drought characteristics and assessing the effects on society. A compilation of different drought index products and a comprehensive comparative analysis between multiple indices can help us identify and describe the evolution of drought in different sub-regions. Several popular indices have been developed to quantitatively examine the status and changes of different types of drought in the context of meteorology, hydrology, soil moisture, agriculture or vegetation via considering a single variable (only precipitation) or combining precipitation with other meteorological variables (Mishra & Singh, Citation2010).
In this research, we mainly focus on meteorological drought. Three sets of meteorological drought indices are used: self-calibrating PDSI (scPDSI), SPI, and SPEI. Based on these indices, meteorological drought events during 1950–2016 are identified and a gridded dataset is constructed. The spatiotemporal characteristics of each event, including its extent, duration, intensity, severity, and peak, are examined. These drought event data are then applied to assessing the drought risk in different countries or sub-regions within DPEA, which helps us to analyze the biophysical and social vulnerability to drought, and further improve our understanding regarding the most vulnerable people and social sectors to drought in the study region (Hayes et al., Citation2004).
2.2.1. Non-specific-timescale drought index: scPDSI
The original PDSI developed by Palmer (Citation1965) tends to measure the cumulative departure in surface water balance, which incorporates prior precipitation, moisture supply, runoff, and evaporation demand at the surface level (Dai, Citation2011). Although PDSI is a standardized index related to a non-specific and non-fixed temporal scale at the global or continental scale, it is usually between 9 and 12/14 months in most regions of the world (Chen & Sun, Citation2015; Vicente-Serrano, Beguería, López-Moreno, Angulo, & El Kenawy, Citation2010b). It can be viewed as a measure of meteorological or agricultural and even hydrological drought (Andreadis, Clark, Wood, Hamlet, & Lettenmaier, Citation2005; Dai, Trenberth, & Qian, Citation2004). The development of scPDSI by Wells, Goddard, and Hayes (Citation2004) has solved many problems in the original PDSI. The Penman–Monteith method and the actual vegetation cover are applied to calculate the PET, instead of the Thornthwaite method and a reference crop used in the original PDSI (Dai, Citation2011; van der Schrier et al., Citation2013). Moreover, seasonal snowpack dynamics are also implemented in the computation of the water balance model of scPDSI (Osborn, Barichivich, Harris, van der Schrier, & Jones, Citation2016, Citation2017; van der Schrier et al., Citation2013). Despite these advantages, the critical weakness of scPDSI is that the multi-scale characteristics of drought cannot be distinguished because it does not relate to one specific time scale (Vicente-Serrano et al., Citation2010a). However, generally, the correlation of PDSI/scPDSI with SPEI is good at times scales between 9 and 12/14 months, indicating the index is able to represent water deficits at these time scales (Vicente-Serrano et al., Citation2010b).
In this work, the monthly scPDSI from the Climatic Research Unit (CRU, http://www.cru.uea.ac.uk/data) is used. The data cover the period 1901 to 2016 and are driven by a preliminary version of the CRU TS 3.25 monthly climate dataset. Excluding Antarctica, the global land surface scPDSI data are available on a spatial grid of 0.5° 0.5°. Quantitatively, scPDSI is a standardized index ranging from −4 (extremely dry) to +4 (extremely wet). The classification of different degrees of drought is shown in .
Table 1. Classification of dry conditions for scPDSI and SPI/SPEI.
2.2.2. Multi-timescale drought index: SPI
SPI is a popular index characterizing extreme dryness and wetness conditions, and is recommended by the World Meteorological Organization (World Meteorological Organization [WMO], Citation2012). In terms of the precipitation deficits for monthly or longer periods, the precipitation time series can be transformed into a standardized normal distribution based on the corresponding climatological distribution. In general, drought is a multi-scale phenomenon involving the magnitude of accumulated water deficits. Therefore, SPI is suitable for quantifying most types of drought events (Lloyd-Hughes & Saunders, Citation2002). Compared to scPDSI, the advantage of SPI is its simple construction, whereby only precipitation is considered. The varying time scales of SPI is also a helpful feature, for describing drought events at different time scales. However, being based solely on precipitation, the roles of other variables, such as temperature and PET, are ignored in SPI (Stagge et al., Citation2017). Therefore, its capacity to detect drought conditions is potentially weakened when the temperature or atmospheric evaporative demand is higher than normal (Vicente-Serrano, Van der Schrier, Beguería, & Azorin-Molina, Citation2015). In addition, for some regions with low seasonal precipitation (such as arid CWA, shown in ), it is unsuitable for analyzing the dryness/wetness at time scales shorter than around three months because of the occurrence of misleadingly large positive or negative SPI values (Lloyd-Hughes & Saunders, Citation2002; Mishra & Singh, Citation2010).
In this study, SPI is computed by summing the precipitation over accumulation periods of 3, 6, 9 and 12 months (SPI03, SPI06, SPI09, and SPI12, respectively), and the gamma distribution is used to fit the accumulated precipitation for SPI. As input data, the gridded monthly precipitation observations at a spatial resolution of 1° 1° for the period 1901–2016 from the Global Precipitation Climatology Centre V7.0 (GPCC) (Schneider et al., Citation2015) are used. For consistency with the spatial resolution of scPDSI, the SPI data are interpolated onto a spatial grid of 0.5°
0.5°. The original and interpolated SPI datasets were compared during the analyzed period, and no significant differences or consistent biases were found between them (figures not shown).
2.2.3. Multi-scalar drought index: SPEI
For the third drought index, SPEI, its calculation is similar to that of SPI but to describe the anomalies of the difference between precipitation and PET (Vicente-Serrano et al., Citation2010a). In theory, SPEI provides a more comprehensive description of the dry or wet conditions because of the inclusion of PET in its scheme (Kingston et al., Citation2015). Although an extended period of reduced precipitation is the primary factor causing drought, the effect of increased temperature may also initiate or enhance drought via the enhancement of evapotranspiration and the desiccation of soil (Easterling, Wallis, Lawrimore, & Heim, Citation2007). Based on precipitation and PET, SPEI combines some of the advantages of PDSI and SPI, i.e. considering the role of PET mainly caused by temperature whilst maintaining simplicity in its construction.
The global SPEI database used in this study is from the website http://spei.csic.es/index.html (Beguería, Vicente-Serrano, Reig, & Latorre, Citation2014). This monthly SPEI dataset has a spatial resolution of 0.5° 0.5° and covers the period from January 1901 to December 2015. The monthly precipitation and PET used in the calculation of SPEI are from version 3.24.01 of the CRU TS dataset. The estimation of PET is similar to that of scPDSI based on the Penman–Monteith equation. Similar to SPI, SPEI at 3-, 6-, 9 – and 12-month time scales (SPEI03, SPEI06, SPEI09, SPEI12, respectively) are chosen to detect drought events. The categories of dry conditions based on SPI and SPEI are classified in .
In this work, the analysis periods of all the datasets are confined to 1950–2015 because many areas have no historical observations of precipitation, temperature and other meteorological variables before 1950 (Dai, Citation2011; Vicente-Serrano et al., Citation2015). The calibration or reference period for the calculation of scPDSI (van der Schrier et al., Citation2013), SPEI (Vicente-Serrano et al., Citation2010a) and SPI are set to be the period 1901–2015 for SPI and SPEI, and 1901–2016 for scPDSI. Having almost the same reference periods makes the analysis based on the three indices reasonably consistent. Additionally, the GPCC data used to produce SPI and the CRU TS data used to construct scPDSI and SPEI share many stations to create the data on regular grid cells. This further ensures reasonable consistency and comparability of the drought characteristics between the three indices used here.
2.3. Definitions and construction of the meteorological drought events database
The accepted definition of drought is elusive, flexible, and dependent on the variable used to describe the drought (Mishra & Singh, Citation2010). Usually, several thresholds are selected to classify drought events. With reference to the classification of dry conditions with scPDSI and SPI/SPEI in some previous studies (Russo, Dosio, Sterl, Barbosa, & Vogt, Citation2013; van der Schrier et al., Citation2013; Yu, Li, Hayes, Svoboda, & Heim, Citation2014), the definitions of moderate, severe and extreme drought, i.e. MD, SD and ED respectively, are shown in . For the three drought indices, when the value of the time series in each grid cell satisfies the specific classification of dry conditions shown in , the drought event therein will be identified, and the number of consecutive months meeting the criterion is defined as the duration of the drought event. The definition of a drought event in some previous works (e.g. Guo et al., Citation2018) requires a negative value of the drought index to persist for at least two or three months. However, this constraint is not imposed on the extraction of drought events in this work. Rather, we require there to be only one month whereby a specific drought criterion is satisfied in order for it to be considered a drought event. This treatment is helpful for the extraction of the whole drought event, especially for severe events, i.e. SD and ED, because serious drought might consist of several inconsecutive short dry periods. Each event in the drought event database has several basic properties to describe the drought characteristics, including the start and end time, peak time, frequency, duration, area, intensity, and severity. In addition, the temporal variations of the drought area, intensity and severity are also provided to investigate the evolution and trend of the drought event.
Drought area, frequency, duration, severity, and intensity are the critical and fundamental properties of drought characteristics (Andreadis et al., Citation2005). In this work, drought area is represented by the percentage of the extent of drought to the whole area of the study domain. Drought frequency is the number of drought events in each grid cell during each calendar year. Drought duration is defined as the number of consecutive months over which the drought event persists (Andreadis & Lettenmaier, Citation2006). Drought intensity and severity are the mean and sum of the drought indices during a drought event, respectively. In general, the above-defined quantities are used to describe the spatiotemporal variation of drought events quantitatively. Considering the generally consistent time scale of drought between different indices, we focus on the above critical characteristics of the drought events derived from SPI12, SPEI12 and scPDSI, which mainly reflect the longer-period drought events. Detailed comparative analysis between the three indices is presented in Section 3.
2.4. Drought risk assessment
The drought risk for a specific region reflects the intricate combinations and interactions between the natural-hazard and socio-economic systems (Blauhut et al., Citation2016; Carrão et al., Citation2016; Naumann et al., Citation2014). Like most natural disasters, drought can cause a wide range of economic, environmental and social impacts, but it is challenging to determine when a drought begins as a creeping natural phenomenon (Hayes et al., Citation2004). Moreover, drought risk is prone to increase in areas of dense population, extensive crop cover, high livestock density, and enhanced water stress and use, such as most parts of the present study domain (Carrão et al., Citation2016). Three independent components together determine the drought risk – namely, the hazard, exposure and vulnerability (Carrão et al., Citation2016). The first one, hazard, represents the probability of drought occurrence; exposure identifies the types of physical entities related to hazard; and vulnerability expresses the degree of exposed elements suffering negative effects induced by a hazard (Hayes et al., Citation2004). Therefore, drought risk has been represented as the product of the above three determinants and can be schematized in mathematical form (Carrão et al., Citation2016): Risk = Hazard × Exposure × Vulnerability. The exposure and vulnerability elements may describe different aspects of geographical and socio-political contexts, for which it has been advised that certain representative and easily understandable indicators are selected (Neri & Magaña, Citation2016).
In this work, the climatic meteorological drought hazards are computed from historical gridded meteorological drought indices (i.e. SPI12, SPEI12 and scPDSI), which are given in terms of probability over the analyzed region. The population density, as one of the exposure indicators, is also obtained at the gridded scale. Therefore, the probability of population exposure to drought hazards can be simply estimated for each grid cell. However, most exposure and vulnerability indicators are only available at the national level. Thus, for convenience of comparison between different countries, the drought hazard, exposure and vulnerability indicators are normalized by taking into account the maximum and minimum values of each indicator across all countries or sub-regions (Carrão et al., Citation2016; Neri & Magaña, Citation2016).
2.4.1. Analysis of drought hazard: gridded and country-based drought hazard
In order to reflect the relative probability of the occurrence of drought events in DPEA, SPI12, SPEI12 and scPDSI are further used to compute the drought hazard index (DHI). Firstly, an SPI/SPEI of −1.0 and scPDSI of −2.0 are selected as the thresholds to identify the drought events. The drought event identification procedure is presented in detail in Section 2.3. Secondly, the annual accumulated severity of drought events at each grid cell in DPEA is estimated during 2000–2015. The resulting long-term averaged accumulated severity thus represents the degree of drought hazard in each grid cell of the studied region. Then, the normalized mean accumulated severity is used as DHI in this study. In terms of the technical settings, we normalize the gridded drought hazard to vary between 0 and 1 by calculating the probability relative to the sample of the whole geographic region studied here (Carrão et al., Citation2016; Folland & Anderson, Citation2002). Therefore, the DHI constructed here can be used to evaluate the drought hazard probability at a specific location relative to other grids in the overall DPEA domain. In addition, we focus on the drought hazard in the most recent 16 years only, because the availability of the population density data and some other exposure and vulnerability indicators is limited to the year 2000 onwards.
The above assessment of DHI is a grid-based estimate; for a country or sub-region, we further compute the area-weighted average of the gridded DHI for each country or sub-region. In order to make national DHI comparable between different countries/sub-regions, the country-based DHI is then normalized across all countries in (Neri & Magaña, Citation2016). The resulting country-based DHI (DHI-Country) can be used to measure the relative drought hazard in DPEA, i.e. a DHI-Country of 1 for the highest drought hazard values and 0 for the lowest.
2.4.2. Analysis of drought exposure, vulnerability and risk at the national level
It is unrealistic to include all the related indicators into the drought risk assessment. For drought exposure and vulnerability, ecological, socio-economic and production conditions have been used as the key indicators (Shahid & Behrawan, Citation2008). Following the work of Naumann et al. (Citation2014) and Carrão et al. (Citation2016), we select four exposure indicators [population density index (PDI), agricultural land of land area (AL), livestock production index (LPI), and level of water stress (LWS)] and six vulnerability indicators [gross domestic product per capita (GDP), poverty headcount ratio at national poverty lines (PHR), social sector of rural population of total population (RP) and population ages 65 and above of total population (PA65), infrastructural sector of agricultural irrigated land of total agricultural land (AIL), and renewable internal freshwater resources per capita (RIFW)]. These indicators cover the aspects of population, agricultural land, assets, water resources, infrastructure, and so on. Aside from PDI, all the indicators used here are country-based data, sourced from the World Bank website (http://data.worldbank.org/products/wdi).
The population is a crucial climate-related exposure indicator; a more remarkable influence is caused by climatic changes in populated areas than the equivalent changes in unpopulated areas (Diffenbaugh, Giorgi, Raymond, & Bi, Citation2007). Therefore, population exposure is a quantity tightly related to the impact of drought hazard in populated regions. The population density data used here are available at the website https://sedac.ciesin.columbia.edu/data/collection/gpw-v4/documentation, which provides a gridded population of the world (version 4) at a 0.5° spatial resolution. The population density gridded data consist of estimates of the human population, consistent with national censuses and population registers for the years 2000, 2005, 2010, 2015 and 2020 (Center for International Earth Science Information Network [CIESIN], Citation2018). The data for the four years of 2000, 2005, 2010 and 2015 are used to produce PDI, whose computing method is the same as that of DHI. Population exposure to drought hazard on the gridded base is defined similarly to the work of Diffenbaugh et al. (Citation2007), by simply multiplying DHI by PDI in each grid cell.
As mentioned above, the remaining three exposure indicators, i.e. AL, LPI and LWS, are national data. Therefore, the temporally averaged AL, LPI and LWS in each country can be computed during the analyzed period, hereinafter referred to as AL-Country, LPI-Country and LWS-Country, respectively. For the country-based assessment, the country-based PDI (PDI-Country) is produced by computing the area-weighted average in each country, similar to the method for DHI-Country (Section 2.4.1). To make the indicators comparable between different countries, the resulting “-Country” index is also normalized to vary from 0 to 1 (Neri & Magaña, Citation2016), where a value of 1 means the most exposure to drought.
The indicators of vulnerability reflect the level of quality of different constituents of civil society; for example, natural hazards generally induce more stress to the poorest of the world’s citizens (i.e. PHR) because of a vulnerable environment or poor resources (Diffenbaugh et al., Citation2007). The normalized values of PHR-Country, RP-Country and PA65-Country are also calculated similarly to the drought exposure indicators. However, because GDP, AIL and RIFW are negatively correlated with the vulnerability, transformation is applied to the indicators (Carrão et al., Citation2016), hereafter referred to as GDP-Country, AIL-Country and RIFW-Country, respectively, with values between 0 (less vulnerable) and 1 (most vulnerable).
For each country, through 0–1 linear transformation of every exposure and vulnerability indicator, the arithmetic means of the four drought exposure indicators (i.e. PHR-Country, AL-Country, LPI-Country and LWS-Country) and six drought vulnerability indicators (i.e. PHR-Country, RP-Country, PA65-Country, GDP-Country, AIL-Country and RIFW-Country) are combined as a composite drought exposure index (DEI-Country) and vulnerability index (DVI-Country), respectively. For missing values of vulnerability indicators (e.g. PHR-Country and AIL-Country) in a few countries, we remove these indicators from the computation of the vulnerability indices.
Based on the above country-based hazard, exposure and vulnerability indices, the national drought risk index (DRI-Country) is calculated as the product of the hazard-Country, exposure-Country and vulnerability-Country indices. It should also be noted that this study partitions China into three sub-regions: CNE, CNW, and TIB, because of the diversity of climate and socioeconomic inhomogeneity, as shown by . For the same reason, Russia also has two sub-regions: European Russia and Asian Russia. Because only national exposure (except for PDI) and vulnerability data are available, the same normalized values are applied to the different parts of China and Russia. Admittedly, more detailed information about these indicators at the grid scale would be better than that from the country-based scale. However, presently, risk assessment at the national level is still meaningful for assessing the impact of large-scale drought. Further improvements can be made at finer spatial scales when gridded data of the above indicators become available in the future.
3. Drought climatology over DPEA
3.1. Inter-comparison between different drought indices
Cross-correlation maps between SPI, SPEI and scPDSI are presented in . It can be seen that scPDSI is highly correlated with SPEI at all time scales, with peaks at 9 and 12 months, where the t-test of the correlation has removed the impact of autocorrelation. Furthermore, the strong correspondences between scPDSI and SPEI/SPI vary among regions, which implies the possible time scale of scPDSI is not fixed in different regions. Therefore, scPDSI has a flexible but roughly annual time scale. This is one of the shortcomings of PDSI/scPDSI, which is not an index that can be applied in identifying both shorter and longer time-scale droughts (Vicente-Serrano et al., Citation2010a). In detail, for the correlation between scPDSI and SPEI03, the strongest correlations are mainly located in the dry areas, such as CWA and South Europe. However, also at the 3-month time scale, the scPDSI–SPI correlations are relatively lower, although the coefficients in most grid cells have passed the significance test at the 5% level (effective degrees of freedom considered). Compared to the longer time-scale SPI (), relatively higher correlations exist between scPDSI and the short-term SPI03. Szalai, Szinell, and Zoboki (Citation2000) also found that the correlation of SPI with streamflow or soil moisture content in Hungary reached a maximum at a time scale of 2–3 months. SPI is a better indicator of short-term precipitation and soil moisture variation than PDSI (Mishra & Singh, Citation2010). Similarly, the correlations are lower between SPEI and SPI at 9 and 12 months, compared to the correlations at the shorter time scales ().
Figure 2. Spatial distribution of the cross-correlations between scPDSI, SPEI and SPI at different time scales: correlation between (a1–a4) scPDSI and SPEI, (b1–b4) scPDSI and SPI, and (c1–c4) SPEI and SPI. The shaded areas in DPEA represent the grid cells having correlations statistically significant at the 5% level (effective degrees of freedom considered).
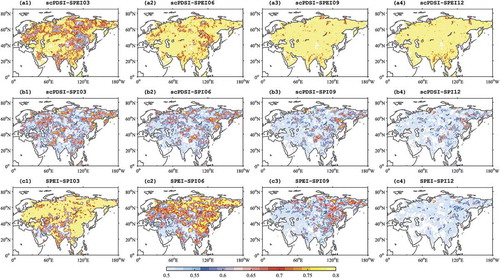
On the one hand, show that the SPEI–SPI correlations are lower over the areas with less precipitation (e.g. the Arabian Peninsula). The drought index only considering precipitation variability cannot indicate the dryness conditions in the low-precipitation region well, particularly at longer time-scales under the current warming background. On the other hand, PET, which is used in SPEIs, represents the evaporative demand by the atmosphere, and this is very different from actual evapotranspiration or precipitation, which affect the drought conditions over arid and semi-arid regions (Beguería et al., Citation2014; Dai, Citation2011). Therefore, the estimated water demand of SPEIs is more sensitive to the PET, which may be unrealistic over an arid region (Zhang et al., Citation2015). Considering the enhanced calculation of water balance in PDSI/scPDSI, scPDSI may be superior to SPEI in drought quantification over many water-limited land areas (Cook, Smerdon, Seagar, & Coats, Citation2014; Dai, Citation2011).
Although SPI/SPEI is a meteorological drought index, the choice of the different time-scale ranges of SPI/SPEI can evaluate the condition of meteorological, agricultural and hydrological drought (Halwatura, McIntyre, Lechner, & Arnold, Citation2017; Lloyd-Hughes & Saunders, Citation2002). Previous studies have indicated that a 12-month SPI is more suitable to determine the dry periods for water resources management than an SPI at a shorter time scale, especially for areas with clear rainy and dry seasons (Adnan, Ullah, & Shouting, Citation2016; Raziei, Saghafian, Paulo, Pereira, & Bordi, Citation2009). Additionally, it is expected that SPEI12 is suitable for comparison with scPDSI (Vicente-Serrano et al., Citation2015). Therefore, this work focuses mainly on the variation of drought characteristics at a longer time scale, i.e. those reflected by scPDSI, SPEI12 and SPI12.
3.2. Dominant modes of variability of drought indices
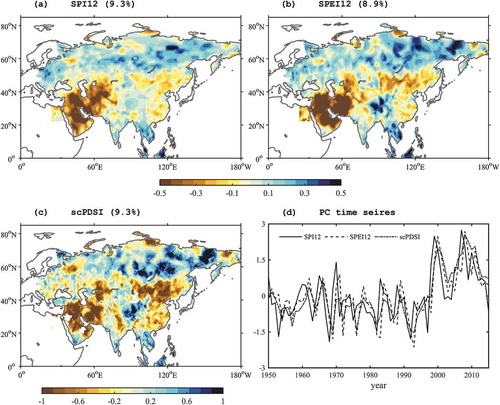
Empirical orthogonal function (EOF) analysis is applied to the annually averaged drought indices, precipitation and PET data to retrieve the fundamental modes over the analyzed region. Before the analysis, however, the monthly variables are deseasonalized by subtracting the smoothed calendar means. The first EOFs of the three drought indices, which explain about 9% of the total variance, clearly exhibit consistent spatial structures as well as temporal variation. The first modes extract the long-term trends with drying over CNE, Mongolia in CNW, CWA, and wetting over Eastern of MR, TIB, Southern India in BIM and SEA since the 1990s ().
Figure 3. Spatial patterns of the first EOF of the annual (a) SPI12, (b) SPEI12 and (c) scPDSI, and (d) their associated standardized temporal patterns from 1950 to 2015. The variance explained by the EOF is shown in brackets.
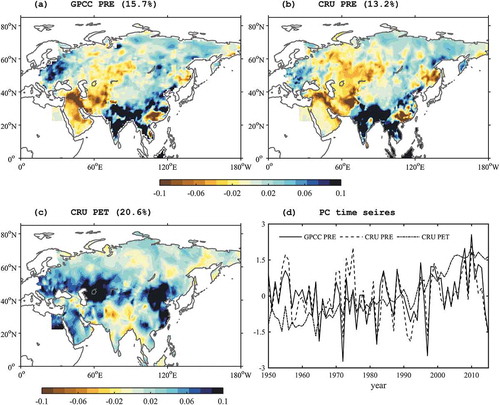
To investigate the impact of precipitation and PET on scPDSI and SPEI, shows the first leading EOF modes of GPCC V7.0 precipitation (GPCC-PRE, 1°1°), and CRU precipitation and PET (CRU-PRE and CRU-PET, 0.5°
0.5°) from version 3.24.01 of the CRU TS dataset during 1950–2015. The leading modes account for 15.7%, 13.2% and 20.6% of the total variances for the three variables, respectively. ,) show that the spatial patterns of GPCC-PRE and CRU-PRE are closely similar, and also show consistent patterns of temporal variability ()). As mentioned above, the first EOFs capture the trends in the annually averaged precipitation, showing areas with decreased precipitation in Central and Southwest Asia and South China since the 1990s. The modes also indicate enhanced precipitation over the south of TIB, as well as the Indian Subcontinent and Maritime Continent. The corresponding time series of the EOF1 of CRU-PET indicate a significant increasing trend from 1950 to 2015. For the EOF1 of PET, the enhancement is found in most areas, especially in Central Asia (i.e. eastern area to the Caspian Sea), Mongolia and Eastern China. The areas with decreasing PET are scattered over TIB and MR. Therefore, the drying in Central Asia, Southwest Asia and South China is consistent with the relationship between the decrease in precipitation and simultaneous increase in PET. It should be noted that the PET becomes more important in accounting for the drying trends in the areas of Mongolia and North and Northeastern China. The only difference in dryness between SPI12 and SPEI12 is due to the PET, which indicates that the enhanced PET areas of Central Asia and Eastern China are prone to becoming even drier (,)).
Figure 4. As in , but for (a) GPCC precipitation, (b) CRU precipitation, (c) CRU PET, and (d) their associated standardized temporal patterns.
The study of Vicente-Serrano et al. (Citation2015) indicates that PDSI is more sensitive to precipitation than to PET because its basis is related to a simple water balance model. However, SPEI displays a high contribution of evapotranspiration to drought severity in semiarid regions from the climatological viewpoint, due to the larger magnitude and variance of PET than of precipitation. Furthermore, the climatology and the change in evapotranspiration are very complicated and difficult to determine reliably. CRU-PET is estimated based on the Penman–Monteith parameterization approach, which is more physically realistic but requires more diverse input data than the Thornthwaite approach (Allen, Smith, Perrier, & Pereira, Citation1994; van der Schrier, Jones, & Briffa, Citation2011). The estimate of PET is greatly influenced by the definition of the reference evapotranspiration, according to Allen, Pereira, Rase, and Smith (Citation1998), which can be defined as the rate of evapotranspiration from an extensive surface of hypothetical grass of uniform short height, actively growing and adequately watered. The conditions of the reference evapotranspiration are unlikely to be met across large areas in some regions, such as the Tibetan Plateau (e.g. Zhang, Wang, & Chen, Citation2019), However, as was claimed by Allen et al. (Citation1998), the Penman–Monteith approach for estimating reference evapotranspiration does not fuel controversy and provides consistent and reliable information in different weather conditions and locations, which is why it is recommended by the Food and Agriculture Organization of the United Nations. Although the Penman–Monteith equation is more often recommended (Beguería et al., Citation2014) to estimate PET in the computation of SPEI, whether the Thornthwaite approach or Penman–Monteith equation is employed, similar estimates of PDSI seem to be produced (van der Schrier et al., Citation2011). For SPEI, the differences due to different evapotranspiration parameterizations are significant in semiarid to mesic areas. However, PDSI is not as sensitive as SPEI to the parameterization approach of evapotranspiration. Therefore, some researchers have recommended PDSI as a more suitable drought index in applications in regions where the drought change closely relates to the PET (Vicente-Serrano et al., Citation2015).
3.3. Trends in dryness/wetness
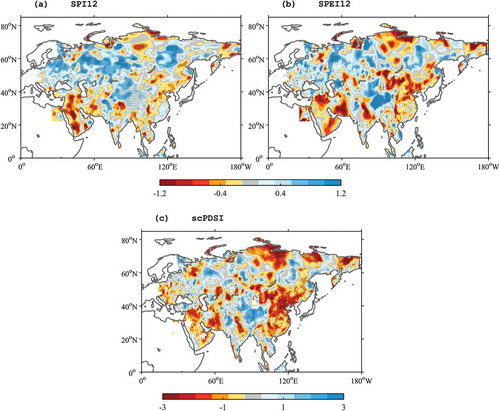
The spatial distributions of the trends in the annual SPI12, SPEI12 and scPDSI are presented in . When only precipitation variation is considered, i.e. SPI12, more areas tend to be shown as getting wetter. This evident wetting trend is detected across eastern of CEE, central of MR, TIB, and Northwest of CNW in SPI12 ()). It can also be seen from all three indices that the drying trends are significant over the Arabian Peninsula and the western area of the Iranian Plateau. Significant drying trends are also found over most areas east of 90ºE, including CNE and the Central Siberian Plateau, especially for SPEI12 and scPDSI. On the other side, significant wetting trends appear over the western part of DPEA, except for the Middle East. The areas with the most robust wetting trend shown in SPEI12 and scPDSI are Northwest of CNW and TIB.
Figure 5. Maps showing the trends of change in annual (a) SPI12, (b) SPEI12 and (c) scPDSI (units: SPI/SPEI/scPDSI values per five decades) from 1950 to 2015. Dotted areas have trends that are statistically significant at the 5% level.
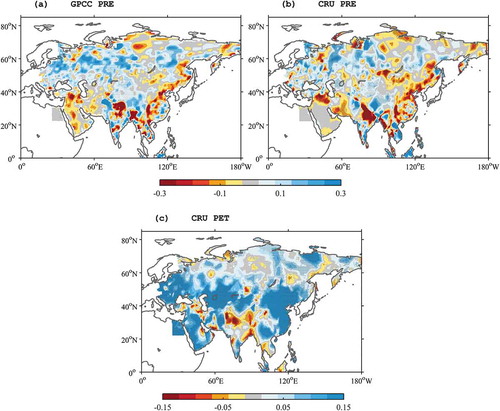
shows the precipitation and PET trends. Compared to the trend patterns in drought indices (), the variations of dryness and wetness are more closely related to the variability of precipitation. CNE, the Arabian Peninsula and the south of the Iranian Plateau in CWA are suffering from the drying effects of both decreasing precipitation and increasing PET. The differences in trends between SPIs and SPEIs partly reflects the inconsistency between GPCC and CRU precipitation. The main disparity between them appears in the western part of the Arabian Peninsula, where a significant decreasing trend is shown in GPCC-PRE, but no drying trend is found in CRU-PRE.
Figure 6. As in , but for (a) GPCC precipitation, (b) CRU precipitation, and (c) CRU PET (units: mm/day per five decades). Dotted areas have trends that are statistically significant at the 5% level.
4. Drought changes over DPEA
4.1. Drought area
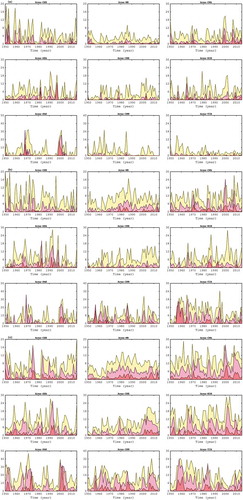
shows the area percentages of the MD, SD and ED events represented by SPI12, SPEI12 and scPDSI for the nine sub-regions. There are reasonably consistent trends of drought areas described by SPEI12 and scPDSI in most of the sub-regions. Except for SEA, PAK and TIB, the drought in the six other sub-regions generally tends to expand its area. In these six sub-regions, the three types of drought events exhibit significant upward trends in MR and CNE (except for ED events in SPEI12), based on both scPDSI and SPEI12 ( and ). For SPI12, most drought events identified by the index display weaker trends than the other two indices over the nine sub-regions, although the variations of the area time series displayed by the three indices are substantially consistent. Remarkable spatially expanding trends of SD and ED events are detected over CWA both in scPDSI and SPI12, but not in SPEI12 (). The drought areas in TIB exhibit visible downward trends, especially for MD events. This wetting trend is consistent with the study by Yu et al. (Citation2014) using SPEI during 1951–2010, especially in the eastern Tibetan Plateau. A previous study also pointed out that the wetting trend detected in the eastern Tibetan Plateau was mainly induced by the melting of the Himalaya’s glaciers under the influence of rapid climatic warming (Cook et al., Citation2010).
Table 2. Percentage area trends (units: % per five decades) of MD (moderately dry), SD (severely dry) and ED (extremely dry) events in nine sub-regions, based on SPI12, SPEI12 and scPDSI. Bold numbers are statistically significant at least at the 10% level (*10% level; **5% level; ***1% level) A dash (–) indicates no trend.
Figure 7. Annual area percentages for MD (moderately dry; yellow), SD (severely dry; pink) and ED (extremely dry; red) events in the nine sub-regions of DPEA based on SPI12 (a), SPEI12 (b), and scPDSI (c).
4.2. Frequency of drought events
plots the number of drought events according to the three indices over the sub-regions across DPEA during 1950–2015. The results show that SPEI12 and scPDSI are similar in their distribution of drought-event frequencies during the past 66 years. However, far fewer drought events are identified by SPI12 (). In particular, SPI12 detects almost no ED events in the Tibetan Plateau, but such events are detected at a far greater frequency in the same region by SPEI12 and scPDSI (). Except for TIB, the higher frequencies of drought events detected by SPEI12 and scPDSI also appear in Eastern Europe, Southwest Asia, India, and Southeast China. Furthermore, a higher frequency appears over the Central Siberian Plateau in SPEI2. We also investigated the annual frequency changes (figure omitted), for which all three drought indices showed consistent characteristics and had long-term frequency changes similar to those shown in . The significant trends towards larger frequencies of moderate to extreme drought events also mainly occur in MR and CNE. However, there is no significant downward trend in annual drought frequency in TIB in both the SPEI12 and scPDSI.
Figure 8. The number of MD [moderately dry (a, d, g)], SD [severely dry (b, e, h)] and ED [extremely dry (c, f, i)] events for DPEA during 1950–2015, based on SPI12 (a–c), SPEI12 (d–f), and scPDSI (g–i). Blanked areas have no drought events identified.
![Figure 8. The number of MD [moderately dry (a, d, g)], SD [severely dry (b, e, h)] and ED [extremely dry (c, f, i)] events for DPEA during 1950–2015, based on SPI12 (a–c), SPEI12 (d–f), and scPDSI (g–i). Blanked areas have no drought events identified.](/cms/asset/92dead16-87cc-40c1-a895-c72eb9171400/tbed_a_1710383_f0008_c.jpg)
4.3. Duration, intensity and severity of drought events
Drought duration, intensity and severity are also essential aspects of drought characteristics. Here, drought duration is defined as the number of consecutive months satisfying the drought criteria mentioned in Section 2.3. shows the mean duration distributions of the drought events detected by the three indices. The spatial structures of the three indices are consistent, especially between SPI12 and SPEI12, but with longer durations found in scPDSI than in the other two indices. Comparing the maps of with , we can see that no clear correspondence exists between the frequency and duration of drought events. In scPDSI, high drought frequency long-duration drought concurrently occur in the Arabian Peninsula and the south of the Iranian Plateau, i.e. the southern part of CWA. However, this relationship does not exist in the north of Central Asia, CNW, south TIB and north BIM, where there are high frequencies of drought. For SPI12 and SPEI12, there is even an inverse relationship, i.e. high frequency with low duration, appearing over Eastern Europe and South China for MD and SD events. This feature was also mentioned in a drought climatology study for Europe by Lloyd-Hughes and Saunders (Citation2002).
Figure 9. As in , but for the mean duration of drought events. Blanked areas have no drought events identified.
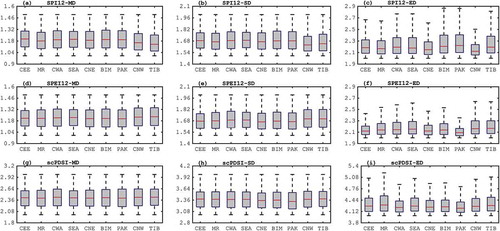
The differences in duration between the nine sub-regions can be more easily observed in the boxplots shown in . At first glance, the durations in all sub-regions are positively skewed, i.e. there are a few extremely long durations. The duration of persistent drought events can exceed 70 months, although the median duration is generally below three months. The length of the mean duration is partly influenced by the drought-event definition, noting that a drought event in this work is defined as the values of the indices satisfying a specific condition for at least one month. Relatively shorter drought durations are found in SPI12 compared with SPE12 over most sub-regions. Comparing the boxplots of scPDSI with SPEI12/SPI12, we can see that the regional difference is more significant in scPDSI than that in SPI12 and SPEI12 (also in ). Additionally, it is unsurprising that the dry areas, such as PAK, BIM, CNW and CWA, are generally home to long-duration drought events; and conversely, more short-duration events are found in the wet areas, such as CNE, CEE and MR.
Figure 10. Boxplots for the duration (in months) of MD [moderately dry (a, d)], SD [severely dry (b, e)] and ED [extremely dry (c, f)] events during 1950–2015 over the nine sub-regions of DPEA from SPI (a–c), SPEI (d–f), and scPDSI (g–i). Outlier values are not shown.
![Figure 10. Boxplots for the duration (in months) of MD [moderately dry (a, d)], SD [severely dry (b, e)] and ED [extremely dry (c, f)] events during 1950–2015 over the nine sub-regions of DPEA from SPI (a–c), SPEI (d–f), and scPDSI (g–i). Outlier values are not shown.](/cms/asset/a48bc025-fdda-4b01-bde3-8bd3af6d2737/tbed_a_1710383_f0010_c.jpg)
Drought intensity is defined as the mean drought index within the drought duration. It is evident in that the distribution of intensity has weak skewness, particularly for MD and SD events, partly because the definitions of these two types of drought events require the indices to be between two specified threshold levels (see ). For ED events, the intensity is right-skewed and more variable between different sub-regions. The intensity of ED events in SPI12 is generally stronger than those in the other two indices (). Furthermore, the ED events in PAK, BIM and TIB display weak intensity but long duration () in both SPEI12 and scPDSI. However, for the same sub-region, long duration with strong intensity is the main characteristic of the SD events of SPI12. The results further suggest that drought events may display completely different characteristics when including the influence of temperature in the drought index, particularly for the area of TIB. Generally, the drought events in MR, SEA, CNW and TIB tend to be stronger than those in CNE, BIM and PAK for both SPEI12 and scPDSI. Differences in drought intensity for ED events still exist between scPDSI and SPEI12, such as in CEE and CWA.
Figure 11. As in , but for the intensity of drought events. Values have been multiplied by −1.
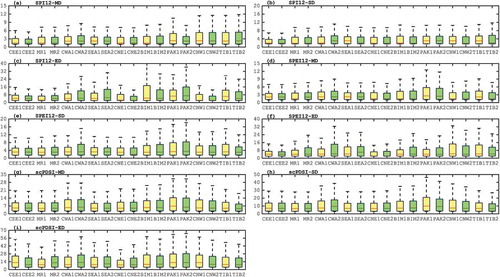
The severity of a drought event is measured by the accumulated drought intensity during the drought duration. Since the 1980s, the drought frequency and severity has experienced a remarkable change in some regions, e.g. in Europe (Spinoni et al., Citation2017). Similarly, in this work, the drought severity is separately discussed for the two sub-periods, i.e. 1950–1980 and 1981–2015. As shown in , only small differences exist in the MD and SD events between the two sub-periods, but a more significant difference for ED events. As the boxplots show, the ED events in most of DPEA’s sub-regions have undergone an upward trend during the period 1981–2015, except for some regional differences in CEE, CNW and TIB, where weakening trends of severity appear.
Figure 12. As in , but for the severity of drought events. Values have been multiplied by −1. Yellow-shaded/green-shaded boxes indicate the severity distribution for the period 1951–1980/1981–2015.
5. Drought risk assessment for DPEA
5.1. Gridded drought hazard and population exposure to drought hazard
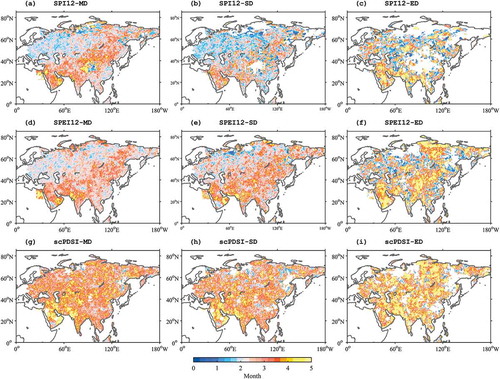
show the spatial distribution of the gridded DHI based on the three drought indices. Similar spatial structures of drought hazard are shown for the three indices, in which the Arabian Peninsula, Iranian Plateau, India, Southeast China, Mongolia and Northeast China are indicated as more likely to develop drought than other regions. Additionally, the distribution of DHI has a similar spatial structure to the leading EOF of scPDSI in ).
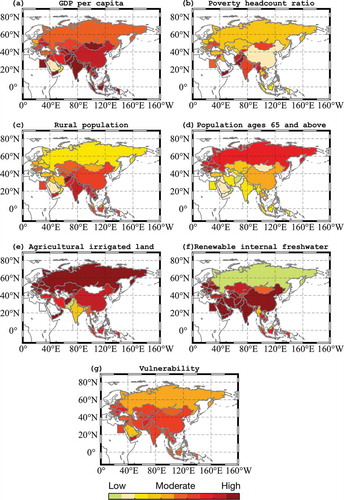
Figure 13. Spatial distribution of the gridded population density (a), drought hazard (b, d, f), and population exposure to drought hazard (c, e, g) of DPEA during 2000–2015 based on SPI12 (b, c), SPEI12 (d, e), and scPDSI (f, g).
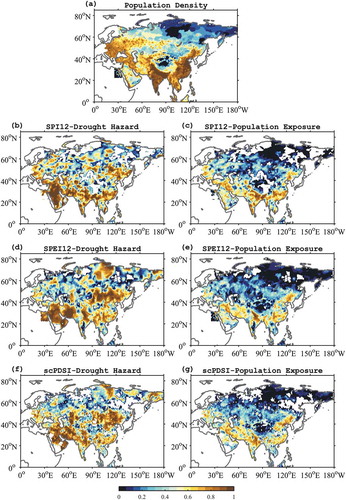
Population density, as one of the socio-economic drought exposure indicators, is used to produce gridded exposure to drought hazard (see Section 2.4.2). The population densities are generally higher in developing countries than developed ones. It is well known that the population density is highest in the Indian Subcontinent, eastern China and Southeast Asia ()). Therefore, the high-value area of population exposure to drought hazard is mainly located in the regions south of 40ºN and distributed along the southern rim of Eurasia (), where strong drought hazard is coincident with the high population. However, for the area north of 40ºN, the low-density population dramatically relieves the drought exposure, although the drought hazard is also high over Mongolia and North-central Russia.
5.2. Country-based drought risk assessment for DPEA
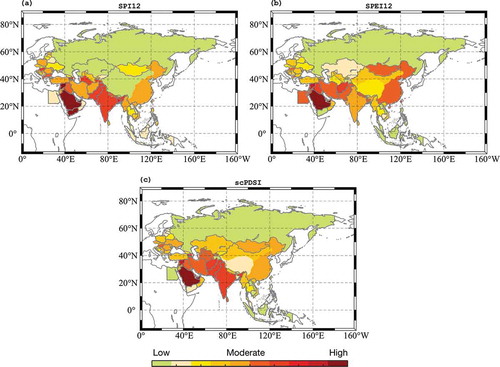
shows the national or sub-regional map of drought hazard computed from the gridded drought events in the period 2000–2015. Despite the similarity between the presented spatial patterns of national hazard, the level of hazard is higher in SPEI12 than those in SPI12 and scPDSI in most countries and sub-regions. Low drought hazard values cover most of the land areas of CEE and Russia, especially when SPI12 is used as the drought index. In general, high drought hazard occurs in countries of arid or semiarid land, such as in southern CWA and PAK. Furthermore, high-level hazard is also apparent in BIM, the Mediterranean region, along southwestern coastlines of the Black Sea, in eastern China, and Mongolia (a moderate-level hazard in SPI12).
Figure 14. Country-based drought hazard in DPEA during 2000–2015, based on SPI12 (a), SPEI12 (b) and scPDSI (c).
The drought exposure is presented at the national or sub-regional level in , in which the “-Country” indicator scores vary from 0 (the least exposure) to 1 (the most exposure). It is clear that the areas with intense population density exposure are generally located in densely-populated countries ()), mainly distributed in a belt along the southern rim of Eurasia, including countries in the Middle East and Indian Subcontinent, as well as eastern China. On the other side, sub-regions with a low density of population, such as MR, CNW, TIB, therefore have low population-related drought exposure. However, according to ), these low-population density sub-regions, except for Russia, Egypt and sub-region SEA, have more agricultural lands exposed to drought, i.e. they show high-level exposure based on AL-Country. Particularly, Mongolia, Kazakhstan, Turkmenistan and Saudi Arabia have the highest AL exposure scores. In terms of exposure to water stress, the countries in CWA have the highest LWS-Country scores ()). Meanwhile, for livestock production exposure, moderate LPI-Country scores are found in most countries and sub-regions, except Myanmar, which is the country with the highest score. Based on the above four exposure indices, the composite exposure to drought (DEI-Country) is shown in ). Over the analyzed region, drought exposure is relatively higher in the Arabian Peninsula, the Indian Subcontinent and eastern China. DEI-Country indicates the highest drought exposure is in the Arabian Peninsula, especially Saudi Arabia. At the second level of exposure, Yemen, Turkey, and some Central Asian countries located south of the Aral Sea (Uzbekistan and Turkmenistan) also show high exposure scores. South Asia (Pakistan and the Indian Subcontinent) and eastern China have a comparable level of drought exposure. From , the highest score, in the Arabian Peninsula, is mainly caused by high exposure due to agricultural land and water stress. However, for India and eastern China, the high population density and agricultural land are the main determinants of the high exposure to drought. The Asian part of Russia has low exposure in three out of the four indicators, thus having the lowest score of exposure to drought.
Figure 15. Country-based exposure indicators in DPEA during 2000–2015, presented by population density (a, PDI-Country), agricultural land (b, AL-Country), level of water stress (c, LWS-Country), livestock production index (d, LPI-Country), and composite exposure (e, DEI-Country).
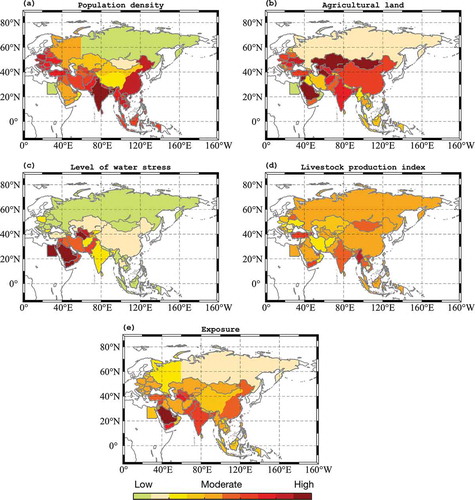
presents the drought vulnerability maps of the six indicators and an arithmetic composite map derived from them. The two economic factors, i.e. GDP-Country and PHR-Country, have opposite meanings to drought. A growing PHR-Country means more poverty and more vulnerability to drought. However, an increase in GDP-Country enhances the ability to resist drought. suggest relatively high values of vulnerability in Mongolia and areas to the southwest and south of the Tibetan Plateau, such as Iran, Pakistan, Indian, and Bangladesh. The two social factors, RP-Country and PA65-Country, display inverse relationships with vulnerability. In Eastern Europe and Russia, which are relatively well-developed in DPEA, the low vulnerability of the rural population matches the high vulnerability of the population aged 65 and above. However, the opposite relationship to vulnerability is apparent in Asian countries (). In general, the rural population in developing countries may be more vulnerable to natural hazards because of their relatively lower incomes. Both infrastructural indicators, AIL-Country and RIFW-Country, are negatively correlated with drought disasters. According to , high vulnerability exists in areas of irrigated agricultural land and areas with low renewable internal freshwater across most countries in DPEA, while the countries of South Asia are less vulnerable based on AIL-Country ()), and Russia and Myanmar are the countries with a lower RIFW-Country score ()). By combing all the above economic, social and infrastructural factors, the overall vulnerability map ()) indicates that almost the whole analyzed region has moderate vulnerability to drought hazard, except the relative lower vulnerability in Russia and most parts of the Arabian Peninsula.
Figure 16. Country-based vulnerability indicators in DPEA during 2000–2015, presented by GDP per capita (a, GDP-Country), poverty headcount ratio (b, PHR-Country), rural population (c, RP-Country), population ages 65 and above (d, PA65-Country), agricultural irrigated land (e, AIL-Country), renewable internal freshwater (f, RIFW-Country), and composite vulnerability (g, DVI-Country).
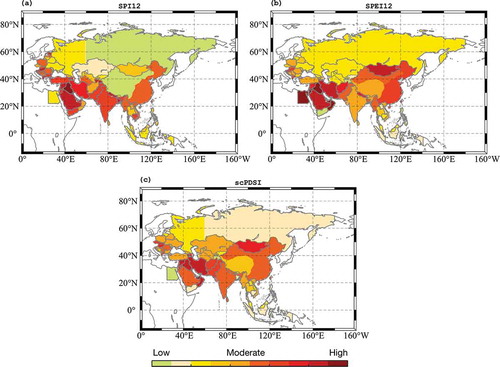
In , we separately present the national or sub-regional drought risk via computing the product of the country-based drought hazard, exposure and vulnerability presented in , ) and ), respectively. In general, the countries/sub-regions of Southeast Asia, Kazakhstan, western China and Russia, where low to moderate exposure to drought is found, have low drought risk correspondingly. This feature is more clearly reflected by SPI12 ()), suggesting the critical role of precipitation in drought risk assessment in most regions. On the other hand, the drought risk is the highest in southern and southwestern Asia, including Saudi Arabia, Pakistan and India, because these countries are subject to more drought hazard and exposure ( and ). The remaining regions with moderate drought risk correspond to moderate exposure and drought hazard. In eastern China and Mongolia, the risk assessment based on SPEI12 indicates higher scores than those based on SPI12 and scPDSI. In Kazakhstan in CWA, northwestern of CNW and TIB, SPI12 tends to underestimate the drought risk in SPEI12 and scPDSI. That means the inclusion of temperature as a factor in drought indices will enhance the level of drought risk in these regions.
Figure 17. Country-based drought risk in DPEA during 2000–2015, based on SPI12 (a), SPEI12 (b), and scPDSI (c).
6. Discussion and conclusions
Drought, as a complex and naturally occurring climate phenomenon, impacts human, environmental and socio-economic activity globally (Sheffield et al., Citation2009). This study presents meteorological drought events during the period 1950–2015 over the developing areas of Eurasia (DPEA), which includes some of the most densely-populated developing countries in the world (Guzmán et al., Citation2009). The drought-event databases are separately constructed according to three popular meteorological drought indices, i.e. scPDSI, SPI and SPEI, in different accumulation periods. By combining the drought events databases with socio-economic datasets, we finally produce a country-based drought risk dataset to estimate the vulnerability and risk to drought at the national spatial scale. The use of meteorological drought hazard information in the risk assessment and identification of vulnerability to drought may help us to identify adaptation measures to climate change, and even to implement drought early warning systems (Neri & Magaña, Citation2016).
Compared to previous work on global-scale drought change (e.g. Sheffield et al., Citation2012; Spinoni et al., Citation2014), we provide a more comprehensive drought-event dataset for DPEA via the consideration of multiple meteorological drought indices to identify drought events of different intensity. Since SPI, SPEI and scPDSI are separately calculated based on precipitation alone, precipitation and PET, and water supply and demand using a water-budget model, respectively, some divergences between them are expected. Because any single index is not sufficient for precisely identifying drought events and examining drought characteristics, the combined use of different indices may better represent the actual drought condition and its variations (Alvalá et al., Citation2019).
Based on the drought-event dataset, we further investigate the characteristics of the drought events in different sub-regions in DPEA. For SPI and SPEI, the drought events are organized in this study according to various accumulation periods, mainly ranging from 3 to 12 months. A comparative analysis of three types of drought index (i.e. SPI12, SPEI12 and scPDSI) is performed to present a comprehensive insight into the spatial distribution of dryness/wetness variation over DPEA. The drought events characteristics in the nine sub-regions of DPEA, including drought area, frequency, duration, intensity and severity, are explored in detail based on the multiple types of indices. In general, the different types of indices exhibit close correspondence to each other but with the existence of some regional differences, such as the drought frequency in the area of the Tibetan Plateau. The maximum correlations of drought variation occur between scPDSI and SPEI at 9–12 months. The highest correlation between SPI and scPDSI/SPEI is detected at the 3-month scale. These results indicate that the main variabilities in dryness/wetness conditions are induced by precipitation, especially for short-term drought events. Trends extracted from these indices show that the Middle East and most areas of DPEA to the east of 90ºE, including CNW, CNE and Central of MR, underwent a drying phase during the study period. Significant wetting trends occurred over most parts of the western DPEA. The significant trends towards larger drought areas and higher drought frequencies mainly occurred in Siberia and the east part of China. However, for the drought events in some sub-regions of DPEA, a high frequency of the event does not mean it will last for a long time. Conversely, the high frequencies of drought events in Europe and South China correspond to a short drought duration. The dry-climate sub-regions of DPEA, such as the Middle East and Central Asia, have tended to experience more long-lasting drought events in recent decades, whereas shorter ones are more frequently found in humid sub-regions, such as East China, Central-East Europe and Siberia. The severity of the extreme drought events displayed upward trends in all three indices over most of the sub-regions during 1981–2015, except for weakening trends found in CEE, northwestern of CNW and TIB.
The main goal of this study was to construct a second-level dataset of drought risk in DPEA based on the drought events database extracted from the traditional drought indices. Thus, we mapped the drought risk at the national level over DPEA by combining the historical drought hazard, exposure and vulnerability to drought during 2000–2015. As the first step of the risk analysis, this work has focused on meteorological drought hazard, whose results show high drought hazards existing in the southern rim of Eurasia, including the Middle East, Indian Subcontinent, Mediterranean, and southwestern Black Sea coastal regions, as well as Mongolia and the east part of China. In the next step, drought risk evaluation should account for differences caused by diverse vulnerability and exposure components to drought (Blauhut, Gudmundsson, & Stahl, Citation2015). The exposure and vulnerability indicators selected in this work cover some vital aspects of social, economic and infrastructural components. Though the choices of exposure and vulnerability factors cannot thoroughly evaluate the negative impacts of drought hazard on the social and economic conditions, the indicators chosen here may help to monitor drought effects and identify adaptation measures to climate change (Neri & Magaña, Citation2016). Within DPEA, high exposure to drought was found in countries with dense populations, extensive agricultural lands, and enhanced water stress, mainly concentrated in the Arabian Peninsula, the Indian Subcontinent, and eastern China. However, the evaluation of vulnerability reflected by six factors exhibited a weak difference between countries. Most countries in DPEA displayed moderate vulnerability, except Russia and Saudi Arabia with a low vulnerability to drought. Therefore, the resulting assessment of drought risk is low for the low-exposure and low-hazard countries or sub-regions, such as Russia, Kazakhstan, western China and Southeast Asia. Although both high drought hazard and population density simultaneously appear in eastern China, the rapid development of the economy has relieved the impact of drought on Chinese citizens. The hazard and risk of meteorological drought were particularly low in Russia during the study period, especially in its Asian part, mostly due to the low exposure and vulnerability. Nevertheless, in regions with extensive agriculture and dense populations, such as southern and southwestern Asia, the high drought risk therein can be attributed mainly to the enhanced drought hazard and exposure.
The drought risk datasets produced by this study still need to be improved in some aspects. One limitation is the time span of the datasets, with the drought events data covering from the beginning of the 1950s to recent years, and the drought risk data only from the year 2000. The extension of the data to drought events in the early 20th century through the inclusion of more historical data is meaningful for studies of climatic dynamics and attribution. Extended social and economic data might also help us to understand the long-term variation of drought risk. Besides, as a primary study, the drought risk analysis here is only based on the national scale. Moreover, the risk assessment in this study does not involve the development of drought policy, climate change, and the variability of exposure and vulnerability indicators. If these more detailed features are considered in the risk assessment, the estimated risk should be a closer approximation of the real situation. Additionally, as mentioned at the end of Section 2.4.2, high-resolution gridded socio-economic data will significantly improve the reliability of the drought risk assessment in the future. In short, more high-resolution and gridded data, as well as a greater inclusion of realistic socio-economic data and physical mechanistic insight, should significantly improve the prospects for drought risk assessment in the future.
Acknowledgments
The authors thank the anonymous reviewers for their constructive and helpful suggestions on the manuscript.
Data availability statement
The datasets of drought events and risks that support the findings of this study are openly available in the Matlab format and in Science Data Bank at http://www.dx.doi.10.11922/sciencedb.898.
Disclosure statement
No potential conflict of interest was reported by the authors.
Additional information
Funding
References
- Adnan, S., Ullah, K., & Shouting, G. (2016). Investigations into precipitation and drought climatologies in South Central Asia with special focus on Pakistan over the period 1951–2010. Journal of Climate, 29, 6019–6035.
- Allen, R. G., Pereira, L. S., Rase, D., & Smith, M. (1998). Crop evapotranspiration: Guidelines for computing crop water requirements. FAO irrigation and drainage Paper 56. Rome.
- Allen, R. G., Smith, M., Perrier, A., & Pereira, L. S. (1994). An update for the definition of reference evapotranspiration. ICID Bulletin, 43(2), 1–34.
- Alvalá, R. C. S., Cunha, A. P. M. A., Brito, S. S. B., Seluchi, M. E., Marengo, J. A., Moraes, O. L. L., & Carvalho, M. A. (2019). Drought monitoring in the Brazilian semiarid region. Annals of the Brazilian Academy of Sciences, 91(Suppl. 1), e20170209.
- Andreadis, K. M., Clark, E. A., Wood, A. W., Hamlet, A. F., & Lettenmaier, D. P. (2005). Twentieth-Century drought in the conterminous United States. Journal of Hydrometeorology, 6, 985–1001.
- Andreadis, K. M., & Lettenmaier, D. P. (2006). Trends in 20th century drought over the continental United States. Geophysical Research Letters, 33, L10403.
- Barlow, M., Zaitchik, B., Paz, S., Black, E., Evans, J., & Hoell, A. (2016). A review of drought in the Middle East and Southwest Asia. Journal of Climate, 29, 8547–8574.
- Barriopedro, D., Gouveia, C. M., Trigo, R. M., & Wang, L. (2012). The 2009/10 drought in China: Possible causes and impacts on vegetation. Journal of Hydrometeorology, 13, 1251–1267.
- Beguería, S., Vicente-Serrano, S. M., Reig, F., & Latorre, B. (2014). Standardized precipitation evapotranspiration index (SPEI) revisited: Parameter fitting, evapotranspiration models, tools, datasets and drought monitoring. International Journal of Climatology, 34, 3001–3023.
- Blauhut, V., Gudmundsson, L., & Stahl, K. (2015). Towards pan-European drought risk maps: Quantifying the link between drought indices and reported drought impacts. Environmental Research Letters, 10, 014008.
- Blauhut, V., Stahl, K., Stagge, J. M., Tallaksen, L. M., De Stefano, L., & Vogt, J. (2016). Estimating drought risk across Europe from reported drought impacts, drought indices, and vulnerability factors. Hydrology and Earth System Sciences, 20, 2779–2800.
- Carrão, H., Naumann, G., & Barbosa, P. (2016). Mapping global patterns of drought risk: An empirical framework based on sub-national estimates of hazard, exposure and vulnerability. Global Environmental Change, 39, 108–124.
- Center for International Earth Science Information Network (CIESIN), Columbia University. (2018). Documentation for the gridded population of the world, version 4 (GPWv4), revision 11 data sets. Palisades NY: NASA Socioeconomic Data and Applications Center (SEDAC). doi:10.7927/H45Q4T5F
- Chen, H., & Sun, J. (2015). Changes in drought characteristics over China using the standardized precipitation evapotranspiration index. Journal of Climate, 28, 5430–5447.
- Cook, B. I., Smerdon, J. E., Seagar, R., & Coats, S. (2014). Global warming and 21st century drying. Climate Dynamics, 43, 2607–2627.
- Cook, E. R., Anchukaitis, K. J., Buckley, B. M., D’Arrigo, R. D., Jacoby, G. C., & Wright, W. E. (2010). Asian monsoon failure and megadrought during the last millennium. Science, 328, 486–489.
- Dai, A. (2011). Characteristics and trends in various forms of the Palmer Drought Severity Index during 1900–2008. Journal of Geophysical Research, 116, D12115.
- Dai, A. (2012). Increasing drought under global warming in observations and models. Nature Climate Change, 3, 52–58.
- Dai, A., Trenberth, K. E., & Qian, T. (2004). A global dataset of Palmer drought severity index for 1870–2002: Relationship with soil moisture and effects of surface warming. Journal of Climate, 5, 1117–1130.
- Diffenbaugh, N. S., Giorgi, F., Raymond, L., & Bi, X. (2007). Indicators of 21st century socioclimatic exposure. Proceedings of the National Academy of Sciences, 104(51), 20195–20198.
- Easterling, D. R., Wallis, T. W. R., Lawrimore, J. H., & Heim, R. R., Jr. (2007). Effects of temperature and precipitation trends on U.S. drought. Geophysical Research Letters, 34, L20709.
- Folland, C., & Anderson, C. (2002). Notes and correspondence: Estimating changing extremes using empirical ranking method. Journal of Climate, 15, 2954–2960.
- Giorgi, F., & Francisco, R. (2000). Uncertainties in regional climate change prediction: A regional analysis of ensemble simulations with the HADCM2 coupled AOGCM. Climate Dynamics, 16, 169–182.
- Guo, H., Bao, A., Liu, T., Jiapaer, G., Ndayisaba, F., Jiang, L., … De Maeyer, P. (2018). Spatial and temporal characteristics of droughts in Central Asia during 1966–2015. Science of the Total Environment, 624, 1523–1538.
- Guzmán, J. M., Martine, G., McGranahan, G., Schensul, D., & Tacoli, C. (2009). Population dynamics and climate. New York, NY: Internal Institute for Environment and Development. UNFPA.
- Halwatura, D., McIntyre, N., Lechner, A. M., & Arnold, S. (2017). Capability of meteorological drought indices for detecting soil moisture droughts. Journal of Hydrology: Regional Studies, 12, 396–412.
- Hayes, M. J., Wilhelmi, O. V., & Knutson, C. L. (2004). Reducing drought risk: Bridging theory and practice. Natural Hazards Review, 5, 106–113.
- Huang, J., Li, Y., Fu, C.,Chen, F., Fu, Q., Dai, A. … Wang, G. (2017). Dryland climate change: Recent progress and challenges. Reviews of Geophysics, 55, 719–778.
- Kingston, D. G., Stagge, J. H., Tallaksen, L. M., & Hannah, D. M. (2015). European-scale drought: Understanding connections between atmospheric circulation and meteorological drought indices. Journal of Climate, 28, 505–516.
- Li, Z., Chen, Y., Fang, G., & Li, Y. (2017). Multivariate assessment and attribution of droughts in Central Asia. Scientific Reports, 7(1316), 1–12.
- Lloyd-Hughes, B., & Saunders, M. A. (2002). A drought climatology for Europe. International Journal of Climatology, 22, 1571–1592.
- Lutgens, F. K., & Tarbuck, E. J. (2007). The atmosphere (10th ed., pp. 520). Upper Saddle River, NJ: Prentice-Hall.
- McKee, T. B., Doesken, N. J., & Kleist, J. (1993). The relationship of drought frequency and duration to time scales. Eighth conference on applied climatology (pp. 179–184). Anaheim, California, Southwest Climate Change Network.
- Mishra, A., & Singh, V. P. (2010). A review of drought concepts. Journal of Hydrology, 391, 202–216.
- Mishra, A. K., & Liu, S. C. (2014). Changes in precipitation pattern and risk of drought over India in the context of global warming. Journal of Geophysical Research: Atmosphere, 119, 7833–7841.
- Naumann, G., Barbosa, P., Garrote, L., Iglesias, A., & Vogt, J. (2014). Exploring drought vulnerability in Africa: An indicator based analysis to be used in early warning systems. Hydrology and Earth System Sciences, 18, 1591–1604.
- Neri, C., & Magaña, V. (2016). Estimation of vulnerability and risk to meteorological drought in Mexico. Water Climate, and Society, 8, 95–110.
- Osborn, T., Barichivich, J., Harris, I., van der Schrier, G., & Jones, P. D. (2017). Monitoring global drought using the self-calibrating Palmer Drought Severity Index [in “State of the Climate in 2016”]. Bulletin of the American Meteorological Society, 98, S32–S33.
- Osborn, T. J., Barichivich, J., Harris, I., van der Schrier, G., & Jones, P. D. (2016). Monitoring global drought using the self-calibrating Palmer Drought Severity Index [in “State of the Climate in 2015”]. Bulletin of the American Meteorological Society, 97, S32–S36.
- Palmer, W. C. (1965). Meteorological drought. U.S. Weather Bureau Research Paper, 45, 58.
- Raziei, T., Saghafian, B., Paulo, A. A., Pereira, L. S., & Bordi, I. (2009). Spatial patterns and temporal variability of drought in Western Iran. Water Resources Management, 23, 439–455.
- Russo, S., Dosio, A., Sterl, A., Barbosa, P., & Vogt, J. (2013). Projection of occurrence of extreme dry-wet years and seasons in Europe with stationary and nonstationary standardized precipitation indices. Journal of Geophysical Research: Atmosphere, 118, 7628–7639.
- Russo, S., Sillmann, J., Sippel, S., Barcikowska, M. J., Ghisetti, C., Smid, M., & O’Neill, B. (2019). Half a degree and rapid socioeconomic development matter for heatwave risk. Nature Communications, 10, 136.
- Schneider, U., Becker, A., Finger, P., Meyer-Christoffer, A., Rudolf, B., & Ziese, M. (2015). GPCC full data monthly product version 7.0 at 1.0°: Monthly land-surface precipitation from rain-gauges built on GTS-based and historic data. doi:10.5676/DWD_GPCC/FD_M_V7_100
- Shahid, S., & Behrawan, H. (2008). Drought risk assessment in the western part of Bangladesh. Natural Hazards, 46, 391–413.
- Sheffield, J., Andreadis, K. M., Wood, E. F., & Lettenmaier, D. P. (2009). Global and continental drought in the second half of the twentieth century: Severity-area-duration analysis and temporal variability of large-scale events. Journal of Climate, 22, 1962–1981.
- Sheffield, J., & Wood, E. F. (2008). Projected changes in drought occurrence under future global warming from multi-model, multi-scenario, IPCC AR4 simulations. Climate Dynamics, 31, 79–105.
- Sheffield, J., Wood, E. F., & Roderick, M. L. (2012). Little change in global drought over the past 60 years. Nature, 491(7424), 435–438.
- Shi, Y., Shen, Y., Kang, E., Li, D., Ding, Y., Zhang, G., & Hu, R. (2007). Recent and future change in Northwest China. Climatic Change, 80, 379–393.
- Spinoni, J., Naumann, G., Carrao, H., Barbosa, P., & Vogt, J. (2014). World drought frequency, duration, and severity for 1951–2010. International Journal of Climatology, 34, 2792–2804.
- Spinoni, J., Naumann, G., & Vogt, J. (2017). Pan-European seasonal trends and recent changes of drought frequency and severity. Global and Planetary Change, 148, 113–130.
- Spinoni, J., Naumann, G., Vogt, J., & Barbosa, P. (2015). European drought climatologies and trends based on a multi-indicator approach. Global and Planetary Change, 127, 50–57.
- Stagge, J. H., Kingston, D. G., Tallaksen, L. M., & Hannah, D. M. (2017). Observed drought indices show increasing divergence across Europe. Scientific Reports, 7(14045), 1–10.
- Szalai, S., Szinell, C., & Zoboki, J. (2000). Drought monitoring in Hungary. In Early warning systems for drought preparedness and drought management (pp. 161–176). Geneva, Switzerland: World Meteorological Organization.
- van der Schrier, G., Barichivich, J., Briffa, K. R., & Jones, P. D. (2013). A scPDSI-based global data set of dry and wet spells for 1901–2009. Journal of Geophysical Research: Atmospheres, 118, 4025–4048.
- van der Schrier, G., Jones, P. D., & Briffa, K. R. (2011). The sensitivity of the PDSI to the Thornthwaite and Penman-Monteith parameterizations for potential evapotranspiration. Journal of Geophysical Research, 116, D03106.
- Vicente-Serrano, Van der Schrier, G., Beguería, S., & Azorin-Molina, C. (2015). Contribution of precipitation and reference evapotranspiration to drought indices under different climates. Jounral of Hydrology, 526, 42–54.
- Vicente-Serrano, S. M., Beguería, S., & López-Moreno, J. I. (2010a). A multiscalar drought index sensitive to global warming: The standardized precipitation evapotranspiration index. Journal of Climate, 23, 1696–1718.
- Vicente-Serrano, S. M., Beguería, S., López-Moreno, J. I., Angulo, M., & El Kenawy, A. (2010b). A new global 0.5 gridded dataset (1901–2006) of a multiscalar drought index: Comparison with current drought index datasets based on the Palmer Drought Severity Index. Journal of Hydrometeorology, 11, 1033–1043.
- Wells, N., Goddard, S., & Hayes, M. J. (2004). A self-calibrating palmer drought severity index. Journal of Climate, 17, 2335–2351.
- Wilhite, D. A., & Glantz, M. H. (1985). Understanding the drought phenomenon: The role of definitions. Water International, 10, 111–120.
- World Meteorological Organization (WMO). 2012. Standardized precipitation index user guide (Svoboda, M., Hayes, M., Wood, D.) (WMO-No. 1090). Geneva, Switzerland: World Meteorological Organization.
- Wu, S., Liu, L., Liu, Y., Gao, J., Dai, E., Feng, A., & Wang, W. (2019). The belt and road: Geographical pattern and regional risks. Journal of Geographical Sciences, 29(4), 483–495.
- Yu, M., Li, Q., Hayes, M., Svoboda, M. D., & Heim, R. R. (2014). Are droughts becoming more frequent or severe in China based on the Standardized Precipitation Evapotranspiration Index: 1951–2010? International of Journal of Climatology, 34, 545–558.
- Zhang, B., Zhao, X., Jin, J., & Wu, P. (2015). Development and evaluation of a physically based multiscalar drought index: The standardized moisture anomaly index. Journal of Geophysical Research, [Atmospheres], 120, 11575–11588.
- Zhang, X., Wang, L., & Chen, D. (2019). How does temporal trend of reference evapotranspiration over the Tibetan Plateau change with elevation? International of Journal of Climatology, 39, 2295–2305.