
 ?Mathematical formulae have been encoded as MathML and are displayed in this HTML version using MathJax in order to improve their display. Uncheck the box to turn MathJax off. This feature requires Javascript. Click on a formula to zoom.
ABSTRACT
Changes in the frequency and intensity of extreme events affect the risk pattern of risk-bearing bodies and the effectiveness of response measures. Based on future climate scenario data, in this study, we identify global warming periods of 1.5°C and 2°C above pre-industrial levels, and the temporal and spatial patterns of temperature and precipitation in China during the same period, propose a methodology for risk assessment and integrated analysis of extreme events, build a database of extreme events and their hazards in China in the context of climate change, and assess the hazards caused by extreme events (i.e., heatwaves, floods, and droughts) in China under different warming periods. Under the RCP4.5 and RCP8.5 scenarios, global temperatures increase by 1.5°C and 2°C above pre-industrial levels by 2029 and 2026 and by 2050 and 2040, respectively. The warming would be fast in the north and slow in the south, the warming of the Qinghai-Tibet Plateau would accelerate, and the precipitation would increase in the north and decrease in the south, but the trend of the precipitation reduction in the south would be more significant under the RCP8.5 scenario. For 2°C of warming, the hazard index of severe heatwaves in the North China Plain, parts of South China, and the western part of Inner Mongolia would double that of 1.5°C warming. Regional differences in extreme precipitation would increase, especially under the RCP8.5 scenario, the hazard index of severe floods in parts of East China would be about twice that of 1.5°C warming. Under the joint influence of rising temperature and changing precipitation, the drought situation would be alleviated under the RCP4.5 scenario, but it is intensified under the RCP8.5 scenario. For 2°C of warming, the hazard index of severe droughts in some areas would reach three times that of 1.5°C warming. For the integrated hazard of the three types of extreme events, the areas of high and medium hazards would expand, while the areas of low hazard would decrease. For 2°C of warming, the areas of high and medium hazards would be more than half the total area.
1. Introduction
Due to its contribution to continuous global warming, precipitation changes, aggravated glacial melting, imbalanced hydrology and water resources, and frequent extreme weather and climate events (Qin, Citation2015), climate change has severe impacts on human and natural systems worldwide (IPCC, Citation2014; Milly, Wetherald, Dunne, & Delworth, Citation2002; Scholze, Knorr, Arnell, & Prentice, Citation2006). Therefore, the impacts of and responses to climate change are recognized as a shared concern of the scientific community, policy makers, and the general public. The Special Report on Managing the Risks of Extreme Events and Disasters to Advance Climate Change Adaptation (SREX) points out that the changes in the frequency and intensity of extreme events are affecting the spatial-temporal pattern of disaster risks and risk-bearing bodies (IPCC, Citation2012). To mitigate the risks and impacts of climate change, and to enhance the global response to the threat of climate change, the Paris Agreement proposes targets for global warming of 2°C and 1.5°C (UNFCCC, Citation2015). The Intergovernmental Panel on Climate Change (IPCC) 1.5°C special report argues that global warming of 1.5°C can effectively decrease the risk of climate change and can also prevent the occurrence of irreversible risks and losses (IPCC, Citation2018). The Sustainable Development Goals (SDGs) include climate actions (UN, Citation2015). Repeatedly reaffirming the need to carry out efficacious adapting and mitigating measures to achieve the ultimate goal, the United Nations Framework Convention on Climate Change (UNFCCC) states that “Stabilization of greenhouse gas concentrations in the atmosphere at a level that would prevent dangerous anthropogenic interference with the climate system. Such a level should be achieved within a time frame sufficient to allow ecosystems to adapt naturally to climate change, to ensure that food production is not threatened and to enable economic development to proceed in a sustainable manner” (Griggs et al., Citation2013; UNFCCC, Citation1992).
Future extreme events induced by climate change would tend to be more frequent and intensified, which would trigger greater human impacts and disaster losses (IPCC, Citation2012). As the global average temperature rises, extreme warming events will increase in most continental regions, and heatwaves will occur more frequently and last longer (Meehl & Tebaldi, Citation2004; Shi, Jiang, Chen, & Li, Citation2018). Under the RCP8.5 scenario, the probability of extreme events for global warming of 2°C will be double that for global warming of 1.5°C and 5 times that for the current climate (Fischer & Knutti, Citation2015). Even under the moderate emission scenario (RCP4.5), over the next two decades, half of the summers in eastern China will be hotter than the summer of 2013 (Sun et al., Citation2014). The response of the global water cycle to global warming this century has been uneven, with the duration and impact of floods in most regions increasing with global warming (Betts et al., Citation2018; Donnelly et al., Citation2017), so the intensity and frequency of floods are likely to increase (Oki & Kanae, Citation2006; Wang et al., Citation2017). In China, the areas with high risk of floods are mainly concentrated in the southeast where the frequency of extreme floods similar to that of the summer of 2010 will double and triple when the global temperature rises by 1.5°C and 2°C, respectively (Li, Wu, Dai, & Xu, Citation2012; Lin et al., Citation2018; Xu et al., Citation2014). Due to a decrease in precipitation or an increase in evaporation, severe and widespread droughts will occur in many continental regions in this century (Dai, Citation2013; Trenberth et al., Citation2014; Van Loon et al., Citation2016), especially in the arid and semi-arid regions of the middle latitudes and subtropical zones (Polade, Pierce, Cayan, Gershunov, & Dettinger, Citation2014). Studies have found that the duration, intensity, and impact of droughts in most regions will be reduced for a global temperature increase of 1.5°C compared with that for 2°C (Liu et al., Citation2018).
Previous studies have mainly focused on the frequency of single extreme events and changes in high risk areas in a certain region (King, Karoly, & Henley, Citation2017; Lin et al., Citation2018; Su et al., Citation2018), lacking comprehensive and integrated analyses of different extreme events. In the future, extreme events are considered to be characterized by greater frequencies and intensities, chain reactions, multiple disasters, and concurrency. Therefore, it is necessary to incorporate extreme event risks research into the regional framework, to achieve regional integration of the different elements, and to conduct a quantitative horizontal comparison of the different extreme events. Based on future climate scenario data, this study calculates the years when global temperature increases by 1.5°C and 2°C, determines the response pattern of temperature and precipitation in China, establishes methodologies for extreme event risk assessment and integrated analysis, and evaluates the hazards of extreme events, i.e., heatwaves, floods, and droughts, with a view to providing scientific and technological support for effective risk management and prevention and enhancing our ability to cope with climate change.
2. Data sources and analysis methods
2.1. Data sources
The monthly climate scenario data used in this study were obtained from the multi-model data sets output by the simulation of 29 Global Climate Models (GCMs) of the Coupled Model Inter-Comparison Project Phase 5 (CMIP5) under the Representative Concentration Pathways (RCPs) scenario (Van Vuuren et al., Citation2011; Taylor, Stouffer, & Meehl, Citation2012; Supplementary Table 1). The time span is from the middle of the nineteenth century to the end of the twenty-first century. The RCP4.5 and RCP8.5 scenarios were chosen to separately represent the greenhouse gas emission limitation scenario and the highest level of greenhouse gas emission scenario (Moss et al., Citation2010; Thomson et al., Citation2011). The data sets were used to calculate the annual mean surface air temperature across the world and in China and to determine the years in which the different warming periods occur.
Table 1. Classification standard of extreme events hazards.
Daily climate scenario data were taken from the daily data sets with a spatial resolution of 0.5° × 0.5° output by the downscaling simulation of five GCMs (HadGEM2-ES, IPSL-CM5A-LR, GFDL-ESM2 M, MIROC-ESMCHEM, and NorESM1-M) within the framework of the Inter-Sectoral Impact Model Inter-Comparison Project (ISI-MIP) (Warszawski et al., Citation2014; Supplementary Table 1). The daily variables used in this study were rainfall rate, snowfall rate, relative humidity, shortwave downwelling radiation, surface air temperature, maximum surface air temperature, minimum surface air temperature, and near surface wind. The time span is from 1950 to 2099. The data were bias-corrected based on the Water and Global Change (WATCH) forced data (WFD) for 1960 to 1999 (Hempel, Frieler, Warszawski, Schewe, & Piontek, Citation2013; Weedon et al., Citation2011). The results provide a good range of climate change and simulation outcomes of other models (Huang, Yu, Dai, Wei, & Kang, Citation2017), which were mainly applied to compute the indexes of the extreme events and the hazard grades of these events.
The series of global mean annual temperatures was obtained from the HadCRUT4 data set, which was jointly developed by the Climatic Research Unit and Hadley Centre (Morice, Kennedy, Rayner, & Jones, Citation2012). The series of mean annual temperatures in China was calculated by Tang et al. (Citation2009). These data were used to test ability of the model to simulate the global climate and the regional climate in China.
2.2. Methods
2.2.1. Calculations of warming periods of 1.5°C and 2°C global warming
Based on the different starting times of the models, 1861–1890 was selected as the reference period. The year when the 5-year moving average first exceeded the warming target was selected as the year of warming appearance; and 30 years (the year plus the past 29 years) was set as the warming period (Steffen et al., Citation2018). The outcomes of the model simulations were uniformly interpolated onto a 2.5° × 2.5° grid, and the ensemble mean was calculated using the latitude-longitude grid area weighted average method (Jones & Hulme, Citation1996; Zhou & Yu, Citation2006) and the following equation:
where is the regional annual mean of element
;
is the latitude and longitude of the center grid points;
is the number of grids; and
is the value of an environmental element in grid
.
At present, there is a certain degree of uncertainty in the simulation results of the GCMs. The uncertainty may be amplified during the process of downscaling to the regional scale, which may lead to a large deviation in the simulation of the regional climate. The deviation can be decreased using the Δ interpolation method (Hay, Wilby, & Leavesley, Citation2000) and the following equation:
where is the estimated future climate scenario series;
is the measured series of the base period;
is the multi-year average of the future series simulated by the climate models; and
is the multi-year average of the reference period series simulated by the climate models. In this study, the Δ interpolation method was used to calculate the spatial distributions of temperature and precipitation in China during different warming periods and to analyze the spatial-temporal pattern of climate in China under the influence of climate change.
2.2.2. Hazard of extreme events
The hazard of extreme events mainly represents the probability of the occurrence of extreme events. This study focuses on heatwaves, floods, and droughts, which are widely distributed and susceptible to climate change. Based on the comprehensive meteorological drought index (CI, GB/T20481-2006, which can reflect precipitation anomalies on different time scales and water deficits on shorter time scales), the heatwave index (HI, GB/T29457-2012, which can comprehensively characterize the degree of heat and the cumulative effect of the heatwave process), and the flood index (FI, which is based on the number of maximum 3-day precipitation events and is corrected using the underlying surface correction parameters), the spatial pattern of the hazards of these extreme events in different warming periods was quantitatively evaluated with 1961–1990 as the reference period.
The specific algorithm is as follows. According to the index values, the extreme events are divided into three levels: mild, moderate, and severe, which indicate the level and impact of the extreme events ().
Calculate the numbers of occurrences of extreme events at different levels, and then, obtain the frequency of the occurrence of extreme events at different levels. Based on the frequency during the study period, the hazards of the extreme events were characterized using the following equation:
where is the frequency of the extreme events, set to 1 if the frequency is greater than 100%, i.e.,
≥ T;
is the numbers of extreme events; i is the level of the extreme event; and T is the warming period.
2.2.3. Integrated analysis of the hazard of extreme events
The hazard level of extreme events was determined using the multiple of the standard deviation method and the following equation:
where α is the multiple of the standard deviation; and is the standard deviation of each grid value, i.e.,
where is the value of each grid; and
is the average of the grid values.
Finally, the integrated hazard of the extreme events was obtained using the superposition analysis method and was graded using the multiple of the standard deviation method. For the classification standard, a high hazard is defined as having an α of greater than half the standard deviation, a low hazard is defined as having an α of less than half the standard deviation, and a moderate hazard is defined as an integrated hazard between the low and high hazards (Wu et al., Citation2017).
3. Results
Based on the above data sources and research methods, the years when the global warming targets were reached were clarified separately; the temperature and precipitation characteristics of the different warming periods in China were quantified; and the hazards and integrated hazards of the extreme events, i.e., heatwaves, floods, and droughts, in the different warming periods were assessed. The results of this study provide a basis for subsequent integrated climate change risk assessment and adaptation research in China under different warming periods.
3.1. The years in which the different global warming targets were reached
Based on the latitude and longitude grid area weighted average method, we found that the 29 GCMs of the CMIP5 simulated the trend in the global and China mean annual temperatures over the past 150 years well. Before the 1950s, the gap between the model simulation results and the observation data was large, while after the 1950s, the consistency between the model simulation results and the observation data improved significantly. At the global and China regional scales, the correlation coefficients between the model simulation results and the observation sequences were between 0.60–0.87 and 0.25–0.55, respectively. The correlation coefficients of the multi-model ensemble mean and the observation series were 0.89 and 0.65, respectively, which are higher than that for any single model. This result is basically consistent with the results of previous studies (Zhang et al., Citation2013).
Figure 1. Sequence of the mean annual temperature anomalies for the (a) global and (b) China regional scales from 1850 to 2100 relative to 1861–1890.
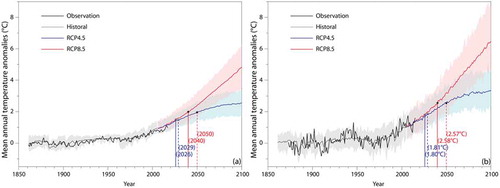
In the future, the global and China regional temperatures would continue to rise, but there would be large differences between the different scenarios. Under the RCP4.5 scenario, the multi-model ensemble mean result reveals that the global mean annual temperature would initially gradually increase, and then become stable during the last 30 years of the twenty-first century. The differences between the models would gradually increase over time. The magnitude of the temperature increase at the end-of-the-century (the average temperature of the last 10 years of the century relative to the temperature before the Industrial Revolution) would be about 2.55°C, indicating the possibility that the global mean annual temperature increase would exceed 2°C, but would not exceed 3°C at the end of the century under the RCP4.5 scenario. The regional mean annual temperature in China would initially increases, and then, it would stabilize, exhibiting a greater temperature increase and interannual variability than the global average under the RCP4.5 scenario. At the end of the century, the increase in temperature might exceed 3°C and reach about 3.28°C. Under the RCP8.5 scenario, the multi-model ensemble mean result would exhibit a continuous increase in the global mean annual temperature at a faster rate than that under the RCP4.5 scenario. The temperature at the end of the century would increase by approximately 4.61°C. The regional mean annual temperature in China would continue to increase faster than the global average, and the temperature at the end of the century might exceed 6°C and reach 6.17°C under the RCP8.5 scenario.
Based on the 29 GCMs of the CMIP5, we calculated the year when the multi-model ensemble global mean annual temperature initially exceeded 1.5°C or 2°C relative to 1861–1890 (). The results show that for the same warming target, the temperature is reached earlier under the RCP8.5 scenario than under the RCP4.5 scenario, and the gap gradually increases with increasing temperature. Specifically, under the RCP4.5 scenario, the regional mean annual temperature in China would increase by 1.5°C by 2021; whereas the global mean annual temperature rise would increase by 1.5°C by 2029; while by 2029, the regional mean annual temperature in China would reach about 1.8°C. The regional mean annual temperature in China would increase by 2°C by 2036; whereas the global mean annual temperature would reach the target in 2050, by which time the regional mean annual temperature in China would reach about 2.5°C. Under the RCP8.5 scenario, the regional mean annual temperature in China would increase by 1.5°C by 2019, and the global mean annual temperature would reach this target by 2026, by which time the regional mean annual temperature in China would reach approximately 1.8°C. The regional mean annual temperature in China would increase by 2°C by 2031 and the global mean annual temperature would reach this target by 2040, by which time the regional mean annual temperature in China would exceed 2.5°C. These results are basically consistent with the previous conclusions obtained using different quantitative models (Karmalkar & Bradley, Citation2017; Nikulin et al., Citation2018; Su et al., Citation2018).
3.2. Characteristics of temperature and precipitation in different warming periods in China
Temperature is tightly correlated with the occurrence of extreme events such as droughts and heatwaves. Using the bias-corrected daily output results, the spatial distribution pattern of the annual mean temperature in China was calculated relative to 1961–1990, during which the global mean annual temperature increases by 1.5°C and 2°C. The results show that during the same warming period, the spatial distribution patterns of the multi-model ensemble mean annual temperature in China under the RCP4.5 and RCP8.5 scenarios would be basically the same, that is, the increase in temperature would be fast in the northern regions, slow in the southern regions, and constantly accelerate on the Qinghai-Tibet Plateau.
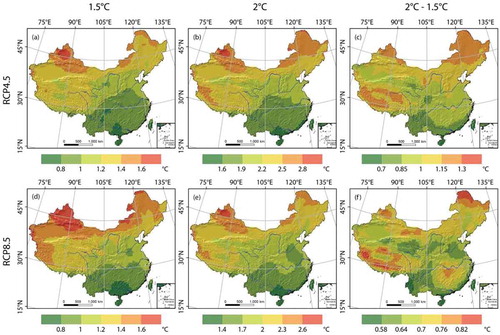
Specifically, under a global warming of 1.5°C, the mean annual temperature in China would increase by more than 1.2°C relative to 1961–1990. Under the RCP4.5 scenario, the regions with large warming ranges would be distributed in Northwest China, Northeast China, and on the Qinghai-Tibet Plateau, with the maximum warming range exceeding 1.6°C. The Yellow River Basin and its southern areas would experience a slow warming trend, with a minimum warming range of less than 0.8°C ()). Under the RCP8.5 scenario, the area of the regions with large warming ranges would be significantly larger than that under the RCP4.5 scenario. The warming ranges of the Tianshan Mountains and the area to the north, the northern and central parts of Inner Mongolia, and the northern part of Northeast China would exceed 1.6°C. The regions with warming ranges of less than 1°C would become narrower to the south of the Yangtze River ()). For global warming of 2°C, under the RCP4.5 scenario, the mean annual temperature in China would increase by more than 2.2°C relative to 1961–1990, and the distribution pattern would be similar to that for global warming of 1.5°C ()). Under the RCP8.5 scenario, the spatial pattern of warming would be similar to that under the RCP4.5 scenario, but the warming range of the Huaihe River Basin would be relatively small ()). Compared with global warming of 1.5°C, the warming range would be higher on the Qinghai-Tibet Plateau, in Northeast China, the northern part of Northwest China, and North China under global warming of 2°C. The warming ranges of the central and southern regions of Central China would be also larger than the national average under the RCP8.5 scenario (,f)). For different warming thresholds, the rate of warming in China would be significantly faster than the global average, exhibiting a spatial distribution pattern of fast in the north and slow in the south, which is basically consistent with the conclusion that global warming accelerates with increasing latitude (Post, Steinman, & Mann, Citation2018). For a fast warming trend and less precipitation, the frequency of extreme events, such as droughts and heatwaves, in the northern region might increase, which would have negative impacts on the socio-economic, ecological systems and food production.
Figure 2. Spatial patterns of the warming ranges in China for 1.5°C and 2°C of global warming.
The occurrence of extreme hydrological events is mainly subject to changes in the intensity and frequency of precipitation (Trenberth, Citation2011). Over the past 50 years, the percentage of the mean annual precipitation anomalies in China has continued to decrease, and the entire country has been prone to drought. In the future, the percentage of mean annual precipitation anomalies in China would continue to increase, with only slight differences between the scenarios. The growth rate would be slightly faster under the RCP4.5 scenario in the first half of the twenty-first century, and under the RCP8.5 scenario in the second half. At the end of the century, the percentages of the mean annual precipitation anomalies would increase by 6.9% and 7.8% relative to 1961–1990 under the RCP4.5 and RCP8.5 scenarios, respectively. For global warming of 1.5°C, the mean annual precipitation in China would decrease slightly relative to 1961–1990; while for global warming of 2°C, the mean annual precipitation would increase slightly.
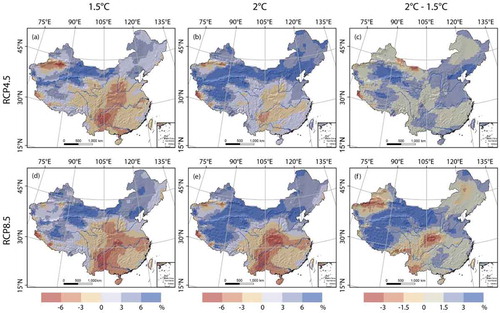
Based on the spatial distribution pattern of the percentage of the mean annual precipitation anomalies in China relative to 1961–1990 (), the spatial distribution pattern would be basically the same for different warming periods. The precipitation in the northern regions, which have a fast warming trend, would generally increase, suggesting a trend towards warm and wet. The precipitation in the southern regions, which have a slow warming trend, would generally decrease, suggesting a trend towards warm and dry. Specifically, for global warming of 1.5°C, the annual precipitation would increase on the Qinghai-Tibet Plateau, in most of the Northwest China, Northeast China, and North China, of which the annual precipitation on the northern Qinghai-Tibet Plateau, in the central part of Northwest China and in the eastern part of North China would increase by more than 6%. The annual precipitation would decrease in the Yellow River Basin, and the Yangtze River Basin and the regions to the south, especially in Southwest China where the annual precipitation would decrease by over 6%. Under the RCP8.5 scenario, the increase and decrease ranges of the annual precipitation would be larger than that under the RCP4.5 scenario ()). For global warming of 2°C under the RCP4.5 scenario, the range covered by the increase in the annual precipitation would expand, and the annual precipitation along 40°N would increase by more than 6%. The regions with decreased annual precipitation would shrink to the Tianshan Mountains, the western edge of the Qinghai-Tibet Plateau, the Qinling Mountains, and the Yangtze River Basin, which mostly decreases of less than 3% ()). Under the RCP8.5 scenario, the range of increasing precipitation would be basically the same as that for 1.5°C of global warming, but with a larger range of increase. The precipitation in the central and western parts of the Qinghai-Tibet Plateau and Northwest China would increase by more than 6%. The range of the decrease in precipitation would be basically unchanged, with a larger range of decrease. The precipitation in the Qinling Mountains and Southwest China would reduce by more than 6% ()). Compared with global warming of 1.5°C, for global warming of 2°C, the national mean annual precipitation would increase, with only small decreasing regions on the western edge under the RCP4.5 scenario. Under the RCP8.5 scenario, the mean annual precipitation in the Tianshan Mountains, the Qinling Mountains, Southwest China, and the central part of Northeast China would decrease. The mean annual precipitation in other regions would increase, of which the mean annual precipitation would increase by more than 3% on the central and western parts of the Qinghai-Tibet Plateau and Northwest China (). In the future, precipitation in China would continue to increase with increasing temperature, the variability in the precipitation would increase, and extreme precipitation events might occur more frequently, which may lead to more severe floods and geological disasters, which could seriously hinder social and economic development.
Figure 3. Spatial patterns of the percentage of the mean annual precipitation anomalies in China for 1.5°C and 2°C of global warming.
3.3. Hazards of extreme events in China under different warming periods
In this section, the temporal and spatial variations in the hazards of the extreme events under different warming periods were evaluated based on CI, HI, and FI. Due to the similarity of the temporal and spatial variations in the extreme events under the RCP4.5 and RCP8.5 scenarios, the distribution of the hazards of the extreme events under the RCP4.5 scenario is shown in the supplementary materials.
3.3.1. Heatwaves
For global warming of 1.5°C, severe heatwaves would be mainly distributed in the flat plains and basins, covering an area of about 7 million km2, and would be concentrated in the Tarim Basin, the Junggar Basin, the North China Plain, and Central China. Under the RCP4.5 and RCP8.5 scenarios, the average hazard indexes would be 0.2571 and 0.2828, respectively. Moderate heatwaves would cover more than 95% of the territory, mainly concentrated in the Tarim Basin, the Junggar Basin, the western part of Inner Mongolia, the North China Plain, Central China, East China, and South China, with average hazard indexes of 0.3769 and 0.3898 under the RCP4.5 and RCP8.5 scenarios, respectively. Mild heatwaves would basically spread over the entire country, and key areas would include most regions of the country, except for the Qinghai-Tibet Plateau and the northern mountainous regions. The average hazard indexes would be 0.5646 and 0.5765 under the RCP4.5 and RCP8.5 scenarios, respectively (, -), Supplementary Figure 1a-c).
Table 2. The distribution area (units: million km2) and average hazard indexes of heatwaves for 1.5°C and 2°C of global warming.
For global warming of 2°C, the distribution range of severe heatwaves would expand, and the average hazard index would be significantly increased, especially in the western part of Inner Mongolia, the North China Plain, and Central China. The average hazard index would be about 0.35 under both scenarios. Moderate and mild heatwaves would cover the entire country, with a higher hazard index and more significant under the RCP4.5 scenario (, -), Supplementary Figure 1d-f).
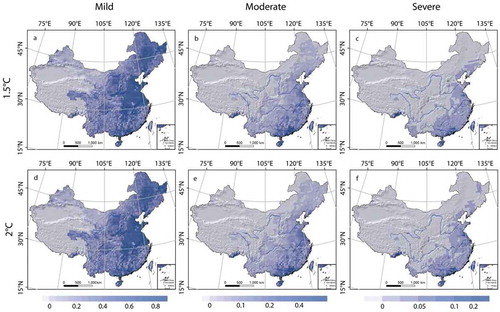
Figure 4. Spatial patterns of the heatwave hazard indexes in China for 1.5°C and 2°C of global warming under the RCP8.5 scenario.
Compared with global warming of 1.5°C, the area and hazard index of severe heatwaves would increase significantly for global warming of 2°C. The hazard index for the North China Plain, parts of South China, and the western part of Inner Mongolia would nearly double, while the hazard index would decrease slightly for the southeastern part of the Qinghai-Tibet Plateau, the western part of Southwest China, and the eastern part of Northeast China. The hazard index of moderate heatwaves would increase significantly for the Northeast Plain and the eastern hilly areas, but decrease slightly for the eastern part of the Qinghai-Tibet Plateau and the eastern part of Northeast China. The hazard index of mild heatwaves would increase significantly across the country, except for the plains and basins (Supplementary Figure 2). For global warming of 2°C, the temperature on the Tibetan Plateau and in the northern region would increase significantly, and the hazard of the heatwaves would increase more significantly. Under the RCP4.5 scenario, the area and hazard index would be larger than those under the RCP8.5 scenario, mainly because of the higher warming range under the RCP4.5 scenario ().
3.3.2. Floods
For global warming of 1.5°C, severe floods would cover more than 20% of the land area, mainly distributed in South China, East China, the southern part of Central China, southern Tibet, and the southern part of Northeast China, with average hazard indexes of 0.0254 and 0.0242 under the RCP4.5 and RCP8.5 scenarios, respectively. The coverage area of moderate floods would be about twice that of severe floods. The moderate floods would be mainly distributed in South China, East China, Central China, southern Tibet, the central and southern parts of North China, the southern part of Northeast China, and Southwest China, with average hazard indexes of 0.0772 and 0.0741 under the RCP4.5 and RCP8.5 scenarios, respectively. Mild floods would cover more than 70% of the land area and would be distributed in most parts of the country, except for the Qinghai-Tibet Plateau and the Tarim Basin. The average hazard indexes would be 0.3636 and 0.3643, respectively, under the RCP4.5 and RCP8.5 scenarios, respectively (, -), Supplementary Figure 3a-c).
Table 3. The distribution area (units: million km2) and average hazard indexes of floods for 1.5°C and 2°C of global warming.
For global warming of 2°C, the distribution area of severe floods would increase, and the pattern would be basically consistent with that of global warming of 1.5°C. Under the RCP4.5 scenario, the distribution area would increase and the average hazard index would decrease slightly, whereas the average hazard index would increase under the RCP8.5 scenario. The distribution area and the average risk index of moderate floods would increase slightly, and the distribution area and average hazard index under the RCP4.5 scenario would be larger than those under the RCP8.5 scenario. The distribution range of mild floods would increase slightly, the average hazard index would decrease slightly, and the distribution pattern would be basically consistent with that of 1.5°C of global warming (, -f), Supplementary Figure 3d-f).
Figure 5. Spatial patterns of flood hazard indexes in China for 1.5°C and 2°C of global warming under the RCP8.5 scenario.
Compared with global warming of 1.5°C, for global warming of 2°C under the RCP4.5 scenario, the hazard index of severe floods would decrease in South China, Central China, and the coastal areas of East China; while it would increase in East China and southern part of Northeast China, and in some regions, it is double that for global warming of 1.5°C. The hazard index of moderate floods would decrease in the southern part of Central China, the Pearl River Basin, the northern part of East China, the central part of Northeast China, the southern part of the Loess Plateau, and the Sichuan Basin, and increase in the coastal areas of South China, East China, the northern part of Central China, the southern part of North China, and Southwest China. The hazard index in the central part of Southwest China, the Qinling Mountains and the Taihang Mountains would double that for global warming of 1.5°C. The hazard index of mild floods would decrease in the Helan Mountains and the northwestern edge of Northwest China, and increase in the northeast edge of Northwest China (Supplementary Figure 4(a-)). Under the RCP4.5 scenario, the precipitation fluctuations in the southern part of the Yangtze River would be relatively small, and the flood hazard index would decrease in some regions. Whereas the precipitation fluctuations in the northern part of the Yangtze River would increase significantly, especially in the eastern region, and the flood hazard index would increase significantly ()). Under the RCP8.5 scenario, the hazard index of severe floods would decrease in the southern part of Central China, the southern part of Southwest China, the southern part of Northeast China, and Taiwan Island; while it would increase in East China and South China, among which the hazard index in the Jianghuai region would be twice that for global warming of 1.5°C. The hazard index of moderate floods would decrease in the southern part of Central China, the southern part of Southwest China, the Qinling Mountains, parts of Northeast China, and North China; and it would increase in the South China, East China, northern part of Central China, and the eastern part of Southwest China. The hazard index of mild floods would decrease in the Helan Mountains, the Tianshan Mountains, and the northeastern part of Inner Mongolia; while it would increase in the northern edge of Northwest China and the source of the Yellow River (Supplementary Figure 4d-f). Under the RCP8.5 scenario, the increase in regional differences, variability, and extreme events in precipitation would result in a significant increase in the scope and risk of severe floods ()).
3.3.3. Droughts
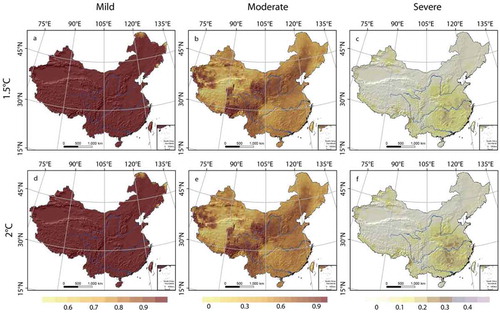
For global warming of 1.5°C, severe drought would occur in most regions, except in the northwestern part of the Qinghai-Tibet Plateau and the western part of the Inner Mongolia Plateau, mainly concentrated in the Middle-Lower Yangtze Plain, the southern part of Central China, and the southeastern part of the Loess Plateau under the RCP4.5 scenario, with a distribution area of more than 7.6 million km2. The average hazard indexes would be 0.0640 and 0.0655 under the RCP4.5 and RCP8.5 scenarios, respectively. Moderate and mild droughts would basically cover the entire country. Moderate droughts would be concentrated in the eastern part of Qinghai-Tibet Plateau, the Loess Plateau, the Northeast Plain, and the western part of the Tarim Basin, with average hazard indexes of 0.5832 and 0.5829 under the RCP4.5 and RCP8.5 scenarios, respectively. Under both scenarios, the average hazard index of mild droughts would be approximately 1, and the regions with an index of less than 1 would be small and occur in the northern edge of Northeast China (, -), Supplementary Figure 5a-c).
Table 4. The distribution area (units: million km2) and average hazard indexes of droughts for 1.5°C and 2°C of global warming.
For global warming of 2°C, the distribution area of severe droughts would increase to 7.72 million km2 under the RCP4.5 scenario, and the average hazard index would decrease. Severe droughts would mainly occur in the southeastern part of the Loess Plateau. Under the RCP8.5 scenario, the distribution area of severe droughts would decrease to 7.37 million km2, and the average hazard index would significantly increase. This is most obvious in the southeastern part of the Loess Plateau and Central China. The average hazard index of moderate droughts would remain basically unchanged under the RCP4.5 scenario and increase slightly under the RCP8.5 scenario. The distribution pattern would remain basically unchanged. The distribution area and average hazard index of mild droughts would be basically consistent with those for global warming of 1.5°C (, -), Supplementary Figure 5d-f).
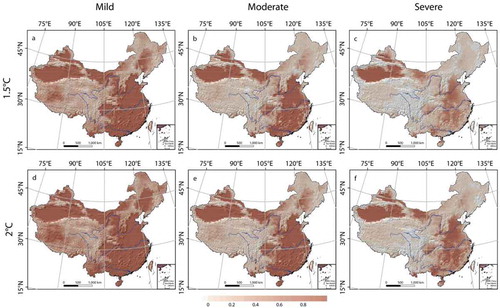
Figure 6. Spatial patterns of drought hazard indexes in China for 1.5°C and 2°C of global warming under the RCP8.5 scenario.
Compared with global warming of 1.5°C, for global warming of 2°C under the RCP4.5 scenario, the hazard index of severe droughts would decrease, and would be mainly distributed in the Yellow River Basin, the Yangtze River Basin, and Northeast China, of which the hazard index in the Qinling Mountains would decrease by more than 0.05. The hazard index would increase in Southwest China, South China, the Qinghai-Tibet Plateau, and the Tianshan Mountains. Among them, the hazard index in the central part of the Qinghai-Tibet Plateau and the western part of the Southwest China would be about twice that for global warming of 1.5°C, and in some regions, it would be up to three times larger. The range of the change in the hazard index of moderate droughts would be relatively small. It would increase slightly in Northeast China, the Qinling Mountains-Huaihe River, the eastern and western parts of South China, the western part of Northwest China, and the Qinghai-Tibet Plateau; while it would decrease slightly in North China, Southwest China, and the central part of South China. The hazard index of mild droughts in the northern fringe of Northeast China would mainly increase (Supplementary Figure 6a-c). Under the RCP4.5 scenario, droughts would be alleviated, which is closely correlated with the warming pattern of fast in the north and slow in the south and the general increase in precipitation across China. Warming on the Qinghai-Tibet Plateau would be accelerated, and the increase in precipitation would be not significant, which aggravates the severe and moderate droughts (), )). Under the RCP8.5 scenario, the hazard index of severe droughts would mainly increase, primarily in Central China, the southeastern part of Northwest China, and southeastern part of the Qinghai-Tibet Plateau, in which the hazard index would double that in the central part of North China. The hazard index would decrease in Northeast China, Southwest China, and East China. The hazard index of moderate droughts would increase in the Yangtze River Basin, the Changbai Mountains, Northwest China, and the northern part of the Qinghai-Tibet Plateau; while it would decrease in Northeast China, North China, South China, and the central part of the Qinghai-Tibet Plateau. The hazard index of mild droughts would mainly decrease in the northern fringe of Northeast China (Supplementary Figure 6d-f). Under the RCP8.5 scenario, the hazard index of severe and moderate droughts would increase, that is, the status of droughts would become grimmer. This is because the variability in temperature and precipitation would increases for global warming of 2°C, while warming would accelerate and precipitation would decrease significantly in eastern China (), )).
3.4. Integrated analysis of the hazards of extreme events
Based on the hazard levels of different extreme events, i.e., heatwaves, floods, and drought, the integrated hazards level was determined using the superposition analysis method, and the hazard sources of middle and high risk regions were evaluated.
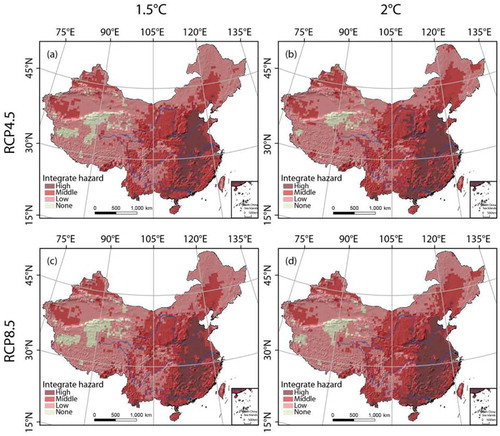
For global warming of 1.5°C, the regions with high levels of integrated hazards would account for about 20% of the total area and be mainly concentrated in the southeastern part of North China (affected by severe heatwaves, moderate floods, and moderate droughts), Central China (affected by severe heatwaves, severe floods, and severe droughts), the Pearl River Basin (affected by moderate heatwaves, severe floods, and moderate droughts), and the northern and southwestern parts of East China (affected by severe heatwaves, severe floods, and severe droughts). The middle hazard regions would account for about 25% of the total area and be mainly distributed in the Northeast Plain (affected by moderate heatwaves, moderate floods, and moderate droughts), the Loess Plateau (affected by mild heatwaves, moderate floods, and moderate droughts), the Sichuan Basin (affected by moderate heatwaves, moderate floods, and moderate droughts), the eastern and western parts of Southwest China (affected by mild heatwaves, moderate floods, and severe droughts), the southeastern part of East China (affected by moderate heatwaves, severe floods, and moderate droughts), and the western part of Northwest China (affected by severe heatwaves and moderate droughts). The low hazard regions would cover a wide range, accounting for about half of the total area. Their distribution would be basically the same under the RCP4.5 and RCP8.5 scenarios (, )).
Table 5. The distribution area of integrated hazards for 1.5°C and 2°C of global warming (units: million km2).
For global warming of 2°C, the high hazard regions would expand slightly under both scenarios, with a distribution area of nearly 2.2 million km2, of which the most obvious increase would occur in South China (affected by moderate heatwaves, severe floods, and severe droughts) and the northeastern part of East China (affected by moderate heatwaves, severe floods, and severe droughts). Under the RCP4.5 (RCP8.5) scenario, the area of middle hazards would exceed 2.8 (2.7) million km2. These areas would be mainly distributed in Southwest China (affected by moderate heatwaves, moderate floods, and moderate droughts) and the Qinling Mountains (affected by moderate heatwaves, moderate floods, and moderate droughts). The area of low hazards would decrease, accounting for about 45% of the total area (, )).
Figure 7. Spatial patterns of integrated hazards in China for 1.5°C and 2°C of global warming.
4. Conclusions and Discussion
Based on the CMIP5 climate scenario data, in this study, we estimated the years with global warming of 1.5°C and 2°C under the RCP4.5 and RCP8.5 scenarios, evaluated the response pattern of temperature and precipitation in China during the different warming periods, and comprehensively analyzed the hazards of extreme events, i.e., heatwave, floods, and droughts, under different warming periods. The main conclusions are as follows.
In the future, the warming rate in China would be significantly faster than the global mean. Under the RCP4.5 and RCP8.5 scenarios, the global mean annual temperature would increase by 1.5°C by 2029 and 2026, and by 2°C by 2050 and 2040, respectively, relative to 1861–1890. The warming trend in China would exhibit a pattern of fast in the north and slow in the south, and the warming on the Qinghai-Tibet Plateau would continue to accelerate. Precipitation would increase in the north and decrease in the south. With increasing temperature, the precipitation in the northern regions would increase more significantly, and the decreasing trend of precipitation in the southern regions would gradually slow under the RCP4.5 scenario but would be aggravated under the RCP8.5 scenario.
Severe droughts would mainly affect Central China and the central part of East China. For global warming of 2°C, the average hazards would decrease (increase) under the RCP4.5 (RCP8.5) scenario. Severe heatwaves would mostly influence the majority of eastern China, Xinjiang, and the western part of Inner Mongolia. For global warming of 2°C, the average hazards would increase under both scenarios. Severe floods would primarily affect East China, South China, and the southern part of Central China. For global warming of 2°C, the average hazards would decrease slightly under the RCP4.5 scenario and significantly increase under the RCP8.5 scenario due to the increase in the regional differences in precipitation.
Compared with global warming of 1.5°C, the areas with high and middle levels of integrated hazards would increase for global warming of 2°C, and the combined area of the two types of regions would account for half of the total area. The regions with high levels of integrated hazards would be mainly concentrated in the southeastern part of North China, the northern part of East China, Central China, and South China. The middle hazard regions would be mostly distributed in the Northeast Plain, the Loess Plateau, and the Sichuan Basin.
Global and regional scale climate change studies have revealed the aggravation of the adverse influences of gradual events and conclude that emergencies will result from future changes in the climate system, particularly under the RCP8.5 scenario (Gao, Jiao, & Wu, Citation2018; King & Karoly, Citation2017; Roudier et al., Citation2016; Russo et al., Citation2014). In this study, the spatial-temporal variation in the hazards of extreme events, i.e., heatwaves, floods, and droughts, and the integrated hazards for different warming periods were explored; and the methodology of hazard assessment and integrated analysis was preliminary established for different extreme events. In China, climate-induced disasters occur frequently, causing significant social and economic losses, and the regional characteristics of the coexistence of multiple disasters is predominantly increasing (UNISDR, & CRED, Citation2018). The demand for disaster prevention and mitigation requires research into regional multiple disaster synthesis. This study quantifies the integrated hazard of regional extreme events through horizontal comparisons of different extreme events, and then, combines these results with the vulnerability of disaster bearing bodies and the resilience and capability of disaster prevention and mitigation to provide scientific support for disaster prevention and mitigation and emergency management.
There is uncertainty in the simulations of the GCMs used in the climate predictions. In order to reduce the uncertainty in the modeling results of the GCMs, the results of the GCMs should be improved using certain methods based on the evaluation of the model’s performance. Multi-model ensemble methods were used in this paper as an effective method of improving the performance of model’s the temporal attributes (Lambert & Boer, Citation2001). The results of the multi-model ensemble reasonably reproduce the changes in the global annual mean surface temperature over the past 150 years ()). Projections of regional temperatures often suffer greater uncertainties than projections of the global mean temperature (Xie et al., Citation2015). The sequence of the multi-model ensemble over China agrees well with the observed sequence ()). As for the hazard assessment, the models used for the calculation were bias-corrected using the WATCH forcing data (WFD). These climate projections represent the climate change ranges well, and the results are reliable.
As can be seen from the results of this study, the hazard patterns and numerical values of a single type of extreme climate event as well as regional multi-type events show significant regional heterogeneity. The Guangdong-Hong Kong-Macao Greater Bay Area is located in South China and is vulnerable to direct threats from tropical cyclones, floods, heatwaves, and sea level rise, this area would have a high integrated hazard level in the future. The Beijing-Tianjin-Hebei Coordinated Development Zone, which is located in North China, is evaluated to have a high integrated hazard level due to its increasing probability of droughts, heatwaves, and floods in the future (Kang & Eltahir, Citation2018). The development of the Yangtze River Economic Belt affects the major strategy for China’s overall advancement. In 2018, heatwaves swept over eastern China and floods and periodic droughts spread over the middle reaches of the Yangtze River. These repeated disasters severely impaired the local social economy. In the future, the increase in the temperature of the Yangtze River Basin would accelerate, the decrease in precipitation would worsen, the intensity of extreme events may increase, and the concurrency of multiple disasters will be more common (Chen, Xu, & Yao, Citation2015). Therefore, the implementation of regional development strategies should consider the regional differences in future climate change and should clarify the risks of extreme events and the possible impacts of climate change.
Supplemental Material
Download MS Word (23.3 MB)Disclosure statement
No potential conflict of interest was reported by the authors.
Supplementary material
Supplemental data for this article can be accessed here.
Data availability statement
CMIP5 and ISIMIP climate scenario data are available at the Earth System Grid Federation data node at the Lawrence Livermore National Laboratory: https://esgf-node.llnl.gov/search/esgf-llnl/. The series of global mean annual temperatures can be visualized on the following web-portal: http://www.cru.uea.ac.uk/data. The series of mean annual temperatures in China are available for download from the reference: Tang, G. L., Ding, Y. H., Wang, S. W., Ren, G. Y., Liu, H. B., & Zhang, L. (2009). Comparative analysis of the time series of surface air temperature over China for the last 100 years, Advances in Climate Change Research, 5, 71-78.
Additional information
Funding
References
- Betts, R. A., Alfieri, L., Bradshaw, C., Caesar, J., Feyen, L., Friedlingstein, P., … Papadimitriou, L. (2018). Changes in climate extremes, fresh water availability and vulnerability to food insecurity projected at 1.5 C and 2 C global warming with a higher-resolution global climate model. Philosophical Transactions of the Royal Society A: Mathematical, Physical and Engineering Sciences, 376(2119), 20160452.
- Chen, X. C., Xu, Y., & Yao, Y. (2015). Changes in climate extremes over China in a 2 C, 3 C, and 4 C warmer world. Journal of Atmospheric Sciences, 39(6), 1123–1135.
- Dai, A. (2013). Increasing drought under global warming in observations and models. Nature Climate Change, 3(1), 52–58.
- Donnelly, C., Greuell, W., Andersson, J., Gerten, D., Pisacane, G., Roudier, P., & Ludwig, F. (2017). Impacts of climate change on European hydrology at 1.5, 2 and 3 degrees mean global warming above preindustrial level. Climatic Change, 143(1–2), 13–26.
- Fischer, E. M., & Knutti, R. (2015). Anthropogenic contribution to global occurrence of heavy-precipitation and high-temperature extremes. Nature Climate Change, 5(6), 560–564.
- Gao, J., Jiao, K., & Wu, S. (2018). Quantitative assessment of ecosystem vulnerability to climate change: Methodology and application in China. Environmental Research Letters, 13(9), 094016.
- Griggs, D., Stafford-Smith, M., Gaffney, O., Rockström, J., Öhman, M. C., Shyamsundar, P., … Noble, I. (2013). Policy: Sustainable development goals for people and planet. Nature, 495(7441), 305–307.
- Hay, L. E., Wilby, R. L., & Leavesley, G. H. (2000). A comparison of delta change and downscaled GCM scenarios for three mountainous basins in the United States. Journal of the American Water Resources Association, 36(2), 387–397.
- Hempel, S., Frieler, K., Warszawski, L., Schewe, J., & Piontek, F. (2013). A trend-preserving bias correction–the ISI-MIP approach. Earth System Dynamics, 4(2), 219–236.
- Huang, J., Yu, H., Dai, A., Wei, Y., & Kang, L. (2017). Drylands face potential threat under 2 C global warming target. Nature Climate Change, 7(6), 417–422.
- IPCC. (2012). Managing the risks of extreme events and disasters to advance climate change adaptation: A Special Report of Working Groups I and II of the Intergovernmental Panel on Climate Change. Cambridge and New York: Cambridge University Press.
- IPCC. (2014). Climate change 2014: Impacts, adaptation, and vulnerability. Cambridge and New Yor: Cambridge University Press.
- IPCC. (2018). Global warming of 1.5°C: An IPCC Special Report on the impacts of global warming of 1.5°C above pre-industrial levels and related global greenhouse gas emission pathways, in the context of strengthening the global response to the threat of climate change, sustainable development, and efforts to eradicate poverty. Cambridge and New York: Cambridge University Press.
- Jones, P. D., & Hulme, M. (1996). Calculating regional climatic time series for temperature and precipitation: Methods and illustrations. International Journal of Climatology: A Journal of the Royal Meteorological Society, 16(4), 361–377.
- Kang, S., & Eltahir, E. A. (2018). North China Plain threatened by deadly heatwaves due to climate change and irrigation. Nature Communications, 9(1), 2894.
- Karmalkar, A. V., & Bradley, R. S. (2017). Consequences of global warming of 1.5 C and 2 C for regional temperature and precipitation changes in the contiguous United States. PLoS One, 12(1), e0168697.
- King, A. D., & Karoly, D. J. (2017). Climate extremes in Europe at 1.5 and 2 degrees of global warming. Environmental Research Letters, 12(11), 114031.
- King, A. D., Karoly, D. J., & Henley, B. J. (2017). Australian climate extremes at 1.5 °C and 2 °C of global warming. Nature Climate Change, 7(6), 412–416.
- Lambert, S. J., & Boer, G. J. (2001). CMIP1 evaluation and intercomparison of coupled climate models. Climate Dynamics, 17(2–3), 83–106.
- Li, K., Wu, S., Dai, E., & Xu, Z. (2012). Flood loss analysis and quantitative risk assessment in China. Natural Hazards, 63(2), 737–760.
- Lin, L., Wang, Z., Xu, Y., Zhang, X., Zhang, H., & Dong, W. (2018). Additional intensification of seasonal heat and flooding extreme over China in a 2 C warmer world compared to 1.5 C. Earth’s Future, 6(7), 968–978.
- Liu, W., Sun, F., Lim, W. H., Zhang, J., Wang, H., Shiogama, H., & Zhang, Y. (2018). Global drought and severe drought-affected populations in 1.5 and 2 C warmer worlds. Earth System Dynamics, 9(1), 267–283.
- Meehl, G. A., & Tebaldi, C. (2004). More intense, more frequent, and longer lasting heat waves in the 21st century. Science, 305(5686), 994–997.
- Milly, P. C. D., Wetherald, R. T., Dunne, K. A., & Delworth, T. L. (2002). Increasing risk of great floods in a changing climate. Nature, 415(6871), 514–517.
- Morice, C. P., Kennedy, J. J., Rayner, N. A., & Jones, P. D. (2012). Quantifying uncertainties in global and regional temperature change using an ensemble of observational estimates: The HadCRUT4 data set. Journal of Geophysical Research: Atmospheres, 117(D8), 1–22.
- Moss, R. H., Edmonds, J. A., Hibbard, K. A., Manning, M. R., Rose, S. K., Van Vuuren, D. P., … Meehl, G. A. (2010). The next generation of scenarios for climate change research and assessment. Nature, 463(7282), 747–756.
- Nikulin, G., Lennard, C., Dosio, A., Kjellström, E., Chen, Y., Hänsler, A., … van Meijgaard, E. (2018). The effects of 1.5 and 2 degrees of global warming on Africa in the CORDEX ensemble. Environmental Research Letters, 13(6), 065003.
- Oki, T., & Kanae, S. (2006). Global hydrological cycles and world water resources. Science, 313(5790), 1068–1072.
- Polade, S. D., Pierce, D. W., Cayan, D. R., Gershunov, A., & Dettinger, M. D. (2014). The key role of dry days in changing regional climate and precipitation regimes. Scientific Reports, 4(1), 4364.
- Post, E., Steinman, B. A., & Mann, M. E. (2018). Acceleration of phenological advance and warming with latitude over the past century. Scientific Reports, 8(1), 3927.
- Qin, D. H. (2015). China National Assessment Report on Risk Management and Adaptation of Climate Extremes and Disasters. Beijing, China: Science Press.
- Roudier, P., Andersson, J. C., Donnelly, C., Feyen, L., Greuell, W., & Ludwig, F. (2016). Projections of future floods and hydrological droughts in Europe under a+ 2 C global warming. Climatic Change, 135(2), 341–355.
- Russo, S., Dosio, A., Graversen, R. G., Sillmann, J., Carrao, H., Dunbar, M. B., … Vogt, J. V. (2014). Magnitude of extreme heat waves in present climate and their projection in a warming world. Journal of Geophysical Research: Atmospheres, 119(22), 500–512.
- Scholze, M., Knorr, W., Arnell, N. W., & Prentice, I. C. (2006). A climate-change risk analysis for world ecosystems. Proceedings of the National Academy of Sciences, 103(35), 13116–13120.
- Shi, C., Jiang, Z. H., Chen, W. L., & Li, L. (2018). Changes in temperature extremes over China under 1.5 C and 2 C global warming targets. Advances in Climate Change Research, 9(2), 120–129.
- Steffen, W., Rockström, J., Richardson, K., Lenton, T. M., Folke, C., Liverman, D., … Donges, J. F. (2018). Trajectories of the Earth System in the Anthropocene. Proceedings of the National Academy of Sciences, 115(33), 8252–8259.
- Su, B., Huang, J., Fischer, T., Wang, Y., Kundzewicz, Z. W., Zhai, J., … Jiang, T. (2018). Drought losses in China might double between the 1.5° C and 2.0° C warming. Proceedings of the National Academy of Sciences, 115(42), 10600–10605.
- Sun, Y., Zhang, X., Zwiers, F. W., Song, L., Wan, H., Hu, T., … Ren, G. (2014). Rapid increase in the risk of extreme summer heat in Eastern China. Nature Climate Change, 4(12), 1082–1085.
- Tang, G. L., Ding, Y. H., Wang, S. W., Ren, G. Y., Liu, H. B., & Zhang, L. (2009). Comparative analysis of the time series of surface air temperature over China for the last 100 years. Advances in Climate Change Research, 5, 71–78.
- Taylor, K. E., Stouffer, R. J., & Meehl, G. A. (2012). An overview of CMIP5 and the experiment design. Bulletin of the American Meteorological Society, 93(4), 485–498.
- Thomson, A. M., Calvin, K. V., Smith, S. J., Kyle, G. P., Volke, A., Patel, P., … Edmonds, J. A. (2011). RCP4. 5: A pathway for stabilization of radiative forcing by 2100. Climatic Change, 109(1–2), 77–94.
- Trenberth, K. E. (2011). Changes in precipitation with climate change. Climate Research, 47(1–2), 123–138.
- Trenberth, K. E., Dai, A., Van Der Schrier, G., Jones, P. D., Barichivich, J., Briffa, K. R., & Sheffield, J. (2014). Global warming and changes in drought. Nature Climate Change, 4(1), 17–22.
- UN. (2015). Sustainable development goals. http://www.un.org/sustainabledevelopment/sustainable-development-goals/
- UNFCCC. (1992). United Nations Framework Convention on Climate Change. Report No.FCCC/INFORMAL/84.
- UNFCCC. (2015). Adoption of the Paris Agreement. Report No. FCCC/CP/2015/L.9/Rev.1.
- UNISDR, & CRED. (2018). Economic losses, poverty & disasters: 1998-2017. Brussels, Belgium: Centre for Research on the Epidemiology of Disasters, CRED.
- Van Loon, A. F., Gleeson, T., Clark, J., Van Dijk, A. I., Stahl, K., Hannaford, J., … Hannah, D. M. (2016). Drought in the Anthropocene. Nature Geoscience, 9(2), 89–91.
- Van Vuuren, D. P., Edmonds, J., Kainuma, M., Riahi, K., Thomson, A., Hibbard, K., … Masui, T. (2011). The representative concentration pathways: An overview. Climatic Change, 109(1–2), 5–31.
- Wang, G., Wang, D., Trenberth, K. E., Erfanian, A., Yu, M., Bosilovich, M. G., & Parr, D. T. (2017). The peak structure and future changes of the relationships between extreme precipitation and temperature. Nature Climate Change, 7(4), 268–274.
- Warszawski, L., Frieler, K., Huber, V., Piontek, F., Serdeczny, O., & Schewe, J. (2014). The inter-sectoral impact model intercomparison project (ISI–MIP): Project framework. Proceedings of the National Academy of Sciences, 111(9), 3228–3232.
- Weedon, G. P., Gomes, S., Viterbo, P., Shuttleworth, W. J., Blyth, E., Österle, H., … Best, M. (2011). Creation of the WATCH forcing data and its use to assess global and regional reference crop evaporation over land during the twentieth century. Journal of Hydrometeorology, 12(5), 823–848.
- Wu, S. H., Pan, T., Liu, Y. H., Deng, H. Y., Jiao, K. W., Lu, Q., & Gao, J. B. (2017). Comprehensive climate change risk regionalization of China. Acta Geographica Sinica, 72(1), 3–17.
- Xie, S. P., Deser, C., Vecchi, G. A., Collins, M., Delworth, T. L., Hall, A., … Watanabe, M. (2015). Towards predictive understanding of regional climate change. Nature Climate Change, 5(10), 921–930.
- Xu, Y., Zhang, B., Zhou, B. T., Dong, S. Y., Yu, L., & Li, R. K. (2014). Projected flood risks in China based on CMIP5. Advances in Climate Change Research, 10(4), 268–275.
- Zhang, L., Ding, Y. H., Wu, T. W., Xin, X. G., Zhang, Y. W., & Xu, Y. (2013). The 21st century annual mean surface air temperature change and the 2 C warming threshold over the globe and China as projected by the CMIP5 models. Acta Meteorol Sin, 71(6), 1047–1060.
- Zhou, T., & Yu, R. (2006). Twentieth-century surface air temperature over China and the globe simulated by coupled climate models. Journal of Climate, 19(22), 5843–5858.