
 ?Mathematical formulae have been encoded as MathML and are displayed in this HTML version using MathJax in order to improve their display. Uncheck the box to turn MathJax off. This feature requires Javascript. Click on a formula to zoom.
ABSTRACT
Due to profound impact on climate and human health, air quality has attracted attention from all levels of the civil society. The key step in the provision of required tools for the society to tackle the complex air quality problem is to characterize it in a comprehensive manner with a long-term perspective. Here, we describe a continuous and comprehensive observation station and its accompanying state-of-the-art instrumentation that was established to investigate the complex urban atmospheric environment in a rapidly developing Chinese Megacity. The station, located in downtown Beijing, aims to study air quality by identifying the major atmospheric pollutants and key processes determining their formation and loss mechanisms. A few hundreds of parameters are continuously measured with the state-of-the-art instruments, including trace gas concentrations, aerosol particle size distributions, and mass concentrations, covering aerosol particle chemical composition from molecules to micrometer-sized aerosol particles. This produced long-term, comprehensive big data with around bytes per year. In this paper, we provide an overview on the facilities of the station, the instrumentation used, the workflow of continuous observations and examples of results from 2018 to 2019 and a basis for establishing a modern long-term, comprehensive atmospheric urban observation station in other megacities.
1. Background: short review of air pollution in China
Air pollution has become a serious environmental issue in the world since 1950s when the London smog (dominated by H2SO4 and particulate matter (PM)) (Davis, Bell, & Fletcher, Citation2002) and Los Angeles smog (dominated by O3, peroxyacetyl nitrate (PAN) and PM) (Hidy, Citation2018) became iconic events. Over the last four decades, the developed countries in Europe and North-America, and elsewhere have implemented policies to phase out or update such technologies in industries, transportation, and agriculture that contribute to severe air pollution because it threatens public health through both acute (Bell, Davis, & Fletcher, Citation2004) and long-term adverse effects (Lelieveld, Evans, Fnais, Giannadaki, & Pozzer, Citation2015). As a consequence, China has transformed into the world’s factory (Zhang & Samet, Citation2015), accompanied with the bloom of economy and the shifting of heavy air pollution to China (Zhang et al., Citation2017) due to the lagging in clean production technologies.
Air pollution in China started from the acid rain problem (Larssen et al., Citation1999, Citation2006) due to the extensive use of coal since 1970s (Larssen et al., Citation2006), increasing from 404.0 million metric tons of standard coal equivalent (Mtce) in 1978 to 2712.0 Mtce in 2017 (http://www.stats.gov.cn). The Eastern and Southern China is one of the three major regions (together with Europe and America) of acid rain in the world. The precipitation pH in 17 of the 23 provinces (with 22.5% of the land area) was lower than 5.6 in 1990s, rising to 18 provinces (with 30.5% of the land area) in 2010s (Yu et al., Citation2017a). In 1980s, the Renewable Energy Law and the Cleaner Production Promotion Law were launched to control acid deposition (Yu et al., Citation2017a). In 1998, China approved the division scheme of sulfur dioxide pollution and acid rain control zones. Nowadays, the areas of heavy acid deposition have been reduced to some extent (Yu et al., Citation2017a, Citation2017b), but the areas of moderate acid deposition have been expanding into previously undeveloped provinces (Yu et al., Citation2017a). In the early stages, acid rain in China was dominated by SO42-, while the role of NO3− has increased gradually (Sun et al., Citation2018; Wen et al., Citation2018).
In 1979, photochemical smog pollution indicated by high concentration of O3 (with maximum hourly mean O3 concentration varied from 80 to 122 ppbv on polluted days in July), PAN and PM was for the first time observed at Xigu district in Lanzhou (Tian et al., Citation1980), followed by the first study of photochemical smog pollution in China in 1980s (Tang, Li, & Dong, Citation1989). Then, emissions of NOx and volatile organic compounds (VOCs) increased prominently because the industries grew vigorously in 1990s and the population of private vehicles increased significantly (Wang, Teter, & Sperling, Citation2011). This resulted in summertime photochemical smog pollution (Hallquist et al., Citation2016) and a mixture of London-type smog and photochemical smog in many regions in China (Zhang and Samet, Citation2015). As an indicator of photochemical smog, O3 concentration in Beijing have increased sharply since the 1990s, and often exceed 200 ppbv (Shao, Tang, Zhang, & Li, Citation2006). In September 2001, high concentrations (>120 ppbv) of O3 were observed at a rural coastal site in western Hong Kong for six consecutive days, with maximum 1-h O3 concentration reaching 191 ppbv (Wang & Kwok, Citation2003). Since 2005, the number of photochemical smog studies has increased drastically in China, especially in Pearl River Delta (PRD), Beijing-Tianjin-Hebei (BTH), and Yangtze River Delta (YRD) (Wang et al., Citation2017a). Atmospheric O3 concentrations in urban Beijing demonstrated a significant upward-trend at both seasonal and inter-annual scales (from 30 to 37 ppbv) during 2006–2016 (Chen et al., Citation2019b) with an increased rate of 1.1% yr−1 (Chen et al., Citation2019b; Tang, Li, Wang, Xin, & Ren, Citation2009). In the Northern China Plain (NCP), a large increase rate (2.0% yr−1) of boundary-layer ozone was observed in the summertime during 1995–2005 based on aircraft data (Wang et al., Citation2017a), while a rate of 0.86 ppbv yr−1 was observed in Guangdong from 2006 to 2011 (Li et al., Citation2014). Nowadays, O3 pollution in summer is more and more prominent in China. O3 formation is VOCs-limited in most regions of China due to high concentrations of NOx (Ma, Xu, Zhao, & Yan, Citation2012; Wang et al., Citation2017a). This is opposite to the NOx-limited regime in USA (Laughner & Cohen, Citation2019).
In past decades, haze due to very high loading of fine particles has become a widespread environmental problem in BTH, PRD, YRD, and Sichuan basin (SCB), with a low horizontal visibility (<10 km) particularly in winter. In the case of haze, relative humidity (RH) is below 90% to separate these from fog events. The frequency of haze events increased from ~40 days yr−1 in 1981 to >120 days yr−1 in 2010 in the BTH region (Fu, Xu, Yang, Li, & Zhao, Citation2014). In particular, after China’s accession into World Trade Organization (WTO) in 2001, the economic growth in China has experienced a dramatic rise both in energy demand and in production (Zheng et al., Citation2020). This obviously aggravated the deterioration of air quality (Wang et al., Citation2014), although stringent emission standards have been enforced. During 2004–2013, the average PM2.5 concentrations were >100 μg m−3 with an increased rate of 0.75 μg m−3 yr−1 in BJH, >85 μg m−3 in SCB and YRD and >55 μg m−3 in PRD (Ma et al., Citation2016). In January 2013, a severe haze event occurred across a total area of ~1.3 million km2 and affected ~800 million people (An et al., Citation2019). The hourly PM2.5 concentration in Beijing even exceeded 1000 μg m−3 (Zhang et al., Citation2019).
During the past few years, intensive research programs have been initiated, such as Study on the Formation Mechanism of Air Pollution and Control Technology from the National Key R&D Program of China (2015-), Formation mechanism, Health Effects and Coping Strategy of Complex Air Pollution in China from National Natural Science Foundation of China (2015-), Haze Formation Mechanism and Control Technology from the Strategic Priority Research Program of Chinese Academy of Sciences (2012–2017). Based on these research programs, remarkable progress has been achieved in understanding on the causes of haze in China. For example, local emissions (An et al., Citation2019), regional transport (Zheng et al., Citation2015), and secondary formation (He et al., Citation2018; Huang et al., Citation2014) of pollutants under favorable meteorological conditions (Liu et al., Citation2017; Zhu et al., Citation2018) have been identified as the driving forces of haze events. As for the secondary formation of aerosol, a concept of haze chemistry, whose intrinsic characteristics is the synergistic effect among different gas-phase and/or particle-phase pollutants on secondary processes leading to increase in aerosol number (Chu et al., Citation2019; Kerminen et al., Citation2018) and mass concentrations (Cheng et al., Citation2016; Guo et al., Citation2014; Huang et al., Citation2014; Wang et al., Citation2016; Xue et al., Citation2019), has been proposed (Cheng et al., Citation2016). Such complex effects have been supported by sulfate formation via heterogeneous oxidation from SO2 promoted by H2O2 and/or NO2 on mineral dust (He et al., Citation2014; Huang, Zhao, Li, & Chen, Citation2015), catalytic oxidation of SO2 by black carbon (Zhang et al., Citation2020), aqueous oxidation of SO2 promoted by NO2 in the presence or absence of NH3 in particle-bound water film (He et al., Citation2014; Wang et al., Citation2016), nitrate formation via efficient hydrolysis of N2O5 on aerosol surfaces (Wang et al., Citation2017b), and haze formation induced by new particle formation (Guo et al., Citation2014; Zamora et al., Citation2019) and further growth (Guo et al., Citation2020). About the interaction between meteorological parameters and haze formation, a comprehensive meteorological index (PLAM), indicating regional atmospheric stability and air condensation ability has been proposed (Zhang, Zhong, Wang, Wang, & Liu, Citation2018). The negative feedback mechanisms between the boundary layer meteorology and haze accumulation has been proposed (Ding et al., Citation2016b; Petäjä et al., Citation2016; Wang et al., Citation2020) and the aggravation effect of air quality by worsening of meteorological conditions, such as decrease in the wind speed (Fu et al., Citation2014) and boundary-layer height (Zhong et al., Citation2018), has also been quantified.
In 2013, the State Council of China promulgated the toughest-ever Air Pollution Prevention and Control Action Plan (Tang et al., Citation2019; Zhang et al., Citation2019). As a consequence, the annual averaged PM2.5 concentrations across the nation (74 cities, 536 sites) decreased significantly from 69.8 μg m−3 in 2013 to 47.3 μg m−3 in 2017 (Chen, Liu, Ban, Zhao, & Chen, Citation2019a; Tang et al., Citation2019; Zhang et al., Citation2019). In Beijing, it decreased from 89.5 μg m−3 in 2013 to 58.0 μg m−3 in 2017 (Cheng et al., Citation2019). Variations in meteorological conditions, sometimes responsible for more than 50% of changes in local air quality (Zhang et al., Citation2018), were estimated to explain only 9 % of the national decrease in PM2.5 concentrations from 2013 to 2017 (Zhang et al., Citation2019). These results highlight the efficiency of the Action Plan.
It should be noted that acid rain is still an environmental problem and the PM2.5 concentrations in most regions of China are still significantly higher than the air quality standard of World Health Organization. At the same time, ozone pollution has become more and more severe (Chen et al., Citation2019b). Therefore, many scientific questions on air pollution remain open and need to be clarified, such as the crucial factors determining the formation of key secondary pollutants, air quality impacts on human health, and complicated interactions and feedbacks between the air quality, global climate, regional meteorology, and ecosystem processes. Thus, a multidisciplinary approach by scientists from different fields need to be utilized in the future. The key step in the provision of required tools for the society to tackle the complex air quality problems is to characterize the air pollution in a comprehensive manner with a long-term perspective (Petäjä et al., Citation2020). The experiences from these acts on air pollution also confirmed the importance of comprehensive atmospheric observation for air pollution prevention.
At the present time, several observation networks focusing on meteorology, atmosphere, and ecosystems are running around the world, such as the Global Atmospheric Watch (GAW) since 1950s, the Long-Term Ecological Research Network (LTER) since 1980, the Chinese Ecosystem Research Network (CERN, China) since 1988 (Hu, Wang, & Liu, Citation2007), the Environment Change Network (ECN, UK) since 1992, the Aerosol, clouds, and Trace gases Research InfraStructure Network (ACTRIS, Europe) since 2015, the Station for Measuring Ecosystem Atmosphere Relations (SMEAR) since 1991 (Hari et al., Citation2016), and Station for Observing Regional Processes of the Earth System (SORPES) in Nanjing since 2011 (Ding et al., Citation2016a).
An observation station is a fundamental element for these observation networks. It is very important to share the ideas and experiences on constructing a modern urban observation station in the atmospheric environment society. In this work, we will introduce a newly established continuous and comprehensive atmosphere observation station, that’s, Aerosol and Haze Laboratory/Beijing University of Chemical Technology Station (AHL/BUCT Station), in a megacity Beijing. It has state-of-the-art facilities that are responding to the societal needs pertinent to air quality. One of the main aims was to produce big, ground base atmospheric data and contribute to the global observatory (Kulmala, Citation2018). Therefore, we developed and constructed AHL/BUCT station. The long-term goals of the AHL/BUCT Station are to identify the crucial pollutants and key processes governing air pollution in the megacities, to understand the sources of crucial air pollutants, to quantify the formation mechanism of secondary pollutants and to assess the possible impacts of air pollution on human health, climate change and ecological systems.
2. Methodology
2.1. Location of the AHL/BUCT station
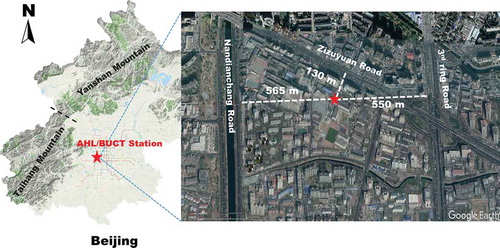
Downtown Beijing area is surrounded by the Taihang mountain cordillera from the west (Xishan) and the Yanshan mountain cordillera from the north (Jundushan). This leads to a half-basin terrain as shown in . The AHL/BUCT Station is located in the main teaching building of the west campus of Beijing University of Chemical Technology (Lat. 39º56ʹ31ʺ and Lon. 116º17ʹ52ʺ), which is ~9.0 km away from Xishan and ~30 km from Jundushan, respectively. The building is surrounded by three roads, one located 550 m from the 3rd ring road in the East, another one 130 m from the Zizhuyuan road in the North and yet another one 565 m from the Nandianchang road in the West. Therefore, the AHL/BUCT Station is a typical urban observation station affected by traffic and residential emissions. The station is on the rooftop of the main teaching building (5 floors, ~18 m above the surface). There are no surrounding buildings higher than this building within 50 m.
Figure 1. The location of AHL/BUCT Station
2.2. Concept of the AHL/BUCT station
The station consists of four units: a field observation unit, laboratory simulation unit (under construction), calibration unit and affiliated facility unit. The field observation unit is equipped with the state-of-the-art instruments in connection to atmospheric trace gases, aerosol particle size and mass concentrations, cluster and aerosol particle chemical composition on the levels from molecular size to micrometer size. It also includes a weather station to continuously measure meteorological parameters. As an extended facility, an OnLine in vitro Cell Exposure Chamber (OLCEC) for toxicity studies is under construction and will be available in December 2020. The calibration unit includes an aerosol particle calibrator which can produce, dilute, and select aerosols from 1 nm to 1000 nm for particle size and number concentration, and mass concentration calibrations, and a trace gas calibrator to generate sub-ppbv to ppbv level of standard trace gases and VOCs. The affiliated facilities unit includes a vacuum system, zero air generator and cylinders, from which the pipelines go to each laboratory, a data integration and backup system and an uninterruptible power source (UPS).
All instruments, except the weather station and sampling inlets, are in temperature-controlled laboratories on the northwest part of the fifth floor. The distribution of the instruments and the details are shown in and . Briefly, Thermal Desorption Atmospheric Pressure Interface High Resolution Chemical Ionization Mass Spectrometer (TD-API-HR-CIMS), Atmospheric Pressure Interface Long-Time-of-Flight Chemical Ionization Mass Spectrometer (API-LToF-CIMS) (Jokinen et al., Citation2012), Particle Size Magnifier (PSM) (Vanhanen et al., Citation2011), Neutral cluster & Air Ion Specter (NAIS) (Manninen, Mirme, Mirme, Petäjä, & Kulmala, Citation2016), Trace Gas Analyzers (TGA), Single Photon Ionization Mass Spectrometer (SPI-MS) (Tan et al., Citation2011), Vocus-Proton Transfer Reaction Mass Spectrometer (Vocus-PTRMS), Time-of-Flight Aerosol Chemical Speciation Monitor (ToF-ACSM) (Fröhlich et al., Citation2013), Particle Size Distribution (PSD), Differential Mobility Particle Sizer (DMPS) (Aalto et al., Citation2001), Aerodynamic Particle Sizer (APS), Organic Carbon/Element Carbon Analyzer (OC/EC Analyzer), Aethalometer, and Taper Element Oscillating Microbalance (TEOM) are in Lab 1, while X-ray Heavy Metal Analyzer (XHMA), Monitor for AeRosols and Gases in ambient Air (MARGA), Diethylene Glycol-Scanning Mobility Particle Sizer (DEG-SMPS) (Jiang, Chen, Kuang, Attoui, & McMurry, Citation2011), Long Optical Path Absorption Photometer (LOPAP) (Tong et al., Citation2016), Filter Inlet for Gases and AEROsols API-LToF-CIMS (FIGAERO-API-LToF-CIMS) (Yatavelli et al., Citation2015), OnLine Cell Exposure Chamber (OLCEC), Quartz Indoor Smog Chamber (QISC) and Photochemical Flow Tube Reactor (PCFTR) set in Lab 2.
Table 1. The main instruments at AHL/BUCT Station
Figure 2. The vertical view of the laboratory and instruments numbered as the same as that in Table 1
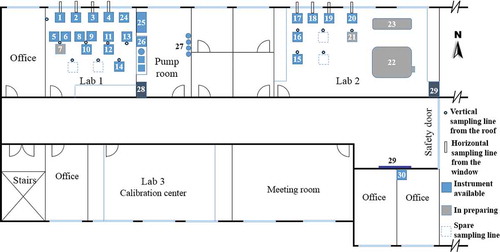
On the roof, the weather station is in the middle of the two arrays of the sampling inlets. Two gas inlets and six aerosol inlets are over Lab 1, and other five aerosol inlets are over Lab 2. The distance between the two nearest inlets is 1.5 m to reduce the local turbulence. All the heads of the inlets on the roof are 0.5 m above the top of the skirt-walls (1.0 m) of the building. The inner parts of the sampling tubing (2.0 m long) are wrapped with heat-insulating materials to prevent water condensation in summer. A Teflon sampling tubing (BMET-S, Beijing Saak-Mar Environmental Instrument Ltd.) and PM2.5 or PM10 (URG) inlet heads with polishing steel tubing are used for gas and aerosol sampling, respectively. The residence time of air mass in the sampling tubing is <10 s, while it is <6.5 s with a Reynolds number of 800 to make sure a laminar flow in the sampling tubing for aerosol sampling. For some instruments, such as TD-API-HR-CIMS, API-LToF-CIMS, FIGAERO-API-LToF-CIMS, PSM, NAIS, Nano-SMPS, and LOPAP, the ambient air is drawn through the window or wall with corresponding ~1.5 m sampling tubing to reduce the loss of sticky or reactive species. A lightning rod (5.5 m height, ESE2500, Duval Messien) is installed on the roof to protect all of these inlets from lightning strike.
2.3. Instrumentation
2.3.1. Trace gases
NOx (NO and NO2) and NOy (NO, NO2, NO3-, N2O5, HNO3, PANs, and RONO2) are measured using NOx analyzer (42i-TL, ThermoFisher) and NOy analyzer (42i-Y, ThermoFisher), respectively. SO2, CO and O3 are measured with a SO2 analyzer (43i-TLE, ThermoFisher), a CO analyzer (48i-TLE, ThermoFisher) and ozone analyzer (49i, ThermoFisher), respectively. Volatile organic compounds (VOCs) are measured using a SPI-MS (3000 R, Hexin Mass Spectrometry) (Gao et al., Citation2013). Oxygen-containing VOCs (OVOCs) will be detected using a Vocus-PTRMS (Tofwerk) (Krechmer et al., Citation2018), which will be available in June 2020. Sulfuric acid (H2SO4), clusters of sulfuric acid (H2SO4)n, (H2SO4)n(NH3)x(amines)y, nitrophenols, and highly oxygenated molecular (HOMs) with m/z in the range of 1–1000 amu are measured using a nitrate-API-LToF-CIMS (Aerodyne) (Jokinen et al., Citation2012; Kürten et al., Citation2014; Yao et al., Citation2018). HONO is measured using a home-made LOPAP (Institute of Chemistry, Chinese Academy of Sciences) (Tong et al., Citation2015, Citation2016). HONO is also detected by MARGA (Metrohm). Greenhouse gases including CO2 and CH4 are measured using a Greenhouse Gases Analyzer (G2311-f, Picarro) based on cavity ring down spectroscopy (CRDS, Picarro).
The NOy analyzer samples from the roof using an individual Teflon sampling tubing. The nitrate-API-LToF-CIMS and the LOPAP sample from the window to reduce the loss of sticky and/or reactive compounds. TGA for SO2, NOx, CO and O3, and SPI-ToF-MS for VOCs share a heated (40 °C) Teflon sampling tubing from the roof. HONO, HCl, SO2, HNO3, and NH3 measured with a MARGA are sampled from the roof using an individual sampling tubing. The details about the instruments are shown in the Supplementary Material.
2.3.2. Particle number size distribution and particulate mass
Several instruments based on different technologies are deployed to measure the particle size distribution from 1 to 10,000 nm. A PSM (Airmodus) is used to measure the size distribution of 1–3 nm particles (Vanhanen et al., Citation2011). 1–10 nm particles are cooperatively measured with a custom made DEG-SMPS operated by Tsinghua University. Particles from 2 to 40 nm and ions from 0.8 nm to 40 nm are measured using a NAIS (Airel Ltd) (Mirme & Mirme, Citation2013). Particles from 6 to 760 nm are measured with a custom-made DMPS (Aalto et al., Citation2001). The particles from 500 nm to 10,000 nm are measured by an APS (3321, TSI). In addition, a PSD, which integrates a nano-DMA (3085, TSI), a long DMA (3081, TSI) and an APS, is also deployed to measure the particle size from 3 nm to 10,000 nm. Using these instruments, the particles/cluster size distribution from 0.8 nm to 10,000 nm are monitored simultaneously.
Particle mass concentration, PM2.5 and PM10 (Particulate Matter with aerodynamic diameter < 2.5 and < 10 μm, respectively) is measured using a TEOM (1405-DF, ThermoFisher). The PM2.5 and PM10 concentrations are also downloaded from the nearest four national monitoring stations (Wanliu, Gucheng, Wanshouxigong and Guanyuan) of the China National Environmental Monitoring Center (CNEMC) for comparison.
The PSM, the NAIS, and the DEG-SPMS directly sample from the window with individual sampling tubes to reduce the loss of ultrafine particles, while the APS shares a sampling tubing and a PM10 inlet with the PSD from the roof, and the DMPS shares a sampling tubing and a PM2.5 inlet with the ACSM and the Aethalometer, which will be discussed in the following section.
2.3.3. Particle composition
The bulk composition including chloride, nitrate, sulfate, ammonia and organics of non-refractory PM2.5 (NR-PM2.5) is measured with a ToF-ACSM (Aerodyne) (Fröhlich et al., Citation2013). FIGAERO-CIMS (Lopez-Hilfiker et al., Citation2014) is deployed to measure the molecular composition of bulk PM2.5 and trace gases alternatively. A TD-API-HR-CIMS (Smith, Moore, McMurry, & Eisele, Citation2004) is deployed to measure the composition of nano-particles (3–150 nm) selected by three parallel nano-DMAs (3085, TSI). Inorganic ions including NO3−, SO42-, Cl−, NH4+, K+, Ca2+, and Mg2+ in PM2.5 and soluble gases including SO2, HCl, HONO, HNO3 and NH3 are measured by a MARGA with one-hour time resolution. Heavy metals (Si, K, Ca, Ti, V, Cr, Mn, Fe, Co, Ni, Cu, Zn, Ga, As, Se, Ag, Cd, Sn, Sb, Ba, Hg, Tl, and Pb) in PM2.5 are measured with an XHMA. Black carbon (BC) is measured using an Aethalometer (Magee). Organic carbon (OC) and element carbon (EC) are semi-continuously measured using an OC/EC analyzer (Model 4, Sunset) based on thermal optical transmission (TOT) method.
The ACSM and the Aethalometer share one sampling tubing from the roof after cutting particles with diameter larger than 2.5 μm. Before sampling by the instruments, the air is dried using a Nafion dryer (MD-700-24 F-3, Perma Pure). The OC/EC analyzer, the XHMA and the TEOM sample from the roof using the individual sampling tubing. PM2.5 inlets are installed for the OC/EC and the XHMA, while a PM10 inlet is used for the TEOM. The FIGAERO-CIMS samples from the window for gas measurement, while from the roof with a PM2.5 inlet for particle measurement. The TD-HR-CIMS samples from the window to reduce the loss of small particles.
2.3.4. Meteorological parameters
Wind speed (WS), wind direction (WD), atmospheric pressure (P), temperature (T), relative humidity (RH), precipitation, visibility, global radiation, diffused radiation, net radiation, and ultraviolet radiation (A and B) are measured with an Automatic Weather Station (AWS310, Vaisala). Cloud height and vertical visibility are measured based on the echo time of the exciting laser (910 nm) and cloud coverage is measured by the moving integration algorithm within 30 min using a ceilometer (CL51, Vaisala). Planetary boundary layer (PBL) height can also be inferred from the backward scattering signals. Horizontal visibility is measured by a visibility sensor based on forward scattering signal (PWD22, Vaisala). The photolysis rate (JNO2) is measured via a continuous measurement of the actinic flux in the wavelength range of 285–375 nm using a JNO2 filter-radiometer (2-pi-JNO2 radiometer, Metcon).
2.3.5. Data backup system
All the instruments have independent data acquisition system and computers. We have developed a data integration and backup system for routine data quality check and data backup. The real-time raw data are automatically uploaded to a network-attached storage (NAS, Synology) per hour. The total capacity of the hard disk array is 32 TB. A custom-made data integration system can selectively read the data, such as meteorological parameters, concentration of trace gases, PM mass concentration and composition, from the NAS and show the corresponding plot on a screen.
2.3.6. Affiliated facilities
Dried zero air is needed by several instruments such as the nitrate-LToF-CIMS, the PSM, and the DMPS, while dried compressed air is required for drying aerosol before going into the ACSM, the Aethalometer, the DMPS, the PSD and so on. A pure air generator system, containing an oil-free air compressor (SLPJ-37B, ANEST IWATA), a gas tank (0.3 m3 @ 8 atm), a low temperature dryer (CAPITOR), and zero air generator (737–15, AADCO), is in the pump room (). The maximum output flow rate of the compressor and the zero air generator is 405 lpm and 250 lpm, respectively. Dried compressed air (with dew point of −51°C) is branched into the zero air generator and pipelines into the laboratories. Thus, both dried zero air and compressed air are available in each laboratory. An oil-free vacuum pump (MM1142BV, Mink) is in the pump room to provide vacuum condition in each laboratory. Two 20 KVA UPS (Santak) are installed in the pump room and Lab 2, respectively. All the instruments in Lab 1 and Lab 2 can run for ~1 hour in the case of interruption of power supply. The gas cylinders are in the pump room.
2.4. Data quality control
Data quality is very important in the continuous observations. The experiment log for each instrument is recorded every day including responsible person and instrument status which is updated weekly. Science meeting about data quality control is held weekly. The setup of the calibration system is shown in Figure S1 and the corresponding calibration protocols are shown in the Supplementary Material.
show the concentrations of SO2, CO, NO2, O3, PM2.5 and PM10 measured at our station and the corresponding mean concentrations of the four nearest surrounding national monitoring stations from Feb 2018 to Feb 2019. Overall, these pollutants show similar variations and the comparable concentrations. Figure S2 shows the corresponding scattering plot. The slope and the correlation coefficient (R) between the measured concentration at the AHL/BUCT Station and the surrounding values are 0.95 and 0.88 for SO2, 0.98 and 0.93 for CO, 0.90 and 0.93 for NO2, 0.95 and 0.96 for O3, 0.80 and 0.97 for PM2.5, 0.78 and 0.92 for PM10, respectively. The trace gas results at our station are closely consistent with the surrounding stations, while the TEOM at our station slightly underestimates the PM concentration when compared with the surrounding stations.
Figure 3. Comparison of the concentration of selected pollutants (A)-(F) measured at the AHL/BUCT Station with the mean concentration of the four nearest surrounding national monitoring stations from Feb 2018 to Feb 2019, (G) BC and EC concentration measured with the Aethalometer and the OC/EC Analyzer, respectively, (H) OA and OM (OM = OC×1.8) concentration measured with the ACSM and the OC/EC Analyzer, respectively, and (I) chloride concentration measured by the ACSM and the XHMA, respectively
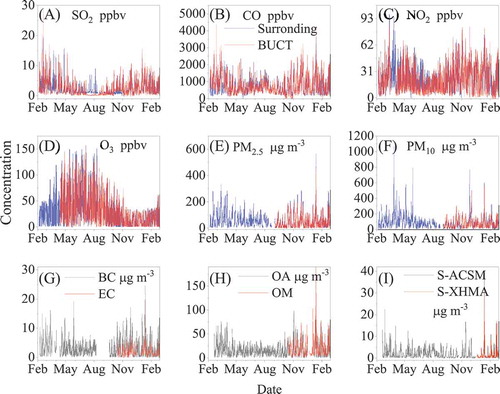
To further check out the data quality, the concentrations of a same or similar pollutant measured by different method are also routinely compared. As shown in , the concentration of EC measured by the OC/EC Analyzer well tracks the variation of BC measured with the Aethalometer. The slope is 0.52 along with a correlation coefficient of 0.98. The calculated organic matter (OM = OC×1.8) measured by the OC/EC Analyzer also well correlated with the OA measured with the ACSM (). The slope is 1.01 with a correlation coefficient of 0.96. The sulfide measured by the XHMA correlates well with that measured by the ACSM with a slope of 0.82 and correlation coefficient of 0.91 (Figure S1). Although some deviations are observed among the absolute values for these parameters due to different form, OC and EC show good correlations with OA and BC, respectively. In the future, intercomparisons will be further carried out between different instruments in our laboratory, such as VOCs concentration measured by the SPI-MS and the PTR-MS, the NO concentration measured by the NOx and NOy analyzers, the HONO concentration measured by the LOPAP and the MARGA and the particle size distribution measured by different instruments. In addition, we are also looking for the opportunity to do intercomparison with other laboratories and companies.
3. On observational results
3.1. Overview of the data set
The continuous observations started on February 2018 with the instruments () from BUCT, Tsinghua University and Chinese Academy of Sciences (Institute of Chemistry, Research Center for Eco-Environmental Sciences and Institute of Atmospheric Physics). Around 20 instruments were deployed at the AHL/BUCT Station from February 2018 to January 2019. Besides the long-term and continuous observation, two intensive campaigns have also been cooperatively organized with Fudan University from Feb 1 to April 11, 2018 and Nanjing University of Information Technology from October 20, 2018 to March 13, 2019. Overall, the data coverage varied from 40% to 100% depending on instruments due to instrument calibrations, maintenance, and other deployments. The total data size is around 600 GB for one year’s observation. The details are shown in .
Table 2. Overview of the main data set from February 2018 to January 2019
3.2. General feature of the air quality
summarizes the air quality index (AQI) and the classification of pollution events from February 2018 to January 2019. The annual mean PM2.5 concentration was 57.7 μg m−3, which was close to that in 2017 Beijing (Cheng et al., Citation2019). In 2018, 31.8 % of days were in unhealthy and even worse air quality (with AQI >100). At the same time, as the corresponding primary pollutant, PM2.5, PM10, O3 and NO2 dominated 77%, 19%, 3 % and 1 % of the pollution days (with AQI >100), respectively. High frequency of heavy pollution events (with AQI > 150) accompanied with high PM2.5 concentration occurred from November to April (mainly in heating season) (). The frequency of hourly PM2.5 concentration higher than 75 μg m−3 with RH lower than 90% was 47% from November to April, while it was 34% in other months. This is the typical feature that pollution event usually happens in autumn and winter Beijing (An et al., Citation2019).
Table 3. The calendar of air quality index and the classification of events from February 2018 to January 2019
Figure 4. Monthly distribution of (A) PM2.5 concentration, (B) air pollution levels defined in the light of AQI and (C) the mean frequency of events classed as the same as that in Table 3 from February 2018 to January 2019
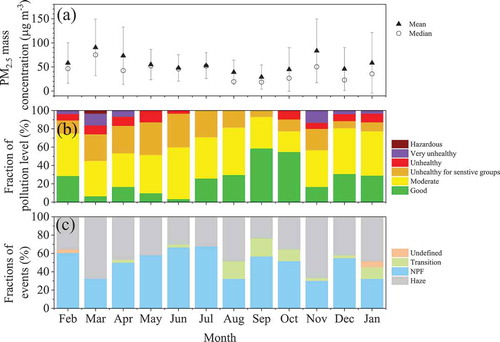
In addition to frequent occurrence of air pollution dominated by fine particles, new particle formation (NPF) events were vigorous throughout the year. summarizes the classification of the pollution and NPF events day by day according to the method proposed by Dal Maso et al. (Citation2005) and modified to fit polluted urban environments. Namely, NPF event was identified by the appearance of cluster mode particles (1–3 nm) followed by further growth into nucleation mode particles (3–25 nm). Haze was identified by the PM2.5 concentration higher than 75 μg m−3 with the relative humidity less than 90% at least lasting for 1 hour per day. The annual NPF occurrence was 49.4%. In February, April, May, June, July, September, October, and December, the occurrence of NPF exceeded 50% (). This highlights the active secondary transformation of pollutants in Beijing. However, it is still an open question that why new particle formation or secondary transformation of pollutants is more efficient in winter under polluted urban environment (Kulmala, Citation2015; Kulmala et al., Citation2017). This is also one of our research interests in the future.
3.3. Variation of meteorological conditions
summarizes the typical meteorological parameters throughout one year of observations. High temperature, high RH and low pressure usually occurred from May to October, and vice versa in other months. 42% of hourly visibility was lower than 10 km with RH less than 90%. This is comparable to the frequency (41%) of hourly PM2.5 concentration higher than 75 μg m−3 and RH lower than 90%. Although the PM2.5 concentration was significantly lower in summer than in other seasons (), high RH was favorable for decreasing of the visibility in summer. Therefore, no significant difference for the frequency of low visibility among different seasons (43% from November to Jan vs 41% from April to October) was observed.
Figure 5. Meteorological parameters from February 2018 to January 2019
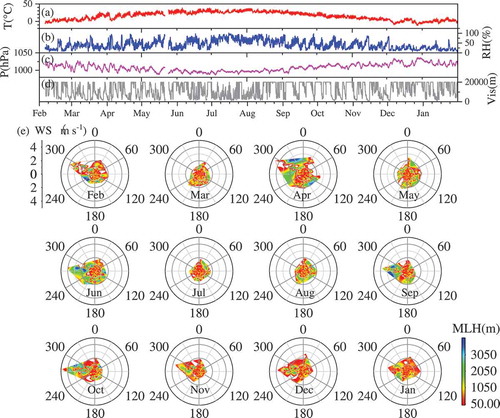
As shown in , the half-basin terrain feature of Beijing helps the formation of stagnant weather conditions. The stagnant weather, with wind speed lower than 1 m s−1 and the mixed layer height (MLH) lower than 500 m, occurred with a high probability in every season (). Because of intensive emissions of air pollutants in the surrounding areas, the meteorological conditions are the controlling factor determining the air quality in Beijing. In particular, the stagnant weather conditions, such as low wind speeds (< 2 m s−1) from south directions and low MLH, usually become the sufficient and necessary conditions of pollution events in Beijing. The pollution level (AQI) was greatly affected by the air parcels from the local and south regions, bringing high concentrations of pollutants from south directions to Beijing, especially with low wind speeds (Sun et al., Citation2010) due to the distribution of the megacity and industry in the NPC region.
3.4. Monthly chemical composition of fine particles
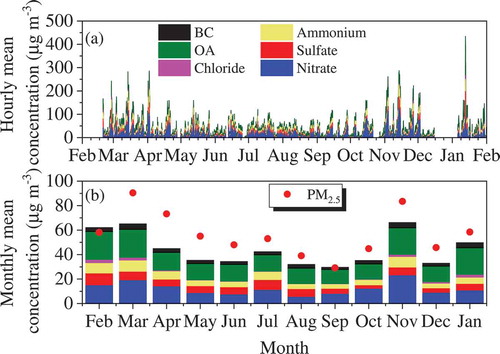
shows the composition of non-refractory-PM2.5 (NR-PM2.5) measured using the ToF-ACSM and BC from February 2018 to January 2019. As shown in , air pollution occurred periodically with a cycle of 5–7 days (Guo et al., Citation2014; Wang et al., Citation2016). Similar to the monthly distribution of the AQI (), concentrations of NR-PM2.5 during the period from November to April were significantly higher than during the rest of the year. All of the NR-PM2.5 components, including nitrate, sulfate, ammonium, chloride, OA and BC, showed high concentrations in the heating season (from October 15 to March 15) compared with the non-heating season (). Organic aerosol contributed from 34% to 48% of the monthly mean of NR-PM2.5, followed by nitrate (20–38%), sulfate (12–22%), ammonium (11–16%) and chloride (<5%). In particular, nitrate and organic aerosol showed significantly higher contribution to the NR-PM2.5 during the heating season than during the non-heating season. These results imply the importance to reduce NOx and volatile organic compounds emission in Beijing and surrounding areas.
Figure 6. The composition of non-refractory-PM2.5 from February 2018 to Jan 2019
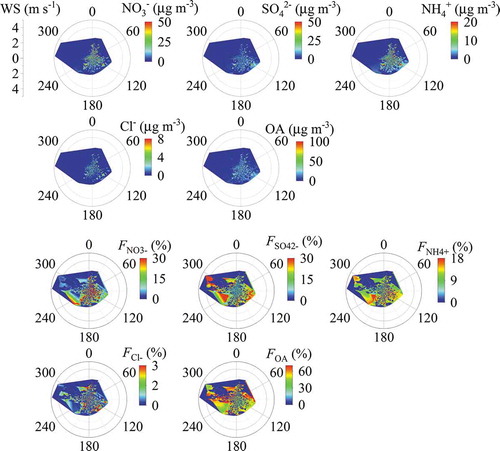
shows the distribution of NR-PM2.5 mass concentrations in the two-dimensional space of wind speed and wind direction. The strong northwest or west wind resulted into low mass loading of the NR-PM2.5, while the weak wind (< 2 m s−1) from the southwest, south and southeast directions led to high mass concentrations for all these NR-PM2.5 components. This can be explained by the industrial distribution in south related directions and the terrain of Beijing (Fig. S1). Under stagnant meteorological conditions, the southern air masses usually bring high concentration of air pollutants along Taihang Mountain to our observation site (Sun et al., Citation2015). When the air masses reach to Yanshan Mountain, the blocking role of the mountains lead to high concentration of pollutants from northeast direction wind (Quan et al., Citation2020). Although the mass concentrations showed a similar dependence on the wind field among different components of NR-PM2.5, the relative contributions showed obvious different responses to the wind field among different components because the variation of particle composition at different PM pollution levels (Figure. S3). High fractions of nitrate, sulfate, and ammonium were connected to the air parcels from the southwest and southeast directions on pollution days, while high OA fractions were highly associated with air masses from the north and northwest directions on relatively clean days. High fractions of sulfate, ammonium, and OA sometimes were observed for the air masses from the northwest direction even at high wind speeds (> 4 m s−1). This implies the regional characteristic of fine particle formation in China. In the future, the dependence of particle composition on wind direction will be further analyzed in terms of source apportionment and the potential source contribution function (PSCF) analysis.
Figure 7. The dependence of NR-PM2.5 concentration and composition on wind direction and wind speed from Feb 2018 to Jan 2019
3.4. Evolution of air quality from clean to pollution days
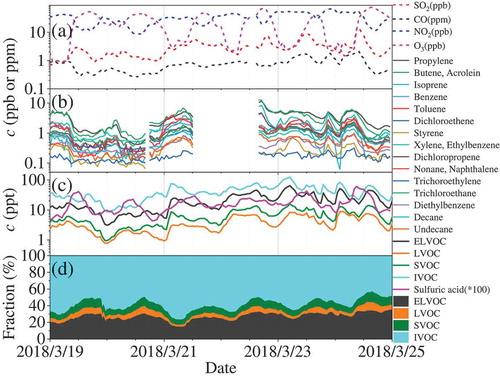
shows a typical case of shifting from NPF days (clean days) to pollution days. Before of 6:00 am in March 19, the very low MLH and wind speed resulted into high concentration of PM2.5 (> 100 μg m−3), whose diameter was around 150 nm. In the early morning, a breeze in the following ~3 hours from the northeast direction was accompanied with a gradual increase of MLH (), leading to the dispersion of accumulated pollutants both horizontally and vertically. At the same time, new particle formation supported by high concentrations of H2SO4 () and explosive growth of the particle number concentration () started along with the photochemistry, lasting until 2:00 pm. Then, the weak wind (~ 1 m s−1) shifted to the southeast direction, leading to a slight increase of the concentration of large particles (~ 100 nm) and decreased particle growth until 6:00 pm. Finally, the air parcel from southwest direction along with a decrease in MLH led to an increase of the PM2.5 concentration again in the night. In the second day, a similar sequence of processes occurred. However, the continuous weak winds from south direction resulted into the building up of a long-term pollution event until the noon of Mach 24. The strong winds and broken of inversion layer resulted in a clean day at noon of Mach 24. Many gaseous pollutants, including SO2, CO, and VOCs, SVOCs, IVOCs, LVOCs, and ELVOCs (), showed similar variations as PM2.5, whereas H2SO4 and O3 concentrations were more sensitive to the sunlight.
Figure 8. Evolution of (A) weather conditions, (B) particle size distribution and PM2.5 mass concentration, and (C) composition of NR-PM2.5 from March 19 to 25, 2018
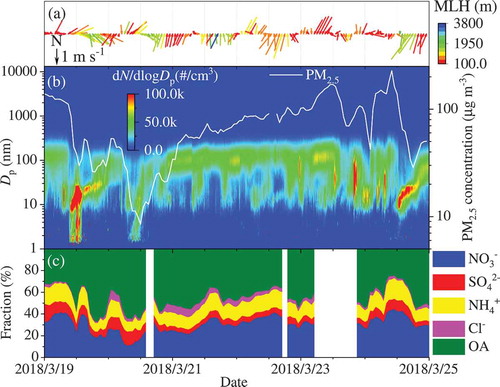
Figure 9. Concentrations change of (A) SO2, CO, NO2, O3, (B) VOC, (C) ELVOC, LVOC, SVOC, IVOC and H2SO4, (D) relative fraction of SVOC, IVOC, LVOC and ELVOC, and (E) the mass defect graph of oxygenated organic molecules measured by a nitrate-ToF-CIMS
As shown in , the composition of NR- PM2.5 in the NPF events was obviously different from that in the pollution events. The contribution of organic component to the NR-PM2.5 was obviously higher in the NPF events than that in pollution events, while inorganic components, including nitrate and ammonium, contributed more to NR-PM2.5 in polluted days. This is consistent with previous findings about the chemical composition of NR-PM1.0 observed at difference pollution levels (Sun et al., Citation2015). At the very beginning of the NPF events, the fraction of nitrate usually fell down to the lowest value (), followed by its gradual increase along with the particle growth (). This implies a possible role of nitrate in particle growth, which is required to be clarified in the future. It should be noted that the detectable size of the ToF-ACSM is much larger than those of particles involved in NPF. It is urgent to directly measure the composition of particles from the cluster mode to the nucleation mode to understand the birth and growth of new particles. Therefore, we have deployed several chemical ionization mass spectrometers, such as nitrate-CIMS, TD-nitrate-CIMS, and FIGAERO-LToF-CIMS, to answer this challengeable question. The relevant work is still ongoing.
As shown in , concentrations of VOCs during the NPF days were significantly lower than those during the polluted days. The same pattern was observed for oxygenated organic molecules (OOMs) (), although their concentration were two orders of magnitude lower than those of VOCs. During the first NPF event (), OOMs showed a decreasing trend, while it increased slightly during the second NPF event. This means that nucleation should be independent of the OOMs concentration. In polluted days, however, accumulation of OOMs was prominent as shown in . This implies that OOM should play an important role in particle growth in polluted days. The details will be discussed in a separate work in the future. Overall, these results demonstrate that we can understand atmospheric processes from nucleation to haze formation based on our comprehensive measurements. The meteorological parameters, gas phase precursors for particle formation, particle size distribution, and particle concentration have been well characterized. More general and universal rules about air pollution in megacity Beijing will be investigated on the evidence of continuous and comprehensive observations in the future.
4. Conclusions
Rapid urbanization and industrialization have led to very serious and complex urban air pollution in China and in other developing countries. This requires a full understanding on the sources of crucial air pollutants, formation mechanism of secondary pollutants and possible impacts of air pollution on human health, climate change and ecosystem in the hot spots of air pollution in the world. In this work, we described the details about our newly constructed AHL/BUCT Station. The aim of the stations is to understand complex urban atmospheric environment in Beijing megacity. The station, equipped with the state-of-the-art facilities in an atmospheric environment, consists of a field observation unit, laboratory simulation unit, calibration unit, and affiliated facility unit. The preliminary results from 2018 to 2019 demonstrate that our observation station is capable of continuously measuring plenty of parameters in connection to meteorological conditions, atmospheric trace gases, aerosol particle size and mass concentrations, and finally particle chemical composition from molecules to micrometer-sized aerosol particles. The facilities will provide us powerful tools to fully understand the mechanism of aerosol formation and growth, the causes of complex urban air pollution, and the impacts on human health, climate change, and ecosystems. The AHL/BUCT observatory is able to contribute to the global observatory (Kulmala, Citation2018) with its comprehensive data. The huge size of dataset and the large number of variables for our long-term observation require special statistical tools such as cluster analysis, positive matrix factor analysis, and artificial intelligence to answer the scientific questions mentioned above in the future like the process of any other big data. At the start of the AHL/BUCT Station, we are open mind to corporate with the scientists at home and abroad, such as University of Helsinki, Finland, Tsinghua University, Fudan University, and Nanjing University of Information Science & Technology, Chinese Academy of Sciences (Institute of Chemistry, Research Center for Eco-Environmental Science, Institute of Atmospheric Physics) and Karlsruhe Institute of Technology, Germany. We unreservedly share the data among our collaborators and also welcome the corporation with scientists whose research interests are complementary with ours.
Supplemental Material
Download MS Word (1.5 MB)Acknowledgments
We would thank Sailhero Environmental Protection High-tech Co., Ltd and Skyray Instrument Inc. for their instrument donation.
Disclosure statement
No potential conflict of interest was reported by the authors.
Supplementary material
Supplemental data for this article can be accessed here.
Data availability statement
The data that support the findings of this study are available from the corresponding author ([email protected]) upon reasonable request.
Additional information
Funding
Notes on contributors

Yongchun Liu
Dr. Yongchun Liu is a full professor of Beijing University of Chemical Technology. He received his Ph.D degree from Chinese Academy of Sciences in 2008, then worked as a research scientist at Research Center for Eco-Environmental Sciences, Chinese Academy of Sciences until 2017. His research interests focus on atmospheric chemistry and its environmental impacts, such as the heterogeneous reaction mechanism and kinetics of trace gases on ambient relevant particle matter, chemical aging and toxicological evolution of carbonaceous aerosols, source apportionment of air pollutants and so on. He has published more than 90 peer-reviewed papers.

Federico Bianchi
Dr. Federico Bianchi, born in Bergamo, Italy, in 1984, graduated in chemistry from University of Milan. After working for four years as a Marie Curie student at the CLOUD project in CERN and at the Paul Scherrer Institute, he received his Ph.D. in atmospheric chemistry from the Eidgenössische Technische Hochschule (ETH) Zürich (2014). In 2017, he received the Arne Richter Award for Outstanding Early Career Scientists given by the European Geosciences Union. After being awarded with an ERC Starting Grant, he was appointed as Associate Professor on atmosphere and cryosphere interactions at the University of Helsinki. His research interests are the formation of new particles in extreme environments, from pristine free troposphere to polluted megacities. Currently, his group is focusing on understanding preindustrial atmosphere and the influence of biogenic highly oxygenated organic molecules on aerosol formation.

Markku Kulmala
Dr. Markku Kulmala, Academy Professor, directs the Institute for Atmospheric and Earth System Research (INAR) and has served as Professor at the University of Helsinki since 1996. Kulmala also acts as coordinator for the Centre of Excellence, appointed by the Academy of Finland the first time in 2002 and the Digital Belt and Road Program International Center of Excellence at the University of Helsinki. Previously, he has directed the Nordic Center of Excellence, appointed by Nordforsk (CRAICC), which is the largest joint Nordic research and innovation initiative to date, aiming to strengthen research and innovation regarding climate change issues in the Nordic and high-latitude regions. He has received several international awards such as the Smoluchovski Award (1997), the International Aerosol Fellow Award (2004), the Wilhelm Bjerkenes medals (2007), Fuchs Memorial Award (2010), Litke Gold Medal of the Russian Geographical Society (2015), the honorary title of Academician of Science (Finland and China), Wihuri International Prize 2017, Distinguished Visiting Fellow (IIASA), and World Academy of Sciences fellow.
References
- Aalto, P., Hämeri, K., Becker, E., Weber, R., Salm, J., Mäkelä, J. M., … Kulmala, M. (2001). Physical characterization of aerosol particles during nucleation events. Tellus B, 53(4), 344–358.
- An, Z., Huang, R.-J., Zhang, R., Tie, X., Li, G., Cao, J., … Ji, Y. (2019). Severe haze in northern China: a synergy of anthropogenic emissions and atmospheric processes. Proceedings of the National Academy of Sciences of the United States of America, 116(18), 8657–8666.
- Bell, M. L., Davis, D. L., & Fletcher, T. (2004). A retrospective assessment of mortality from the London smog episode of 1952: the role of influenza and pollution. Environmental Health Perspectives, 112(1), 6–8.
- Chen, D., Liu, Z., Ban, J., Zhao, P., & Chen, M. (2019a). Retrospective analysis of 2015–2017 wintertime PM2.5 in China: response to emission regulations and the role of meteorology. Atmospheric Chemistry and Physics, 19(11), 7409–7427.
- Chen, Z., Zhuang, Y., Xie, X., Chen, D., Cheng, N., Yang, L., & Li, R. (2019b). Understanding long-term variations of meteorological influences on ground ozone concentrations in Beijing during 2006–2016. Environmental Pollution, 245, 29–37.
- Cheng, J., Su, J., Cui, T., Li, X., Dong, X., Sun, F., … He, K. (2019). Dominant role of emission reduction in PM2.5 air quality improvement in Beijing during 2013–2017: A model-based decomposition analysis. Atmospheric Chemistry and Physics, 19(9), 6125–6146.
- Cheng, Y., Zheng, G., Wei, C., Mu, Q., Zheng, B., Wang, Z., … Su, H. (2016). Reactive nitrogen chemistry in aerosol water as a source of sulfate during haze events in China. Science Advances, 2(12), e1601530.
- Chu, B., Kerminen, V. M., Bianchi, F., Yan, C., Petäjä, T., & Kulmala, M. (2019). Atmospheric new particle formation in China. Atmospheric Chemistry and Physics, 19(1), 115–138.
- Dal Maso, M., Kulmala, M., Riipinen, I., Wagner, R., Hussein, T., Aalto, P. P., & Lehtinen, K. E. J. (2005). Formation and growth of fresh atmospheric aerosols: eight years of aerosol size distribution data from SMEAR II, Hyytiala, Finland. Boreal Environment Research, 10(5), 323–336.
- Davis, D. L., Bell, M. L., & Fletcher, T. (2002). A look back at the London smog of 1952 and the half century since. Environmental Health Perspectives, 110(12), A734–A735.
- Ding, A., Nie, W., Huang, X., Chi, X., Sun, J., Kerminen, V.-M., … Fu, C. (2016a). Long-term observation of air pollution-weather/climate interactions at the SORPES station: a review and outlook. Frontiers of Environmental Science & Engineering, 10(5), 15.
- Ding, A. J., Huang, X., Nie, W., Sun, J. N., Kerminen, V.-M., Petäjä, T., … Fu, C. B. (2016b). Enhanced haze pollution by black carbon in megacities in China. Geophysical Research Letters, 43(6), 2873–2879.
- Fröhlich, R., Cubison, M. J., Slowik, J. G., Bukowiecki, N., Prévôt, A. S. H., Baltensperger, U., … Jayne, J. T. (2013). The ToF-ACSM: a portable aerosol chemical speciation monitor with TOFMS detection. Atmospheric Measurement Techniques, 6(11), 3225–3241.
- Fu, G. Q., Xu, W. Y., Yang, R. F., Li, J. B., & Zhao, C. S. (2014). The distribution and trends of fog and haze in the North China plain over the past 30 years. Atmospheric Chemistry and Physics, 14(21), 11949–11958.
- Gao, W., Tan, G., Hong, Y., Li, M., Nian, H., Guo, C., … Zhou, Z. (2013). Development of portable single photon ionization time-of-flight mass spectrometer combined with membrane inlet. International Journal of Mass Spectrometry, 334, 8–12.
- Guo, S., Hu, M., Peng, J., Wu, Z., Zamora, M. L., Shang, D., … Zhang, R. (2020). Remarkable nucleation and growth of ultrafine particles from vehicular exhaust. Proceedings of the National Academy of Sciences S of the United States of America, 117(7), 3427–3432.
- Guo, S., Hu, M., Zamora, M. L., Peng, J., Shang, D., Zheng, J., … Zhang, R. (2014). Elucidating severe urban haze formation in China. Proceedings of the National Academy of Sciences of the United States of America, 111(49), 17373–17378.
- Hallquist, M., Munthe, J., Hu, M., Wang, T., Chan, C. K., Gao, J., … Thynell, M. (2016). Photochemical smog in China: scientific challenges and implications for air-quality policies. National Science Review, 3(4), 401–403.
- Hari, P., Petäjä, T., Bäck, J., Kerminen, V. M., Lappalainen, H. K., Vihma, T., … Kulmala, M. (2016). Conceptual design of a measurement network of the global change. Atmospheric Chemistry and Physics, 16(2), 1017–1028.
- He, H., Wang, Y., Ma, Q., Ma, J., Chu, B., Ji, D., … Hao, J. (2014). Mineral dust and NOx promote the conversion of SO2 to sulfate in heavy pollution days. Scientific Report, 4. doi:10.1038/srep04172
- He, P. Z., Alexander, B., Geng, L., Chi, X. Y., Fan, S. D., Zhan, H. C., … Xie, Z. Q. (2018). Isotopic constraints on heterogeneous sulfate production in Beijing haze. Atmospheric Chemistry and Physics, 18(8), 5515–5528.
- Hidy, G. M. (2018). An historical experiment: Los Angeles smog evolution observed by blimp. Journal of the Air & Waste Management Association, 68(7), 643–655.
- Hu, B., Wang, Y., & Liu, G. (2007). Ultraviolet radiation spatio-temporal characteristics derived from the ground-based measurements taken in China. Atmospheric Environment, 41(27), 5707–5718.
- Huang, L., Zhao, Y., Li, H., & Chen, Z. (2015). Kinetics of heterogeneous reaction of sulfur dioxide on authentic mineral dust: effects of relative humidity and hydrogen peroxide. Environmental Science & Technology, 49(18), 10797–10805.
- Huang, R.-J., Zhang, Y., Bozzetti, C., Ho, K.-F., Cao, -J.-J., Han, Y., … Prevot, A. S. H. (2014). High secondary aerosol contribution to particulate pollution during haze events in China. Nature, 514(7521), 218–222.
- Jiang, J., Chen, M., Kuang, C., Attoui, M., & McMurry, P. H. (2011). Electrical mobility spectrometer using a iethylene glycol condensation particle counter for measurement of aerosol size distributions down to 1 nm. Aerosol Science and Technology, 45, 510–521.
- Jokinen, T., Sipilä, M., Junninen, H., Ehn, M., Lönn, G., Hakala, J., … Worsnop, D. R. (2012). Atmospheric sulphuric acid and neutral cluster measurements using CI-APi-TOF. Atmospheric Chemistry and Physics, 12(9), 4117–4125.
- Kerminen, V.-M., Chen, X., Vakkari, V., Petäjä, T., Kulmala, M., & Bianchi, F. (2018). Atmospheric new particle formation and growth: Review of field observations. Environmental Research Letters, 13(10), 103003.
- Krechmer, J., Lopez-Hilfiker, F., Koss, A., Hutterli, M., Stoermer, C., Deming, B., … de Gouw, J. (2018). Evaluation of a new reagent-ion source and focusing ion–molecule reactor for use in proton-transfer-reaction mass spectrometry. Analytical Chemistry, 90(20), 12011–12018.
- Kulmala, M. (2015). China’s choking cocktail. Nature, 526(7574), 497–499.
- Kulmala, M. (2018). Build a global Earth observatory. Nature, 553, 21–23.
- Kulmala, M., Kerminen, V. M., Petaja, T., Ding, A. J., & Wang, L. (2017). Atmospheric gas-to-particle conversion: why NPF events are observed in megacities? Faraday Discussions, 200( 0), 271–288.
- Kürten, A., Jokinen, T., Simon, M., Sipilä, M., Sarnela, N., Junninen, H., … Curtius, J. (2014). Neutral molecular cluster formation of sulfuric acid–dimethylamine observed in real time under atmospheric conditions. Proceedings of the National Academy of Sciences of the United States of America, 111(42), 15019–15024.
- Larssen, T., Lydersen, E., Tang, D., He, Y., Gao, J., Liu, H., … Luo, J. (2006). Acid rain in China. Environmental Science & Technology, 40(2), 418–425.
- Larssen, T., Seip, H. M., Semb, A., Mulder, J., Muniz, I. P., Vogt, R. D., … Eilertsen, O. (1999). Acid deposition and its effects in China: an overview. Environmental Science & Policy, 2(1), 9–24.
- Laughner, J. L., & Cohen, R. C. (2019). Direct observation of changing NOx lifetime in North American cities. Science, 366(6466), 723–727.
- Lelieveld, J., Evans, J. S., Fnais, M., Giannadaki, D., & Pozzer, A. (2015). The contribution of outdoor air pollution sources to premature mortality on a global scale. Nature, 525(7569), 367–370.
- Li, J., Lu, K., Lv, W., Li, J., Zhong, L., Ou, Y., … Zhang, Y. (2014). Fast increasing of surface ozone concentrations in Pearl river delta characterized by a regional air quality monitoring network during 2006–2011. Journal of Environmental Sciences, 26(1), 23–36.
- Liu, T., Gong, S., He, J., Yu, M., Wang, Q., Li, H., … Zhao, Q. (2017). Attributions of meteorological and emission factors to the 2015 winter severe haze pollution episodes in China’s Jing-Jin-Ji area. Atmospheric Chemistry and Physics, 17(4), 2971–2980.
- Lopez-Hilfiker, F. D., Mohr, C., Ehn, M., Rubach, F., Kleist, E., Wildt, J., … Thornton, J. A. (2014). A novel method for online analysis of gas and particle composition: description and evaluation of a Filter Inlet for gases and AEROsols (FIGAERO). Atmospheric Measurement Techniques, 7(4), 983–1001.
- Ma, J. Z., Xu, X. B., Zhao, C. S., & Yan, P. (2012). A review of atmospheric chemistry research in China: photochemical smog, haze pollution, and gas-aerosol interactions. Advances in Atmospheric Sciences, 29(5), 1006–1026.
- Ma, Z., Hu, X., Sayer, A. M., Levy, R., Zhang, Q., Xue, Y., … Liu, Y. (2016). Satellite-based spatiotemporal trends in PM2.5 concentrations: China, 2004–2013. Environmental Health Perspectives, 124(2), 184–192.
- Manninen, H. E., Mirme, S., Mirme, A., Petäjä, T., & Kulmala, M. (2016). How to reliably detect molecular clusters and nucleation mode particles with neutral cluster and air ion spectrometer (NAIS). Atmospheric Measurement Techniques, 9(8), 3577–3605.
- Mirme, S., & Mirme, A. (2013). The mathematical principles and design of the NAIS – A spectrometer for the measurement of cluster ion and nanometer aerosol size distributions. Atmospheric Measurement Techniques, 6(4), 1061–1071.
- Petäjä, T., Duplissy, E.-M., Tabakova, K., Schmale, J., Altstädter, B., Ancellet, G., … Lappalainen, H. K. (2020). Integrative and comprehensive understanding on polar environments (iCUPE): the concept and initial results. Atmospheric Chemistry and Physics, 20, 8551–8592.
- Petäjä, T., Järvi, L., Kerminen, V.-M., Ding, A., Sun, J., Nie, W., … Kulmala, M. (2016). Enhanced air pollution via aerosol-boundary layer feedback in China. Scientific Reports, 6, 18998.
- Quan, J., Dou, Y., Zhao, X., Liu, Q., Sun, Z., Pan, Y., … Liu, Y. (2020). Regional atmospheric pollutant transport mechanisms over the North China plain driven by topography and planetary boundary layer processes. Atmospheric Environment, 221, 117098.
- Shao, M., Tang, X., Zhang, Y., & Li, W. (2006). City clusters in China: air and surface water pollution. Frontiers in Ecology and the Environment, 4(7), 353–361.
- Smith, J. N., Moore, K. F., McMurry, P. H., & Eisele, F. L. (2004). Atmospheric measurements of sub-20 nm diameter particle chemical composition by thermal desorption chemical ionization mass spectrometry. Aerosol Science and Technology, 38(2), 100–110.
- Sun, J., Zhang, Q., Manjula, C., Zhang, Y., Ng, N. L., Sun, Y., … Worsnop, D. R. (2010). Highly time- and size-resolved characterization of submicron aerosol particles in Beijing using an Aerodyne aerosol mass spectrometer. Atmospheric Environment, 44, 131–140.
- Sun, P., Nie, W., Chi, X., Xie, Y., Huang, X., Xu, Z., … Ding, A. (2018). Two years of online measurement of fine particulate nitrate in the western Yangtze river delta: influences of thermodynamics and N2O5 hydrolysis. Atmospheric Chemistry and Physics, 18(23), 17177–17190.
- Sun, Y. L., Wang, Z. F., Du, W., Zhang, Q., Wang, Q. Q., Fu, P. Q., … Worsnop, D. R. (2015). Long-term real-time measurements of aerosol particle composition in Beijing, China: seasonal variations, meteorological effects, and source analysis. Atmospheric Chemistry and Physics, 15(17), 10149–10165.
- Tan, G.-B., Gao, W., Huang, Z.-X., Hong, Y., Fu, Z., Dong, J.-G., … Zhou, Z. (2011). Vacuum ultraviolet single-photon ionization time-of-flight mass spectrometer. Chinese Journal of Analytical Chemistry, 39(10), 1470–1475.
- Tang, G., Li, X., Wang, Y., Xin, J., & Ren, X. (2009). Surface ozone trend details and interpretations in Beijing, 2001–2006. Atmospheric Chemistry and Physics, 9(22), 8813–8823.
- Tang, L., Qu, J., Mi, Z., Bo, X., Chang, X., Anadon, L. D., … Zhao, X. (2019). Substantial emission reductions from Chinese power plants after the introduction of ultra-low emissions standards. Nature Energy, 4, 929–938.
- Tang, X., Li, J., & Dong, Z. (1989). Photochemical pollution in Lanzhou, China-a case study. Journal of Environmental Sciences (China), 1, 31–38.
- Tian, B., Jing, S., Ma, Y., Tian, W., Gu, X., Zheng, J., … Xu, Y. (1980). Study on photochemical smog pollution in at Xigu distrcit in Lanzhou. Environmental Science (In Chinese), 1(5), 24–30.
- Tong, S., Hou, S., Zhang, Y., Chu, B., Liu, Y., He, H., … Ge, M. (2015). Comparisons of measured nitrous acid (HONO) concentrations in a pollution period at urban and suburban Beijing, in autumn of 2014. Science China. Chemistry, 58(9), 1393–1402.
- Tong, S., Hou, S., Zhang, Y., Chu, B., Liu, Y., He, H., … Ge, M. (2016). Exploring the nitrous acid (HONO) formation mechanism in winter Beijing: Direct emissions and heterogeneous production in urban and suburban areas. Faraday Discussions, 189, 213–230.
- Vanhanen, J., Mikkilä, J., Lehtipalo, K., Sipilä, M., Manninen, H. E., Siivola, E., … Kulmala, M. (2011). Particle size magnifier for nano-CN detection. Aerosol Science and Technology, 45(4), 533–542.
- Wang, G., Zhang, R., Gomez, M. E., Yang, L., Zamora, M. L., Hu, M., … Molina, M. J. (2016). Persistent sulfate formation from London fog to Chinese haze. Proceedings of the National Academy of Sciences of the United States of America, 113((48)), 13630–13635.
- Wang, L. T., Wei, Z., Yang, J., Zhang, Y., Zhang, F. F., Su, J., … Zhang, Q. (2014). The 2013 severe haze over southern Hebei, China: model evaluation, source apportionment, and policy implications. Atmospheric Chemistry and Physics, 14(6), 3151–3173.
- Wang, T., & Kwok, J. Y. H. (2003). Measurement and analysis of a multiday photochemical smog episode in the Pearl river delta of China. Journal of Applied Meteorology, 42(3), 404–416.
- Wang, T., Xue, L., Brimblecombe, P., Lam, Y. F., Li, L., & Zhang, L. (2017a). Ozone pollution in China: a review of concentrations, meteorological influences, chemical precursors, and effects. Science of the Total Environment, 575, 1582–1596.
- Wang, Y., Yu, M., Wang, Y., Tang, G., Song, T., Zhou, P., … Petäjä, T. (2020). Rapid formation of intense haze episodes via aerosol–boundary layer feedback in Beijing. Atmospheric Chemistry and Physics, 20(1), 45–53.
- Wang, Y. S., Teter, J., & Sperling, D. (2011). China’s soaring vehicle population: Even greater than forecasted? Energy Policy, 39(6), 3296–3306.
- Wang, Z., Wang, W., Tham, Y. J., Li, Q., Wang, H., Wen, L., … Wang, T. (2017b). Fast heterogeneous N2O5 uptake and ClNO2 production in power plant and industrial plumes observed in the nocturnal residual layer over the North China plain. Atmospheric Chemistry and Physics, 17(20), 12361–12378.
- Wen, L., Xue, L., Wang, X., Xu, C., Chen, T., Yang, L., … Wang, W. (2018). Summertime fine particulate nitrate pollution in the North China plain: increasing trends, formation mechanisms and implications for control policy. Atmospheric Chemistry and Physics, 18(15), 11261–11275.
- Xue, J., Yu, X., Yuan, Z., Griffith, S. M., Lau, A. K. H., Seinfeld, J. H., & Yu, J. Z. (2019). Efficient control of atmospheric sulfate production based on three formation regimes. Nature Geoscience, 12(12), 977–982.
- Yao, L., Garmash, O., Bianchi, F., Zheng, J., Yan, C., Kontkanen, J., … Wang, L. (2018). Atmospheric new particle formation from sulfuric acid and amines in a Chinese megacity. Science, 361(6399), 278–281.
- Yatavelli, R. L. N., Mohr, C., Stark, H., Day, D. A., Thompson, S. L., Lopez-Hilfiker, F. D., … Jimenez, J. L. (2015). Estimating the contribution of organic acids to northern hemispheric continental organic aerosol. Geophysical Research Letters, 42(14), 6084–6090.
- Yu, H., He, N., Wang, Q., Zhu, J., Gao, Y., Zhang, Y., … Yu, G. (2017a). Development of atmospheric acid deposition in China from the 1990s to the 2010s. Environmental Pollution, 231, 182–190.
- Yu, Q., Zhang, T., Ma, X. X., Kang, R. H., Mulder, J., Larssen, T., & Duan, L. (2017b). Monitoring effect of SO2 emission abatement on recovery of acidified soil and streamwater in southwest China. Environmental Science & Technology, 51(17), 9498–9506.
- Zamora, M. L., Peng, J., Hu, M., Guo, S., Marrero-Ortiz, W., Shang, D., … Zhang, R. (2019). Wintertime aerosol properties in Beijing. Atmospheric Chemistry and Physics, 19(22), 14329–14338.
- Zhang, F., Wang, Y., Peng, J., Chen, L., Sun, Y., Duan, L., … Zhang, R. (2020). An unexpected catalyst dominates formation and radiative forcing of regional haze. Proceedings of the National Academy of Sciences of the United States of America, 117(8), 3960–3966.
- Zhang, J. F., & Samet, J. M. (2015). Chinese haze versus Western smog: Lessons learned. Journal of Thoracic Disease, 7(1), 3–13.
- Zhang, Q., Jiang, X., Tong, D., Davis, S. J., Zhao, H., Geng, G., … Guan, D. (2017). Transboundary health impacts of transported global air pollution and international trade. Nature, 543(7647), 705–709.
- Zhang, Q., Zheng, Y., Tong, D., Shao, M., Wang, S., Zhang, Y., … Hao, J. (2019). Drivers of improved PM2.5 air quality in China from 2013 to 2017. Proceedings of the National Academy of Sciences of the United States of America, 116(49), 24463–24469.
- Zhang, R., Wang, G., Guo, S., Zamora, M. L., Ying, Q., Lin, Y., … Wang, Y. (2015). Formation of urban fine particulate matter. Chemical Reviews, 115(10), 3803–3855.
- Zhang, X. Y., Zhong, J. T., Wang, J. Z., Wang, Y. Q., & Liu, Y. J. (2018). The interdecadal worsening of weather conditions affecting aerosol pollution in the Beijing area in relation to climate warming. Atmospheric Chemistry and Physics, 18(8), 5991–5999.
- Zheng, G. J., Duan, F. K., Su, H., Ma, Y. L., Cheng, Y., Zheng, B., … He, K. B. (2015). Exploring the severe winter haze in Beijing: the impact of synoptic weather, regional transport and heterogeneous reactions. Atmospheric Chemistry and Physics, 15(6), 2969–2983.
- Zheng, X., Lu, Y., Yuan, J., Baninla, Y., Zhang, S., Stenseth, N. C., … Chen, D. (2020). Drivers of change in China’s energy-related CO2 emissions. Proceedings of the National Academy of Sciences of the United States of America, 117(1), 29–36.
- Zhong, J., Zhang, X., Dong, Y., Wang, Y., Liu, C., Wang, J., … Che, H. (2018). Feedback effects of boundary-layer meteorological factors on cumulative explosive growth of PM2.5 during winter heavy pollution episodes in Beijing from 2013 to 2016. Atmospheric Chemistry and Physics, 18(1), 247–258.
- Zhu, W. H., Xu, X. D., Zheng, J., Yan, P., Wang, Y. J., & Cai, W. Y. (2018). The characteristics of abnormal wintertime pollution events in the Jing-Jin-Ji region and its relationships with meteorological factors. Science of the Total Environment, 626, 887–898.