
 ?Mathematical formulae have been encoded as MathML and are displayed in this HTML version using MathJax in order to improve their display. Uncheck the box to turn MathJax off. This feature requires Javascript. Click on a formula to zoom.
ABSTRACT
Under the global health crisis of COVID-19, timely, and accurate epidemic data are important for observation, monitoring, analyzing, modeling, predicting, and mitigating impacts. Viral case data can be jointly analyzed with relevant factors for various applications in the context of the pandemic. Current COVID-19 case data are scattered across a variety of data sources which may consist of low data quality accompanied by inconsistent data structures. To address this shortcoming, a multi-scale spatiotemporal data product is proposed as a public repository platform, based on a spatiotemporal cube, and allows the integration of different data sources by adopting various data standards. Within the spatiotemporal cube, a comprehensive data processing workflow gathers disparate COVID-19 epidemic datasets at the global, national, provincial/state, county, and city levels. This proposed framework is supported by an automatic update with a 2-h frequency and the crowdsourcing validation team to produce and update data on a daily time step. This rapid-response dataset allows the integration of other relevant socio-economic and environmental factors for spatiotemporal analysis. The data is available in Harvard Dataverse platform (https://dataverse.harvard.edu/dataset.xhtml?persistentId=doi:10.7910/DVN/8HGECN) and GitHub open source repository (https://github.com/stccenter/COVID-19-Data).
1. Introduction
As the 2019 novel coronavirus (COVID-19) spreads across the world, there are a plethora of COVID-19 datasets are available. However, current datasets are scattered across a variety of heterogeneous sources, which may consist of low data quality and inconsistent data structures. There is an absence of a unified and high-quality dataset that is accurate, complete, reliable, consistent, timely, and user-friendly, which would be of great research and public interest. To address the limitations of existing datasets, we propose a multi-scale spatiotemporal data product for COVID-19 viral cases.
First, a high-quality dataset should be easy to use with standardized data formats for various data sources and scales. With few exceptions (e.g. Italy), most official governmental bodies display the data on their parochial web sites and/or in official publications, typically with unstructured data formats such as HTML tables, images or PDF documents (Tájékoztató oldal a koronavírusról, Citation2020; Welfare TMoHaF, Citation2020) that are difficult to process for further analyses. Since different agencies have distinct standards of format and structures, a uniform data standard and fusion processing workflow are needed when integrating data across different agencies to ensure consistent data structures and improve data accessibility and usability. There have been some third-party attempts to collect, scrape and cleanse data from original official sources and provide them in structured formats such as Comma Separated Values (CSV) tables and JavaScript Object Notation (JSON) files. However, since the data processing and cleaning procedures typically involve intensive manual efforts, most of these third-party datasets only provide admin0 (country-level) data and/or limited admin1/admin2 data. For example, the Johns Hopkins University dataset (Dong, Du, & Gardner, Citation2020) and CoronaTracker (Hamzah, Lau, & Nazri et al., Citation2020) focus on admin0, while the 1point3acres dataset (1Point3Acres, Citation2020) focuses on admin1/admin2 data of the United States. There are also efforts to collect admin0/admin1 data across European (COVID19-eu-data, Citation2020) and Latin American countries (DataScienceResearchPeru, Citation2020), but none of these datasets has been published for all available admin0/admin1/admin2 regions globally. The final operational dataset in this work focuses on providing the admin1 level data of viral cases of 30 countries/regions, and includes multiscale data in admin0/admin2 from heterogenous data formats and sources.
In addition, some available datasets (COVID19-eu-data, Citation2020; Dong et al., Citation2020) do not include standard keys, such as ISO3 country codes, for all recorded countries or regions, so that the records cannot be easily corresponded with other types of datasets for many potential applications. For instance, calculating mortality rates (e.g. number of deaths per 100,000 population) based on a viral-case dataset and a population dataset would be straightforward if the two datasets share the same standard region keys. Otherwise, matching records between the datasets would cost huge manual efforts. The spread of COVID-19 is influenced and even determined by related factors such as policies (Liu, Ning, & Chen et al., Citation2020), environment (Wang, Tang, & Feng et al., Citation2020), and human activities (Shereen, Khan, & Kazmi et al., Citation2020). For example, Wang (Wang, Jiang, & Gong et al., Citation2020; Wang et al., Citation2020), Liu (Liu, Harris, & Chiu et al., Citation2020; Liu, Liu, & Sha et al., Citation2020; Liu, Sha, & Liu et al., Citation2020), and Ma (Ma, Zhao, & Liu et al., Citation2020) investigated the influence of air temperature and relative humidity on the transmission of COVID-19 and concluded that high temperature and high humidity reduced viral transmission virus. Moreover, standard keys are also important for matching regions with corresponding spatial geographic data in base maps, which is very beneficial for further spatiotemporal analyses. Most existing datasets either do not have spatial information (COVID19-eu-data, Citation2020; DataScienceResearchPeru, Citation2020) or only use center-point coordinates to identify regions (Dong et al., Citation2020; Hamzah et al., Citation2020). In order to facilitate further spatiotemporal analysis (e.g. correlation), modeling, and simulation of the relevant factors under spatial research unit, a spatial data structure with the designed primary key is proposed in this work to integrate data from multiple research domains.
Another critical feature of a valued dataset is data quality control and accuracy validation. Since COVID-19 is a fast-evolving pandemic, health institutes and governments from different countries and regions often adjust standards and methods for data collection to adapt to changing situations, introducing inconsistent, inaccurate, and ancillary data. To ensure high data quality and accuracy, data quality control with anomaly detection and manual checking is necessary during the workflow. More details are discussed within the Technical Validation section of this paper that explores the workflow and process that is essential to maintain the data quality control. It is important to keep the standards consistent and compatible with potential new data sources. Upon investigating existing datasets, we find that most of them do not have a validation process that checks data with official data sources (COVID19-eu-data, Citation2020; DataScienceResearchPeru, Citation2020; Hamzah et al., Citation2020). In our work, we have developed a semi-automatic validation strategy to check the data qualify of daily updated numbers with governmental/official data sources.
To fill the gaps in the above-mentioned limitations of existing COVID-19 datasets, a comprehensive data production workflow is proposed with a reliable and standardized spatiotemporal data format, accuracy data quality control, and consistent and timely operation. The confirmed, death and recovered case data are collected and integrated from various data formats and sources of affected countries (more than 25) of the world in detailed spatial scales. The relevant socio-economic and environmental factors could be integrated into the dataset for further spatiotemporal analysis (Yang, Clarke, & Shekhar et al., Citation2020) to address challenging questions of the pandemic (Yang, Sha, & Liu et al., Citation2020).
2. Methods
2.1. Data Sources
2.1.1. Heterogeneous data sources for viral cases
The collection of country-level data is inspired by the reality that most countries have provided transparent case data (Hu, Guan, & Zhu et al., Citation2020). Some of the most affected countries (e.g. U.S, China, Italy) have drawn the most attention because of their larger case numbers and socio-economic impacts. Efforts are ongoing to acquire data from more countries based on the trend of case numbers and giving a higher priority to the countries with larger case numbers.
Two different data source collections have been developed and listed on the GitHub (). The first is the original datasets which are mostly semi-cleaned and easy to be scrapped. The second is the validation datasets which are the official reports of COVID-19 cases from each country. The validation data are used to compare and check our data to assure data accuracy and legitimacy. However, since most of the official reports are Portable Document Format (PDF) documents or screenshots, using web scrapers to extract them is fraught with problems. Conversely, the accessible data sources to extract the data are used. The time frequency for all collected data sources is daily based and time coverage of all in-operation countries are presented in “start day” of . These multi-scale data products are ready to use from on the GitHub page https://github.com/stccenter/COVID-19-Data and in daily maintenance by National Science Foundation (NSF) Spatiotemporal Innovation Center. The access data sources are under real-time validation and keep updated in the online usage documentation.
Table 1. Access and validation data source by collection scale and region
2.1.2. Basemap for different admin levels
The base map in the COVID-19 case dataset provides the spatial polygon geometric data and location name attributes for produced regions and their subdivision administration, including admin 0/1/2 (). Geographic Data Access Middleware (GADM) is a high spatial resolution database of administrative areas in multi-scale level from community to country (Geographic Data Access Middleware, Citation2020). The GADM provides comprehensive attribute information for locations with a unique identifier for each admin unit and relevant international standard code (e.g. ISO3 for admin 0 of countries and Hierarchical Administrative Subdivision Code (HASC) 1/2 for admin 1 and 2 for subdivision administrations (Law & Hammitzsch, Citation2013)). The ISO3 is the International Organization for Standardization (ISO) 3166-1 alpha-3 code, part of the ISO 3166 standard published by the International Organization for Standardization to better represent each country ((ISO) IOfS, Citation2020). Most regions in certain admin 1 and 2 levels inherit HASC as the primary key from the GADM database (named stc_key in our database) for case table join operation (). To expend more general local identifiers in some regions, local_id is created and attached from other admin base map data sources. For example, the ISO2 code of global region and countries is integrated from the Natural Earth database (Natural Earth, Citation2020), and Federal Information Processing (FIPS) of state and county of the United States is collected and joined from (Topologically Integrated Geographic Encoding and Referencing database) TIGER standard (Marx, Citation1986; Standard SH, Citation1995). Case numbers for some countries are not collected and published based on administrative boundaries (e.g. Scotland, Wales, Portugal, Finland), which have been publishing COVID-19 data based on medical and health zone which integrate several admin units (e.g. Scotland, Wales) or are mainly based on admin units that have slightly different boundaries and constituent sub-regions (e.g. Portugal, Finland). To integrate and present these situations, the spatial polygon merging operation is conducted on a case by case basis for the base map, and the * symbol is used () to show that the base map of the country is processed.
Table 2. Data source for base maps
2.2. Spatiotemporal data collocation framework
To conduct a comprehensive data collection, a spatiotemporal aggregation operation of data cube (Lins, Klosowski, & Scheidegger, Citation2013) is used as a fundamental data structure. The data cube is a multidimensional data structure constructed from different features and attributes and within which data aggregation operations are conducted (Gray, Chaudhuri, & Bosworth et al., Citation1997). The conceptual data collection framework of the spatiotemporal data cube, including location, time, and other data attribute dimensions, is illustrated (). Only two-dimensional space is considered for the region.
Figure 1. Spatiotemporal data cube as a data collection framework
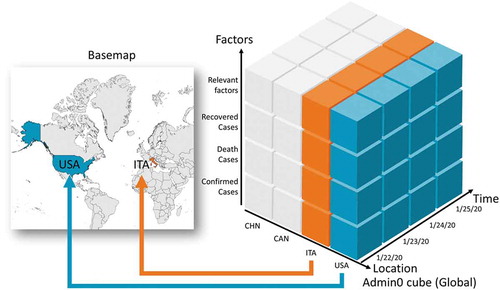
Three spatial scales in the dataset are used based on the fine granule of reported viral cases. Usually, a statistical summary of daily cases is reported at the country, state/province, and county/city level, and these three administration levels are defined as admin0, 1, and 2, in series. The spatial region coverage differs in scales. For country-level scale admin 0, a total of 250 countries or regions are collected. For state or province scale admin1, the top 50–100 countries ordered by accumulated confirmed case numbers are included (); more countries and regions are in the plan for publishing (Supplementary material Appendix S1). For the finest spatial scale, admin 2-county/city level, the top 20 affected countries are listed, and the data acquisition difficulty and policy transparency are considered in the ranking. To date, these countries include China, the United States of America (USA), Italy, Spain, and the United Kingdom (UK).
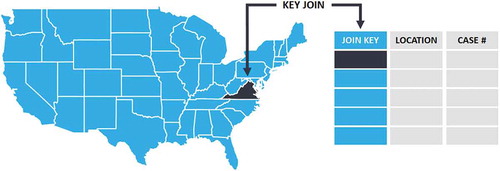
For specific spatial coverage, the numbers of viral case are collected in three dimensions: location, time, and variables. For the location dimension, a location-based attribute is used as a primary key (e.g. ISO3 in admin0, HASC code in admin1) to join with the spatial data structure in the base map. The blue and orange lines () show a join and matching approach between the key and relevant spatial boundaries.
For the temporal dimension, the time series starts from the first day the virus is observed. The time interval could be different according to the raw data source. For most countries, daily is the basic scale for time, while some countries may report data by week (e.g. France).
The factors dimension illustrates multiple attributes and variables from domain-specific measurement, including the confirmed, mortality, and recovered case number from public health statistics. Also, included related factors as follows: policy stringency index that shows the lockdown level for regions in a scale (Hale et al., Citation2020) and applied to the global and USA cases (Yang et al., Citation2020); environmental factors having an impact on the spread of COVID-19 (e.g. temperature, humidity, air quality, nighttime light); medical resource factors affecting the deficiencies of the health system (Sha, Miao, & Lan et al., Citation2020); and social-economics factors changed due to the pandemic (e.g. demographic data, Gross Domestic Product (GDP), social distancing). These factors have spatial and temporal characteristics and are mapped into the cube.
2.3. Processing workflow
The processing workflow of COVID-19 case data, including data acquisition, standardization, quality control, data storage, releasing, and sharing to the public is illustrated (). The following sections introduce the technical details of each part.
Figure 2. Data processing workflow
2.3.1. Data acquisition
Data for countries and regions are collected from external sources with varying formats, and the scripts of data acquisition are adjusted for each source to automatically gather the data. In cases when data acquisition cannot be automated, manual records are added to the database.
Data formats commonly use spreadsheets (e.g. CSV, Excel, Google Sheets), PDF, static or dynamic web pages, and JSON. For structured data (e.g. spreadsheets, JSON), the workflow is straightforward. Structured tabular data from spreadsheets are stored in wide or long formats. Long format tables contain columns corresponding to date, location, and numbers of confirmed/death/recovered cases. Since the long format is consistent with that of the daily report used in our database, the data are expeditiously processed by identifying the columns and matching the location names with ISO3, HASC code, or local IDs. Conversely, wide-format tables usually include multiple columns corresponding to different locations or dates, which must be converted to a long format before processing.
The JSON is a widely used format for structured data, typically provided as standalone JSON files or via API by the sources. The JSON objects are converted to tabular data by identifying the keys corresponding to date, locations, and case numbers.
Structured data formats like CSV and JSON are preferred. However, such files are not always available, and sometimes data must be scraped from web pages. For static pages, a Hypertext Transfer Protocol (HTTP) request is performed to retrieve Hypertext Markup Language (HTML) data from the web page. Subsequently, various tools can be used to harvest the data from HTML content. For instance, a Python package “Beautiful Soup” is used to parse HTML, filter relevant HTML elements, and extract information from those elements. Thereafter, the relevant information is stored as CSV files.
Some data on web pages are dynamically loaded with JavaScript and therefore not accessible in the requested HTML of the target web page. One way to scrape data from dynamic pages is via reverse engineering (i.e. identifying and manually analyzing JavaScript codes responsible for retrieving data). This approach is commonly difficult to implement especially when the relevant JavaScript codes are minified and/or generated using a higher-level framework like React.js. because the codes were less readable. For those cases, headless browser rendering tools (e.g. Selenium) generate static HTML content for dynamic pages. Thereafter, the workflow for static web pages is appropriate as described above.
Given the wide range of data sources and formats, data instability is a challenge for automated processing scripts. For example, many source websites update content logic frequently resulting in unexpected script errors. To reduce the cost of maintenance, robust programming allows the maximum tolerance from data sources based on a re-evaluation of the data source. Alternatively, the data noise is inevitable, which necessitates data cleaning and standardization as discussed in the following section.
2.3.2. Data cleaning and standardization
After data acquisition, the gathered information needs to be cleaned and standardized. Given the random noise from raw data, cleaning and extracting information is the priority followed by several approaches to match the data from different standards. Finally, the results of the above are mapped to the expected field ().
Figure 3. Data standardization process
Data noise usually comes from an aggressive strategy of data acquisition, reflecting the aspiration to retain as much information as feasible. This necessitates a methodology to intelligently remove data regarded as extraneous. For instance, data collected from HTML tables (e.g. BNONews) oftentimes contain extra columns with repeated data fields typically identified by the errors in the script log.
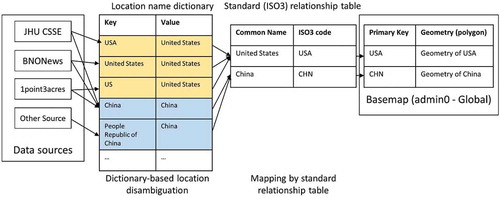
Raw data gathered from web sources have different structural standards, a common issue in the data flow. The admin names in most source data are not matched to the unique location name/key, so the procedure of data standardization is necessary to combine and join the admin name with the well-designed primary keys. Named entity disambiguation is a major task in standardization to solve “unmatching” issues. Data sources have unique/unusual ways to define the location names (), and multiple reasons cause the field names to be unmatched. For example, the choice of a full name or an abbreviation of location (e.g. “USA”, “United States of America”), translation/transliteration standard (e.g. “Macau” and “Macao”), and coding principles from other languages vary widely. To address this problem, a mapping process matches the field name from web data to a unified standard. A simple solution is to semi-automatically construct a mapping dictionary to filter and correct field names. It is commonplace to translate/transliterate the name-value first in cases where the source is non-English speaking countries. Since using various dynamic data sources, this approach requires anomaly detection to backtrack the unmatched cases and enter them into the dictionary. Thus, the dictionary is improved as the number of iterations increases.
Many special cases are treated separately. For instance, Trentino-Alto Adige is an admin1 region in Italy composed of two admin2 autonomous provinces – Trentino and Bolzano (South Tyrol). Because Trentino-Alto Adige has limited powers, the administrative powers default to the two constituent provinces, which are separated Territorial Units for Statistics (NUTS-2) regions. As a result, data from the two provinces are bundled at the same level as other admin1 regions in Italy’s official COVID-19 dataset. To make the data consistent with HASC codes and the scale of the base map, case data for Trentino-Alto Adige based on official data of the two provinces are manually computed. In another example, data from the United Kingdom (UK) requires special consideration since two of the four constituent countries of the UK, Scotland, and Wales report case data form health boards rather than local authorities (admin2). Health boards provide services to several local authorities, requiring a special level of distinction between admin1 and admin2.
After matching source data to a common name, standard relation tables are used to map common names to the base map primary key. ISO3 country code standard is adopted for admin0 regions, while HASC code is adopted for admin1 or 2 regions, with a STC_key as the primary key. In other cases where ISO3 and HASC code are not available, local commonly used codes are utilized as the primary key. For instance, the official administrative division codes of the People’s Republic of China (GB/T 2260) are used for admin2 regions in China.
Another common issue in standardization is that sometimes the required data fields are missing in the original data source. In those occasions, they can be computed using daily case numbers or data records for individual patients if such data are available. In the first case cumulative case numbers are calculated by summing daily case numbers from all dates up to a specific date. In the second case, daily numbers are calculated by identifying patients with specific location and date and computing cumulative numbers from the daily numbers.
2.3.3. Data storage
The database’s “ID” attribute is an automatically generated number that increases by one each time a new record is added (). This “ID” number is uniquely assigned to a record and serves as the record’s identification number. “Date” is the record date, and because of time zone differences, the data are posted for the past 24 hours in Coordinated Universal Time (UTC). Admin0_name, admin1_name, and admin2_name are country names, province/state names, and county names for each record. Admin1_stckey and Admin2_stckey are the keys to pair our admin1 level and admin2 level data to base maps for each country. Commonly Admin1_stckey and Admin2_stckey are the same as the HASC value, but if HASC is not available the local ID is used. As for admin1_hasc and admin2_hasc, HASC stands for “hierarchical administrative subdivision codes”, a unique number representing the name of country subdivisions. Confirmed, death, and recovered are the case data for different admin levels.
Figure 4. Unified Modeling Language (UML) of the designed database schema
3. Data records
Three types of COVID-19 case data were collected, containing the following: 1) confirmed COVID-19 cases based on laboratory tests; 2) death cases documenting mortality among patients who tested positive for COVID-19; 3) recovered cases of patients who recovered without any use of fever-reducing medication and improvement in respiratory symptoms (according to CDC standard) (CDCgov, Citation2020). Both confirmed and mortality cases are produced from the published region and admin-level, whereas recovered cases may be missing based on the data source. Except for the above-mentioned attributes, other metrics for COVID-19 cases are available for certain country admin. For example, Italy, China, and the United States provide more case attributes, including those that are suspected, tested, hospitalized, and critical (CDCgov, Citation2020; Surveillances, Citation2020; Zoia, Bongetta, & Veiceschi et al., Citation2020). These attributes are summarized by different medical and regional standards, so the case number of suspected, tested, hospitalized, and critical is not collected and integrated.
The dataset is combined with case number table files and relevant geospatial base map. A conceptual data form and the relationship of its components is illustrated () using USA admin1 as an example. Collected COVD-19 case data are processed and published in a table format including daily cases and summarized time-series reports. Each published table sheet contains attributes of location, name, and key (JOIN KEY in ) enabling a spatial connection to the attached base map in geospatial data format. The base map is created based on the boundary polygon of the certain spatial region and admin level. The admin-level is divisible into three types based on spatial scales, where admin 0/1/2 refers to country/region level, state/province level, and county/city level in series. The admin-level is not an absolute definition for all study areas (e.g. the admin 1/2 for Italy refers to region and province based on local definition, respectively). All the spatial and admin statistical standards are derived from official reports. The discussion of base map sources, definition, and location key selection for each country and admin level is discussed in Section 2.1.2.
Figure 5. Conceptual data form of COVID-19 case product
Daily viral case reports provide cumulative viral cases including those that are confirmed, dead, and recovered as well as corresponding geo-attributes at different admin levels (). The global daily report tabulates case information worldwide. Each row in the report represents one country, and each country-level daily report has two parts, one illustrating the admin1 level and the other admin2 level. For example, both state- and county-level reports are provided to support data analysis in the USA. As of the time of drafting this paper on August 11, 2020, viral cases from 27 countries are collected and published in the data repository.
Table 3. Metadata of daily report
Similar to the daily viral case reports, the summarized time-series report has three administrative levels – admin0 (global), admin1, and admin2. Differing from the daily reports, the time-series summaries are generated separately for confirmed, death, and recovered cases. For example, the summarized report of confirmed cases is a time series of confirmed cases to support temporal trend analysis ().
Table 4. Metadata of summary report
4. Technical validation
4.1. Quality standard
To provide a reliable spatiotemporal cube for COVID-19, data quality in the data population process is evaluated in three dimensions: data integrity; consistency; and validity. Data integrity requires data to be complete and comprehensive, data consistency confirms that data in the cube are consistent with other sources, and data validity measures the justifiability of the data.
From the perspective of data integrity, every COVID-19 case record in the spatiotemporal cube has temporal (reported time) and spatial information (admin0/admin1/admin2 name and code). Each spatial component in the multiple admin levels has daily case records since the date of the first infected case. For data consistency, the cube provides multi-level and multi-view data reports, including a daily summary of state/county level viral cases. Information (e.g. state name, HASC code, confirmed case number) should be consistent among different reports. Confirmed/death/recovered numbers should be consistent with the validation data sources (e.g. World Health Organization (WHO) data for admin0 data in our collection). Finally, data validity is important in quality control (e.g. negative numbers of confirmed/death/recovered cases are forbidden in the data cube).
When other factors related to the viral case in the spatiotemporal context (e.g. environmental, social-economic) are added to the cube, data quality control uses the same strategy. From the perspective of data integrity, a thorough check of the time-series of the source, which provides historical records, is required. For data consistency, a daily check of each source is conducted to confirm that all extracted data are consistent with the source. Data validation is conducted to compare the source with a different but related data set.
4.2. Semi-automatic validation workflow
For data quality control, certain steps are required to validate data (). The process is critical for crowdsourcing data, starting with verifying the sources, which must be governmental/official sources with high authenticity. A source collection team estimates the availability and reliability of a data source and the web scraping team assess the feasibility of crawling data from the source. Once a source is validated, the web scraping team develops a corresponding data crawler. After validating the crawler can successfully and accurately crawl data from the source, the crawler script was then run by 2-h frequency to collect data and generate multi-level administration case reports.
Figure 6. Crowdsourcing-based data validation diagram
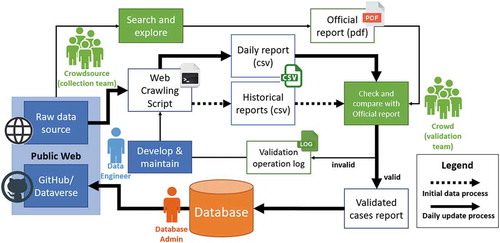
These reports need to be semi-automatically checked by the anomaly detection script and validation team according to the quality standards before storing in a database. The anomaly detection script is developed to automatically check the daily cases and alert to validation team according to abnormal rules, including 1) the case number should not decrease for each day; 2) the case number of all regions in a country should not keep the same as the previous day; 3) a 3-time increase of new cases will be identified and be reported and 4) the daily death/recovered cases should be less than confirmed cases. The manual validation strategy differs by the level of admin scale, specifically:
Admin0: the new daily admin0 report is manually compared to the WHO data source listed in by the validation team;
Admin1: the new admin1 reports (e.g. 51 cumulative state-level confirmed cases of USA) are manually compared to validation data listed in by the validation team;
Admin2: Admin2 records are too large to be manually checked, thus data analyses scripts are developed to calculate statistical information (e.g. aggregate admin2 data to admin1) to compare the data trend with high administration level data trend in the validation data sources.
Once the data are valid and operational, the validated case report is handed to the database administration which stores the data in the database. It is worth mentioning in operational mode. Most of the alert and incorrectness came from the technique and maintenance issue of web crawler data sources. The validation team keeps the logs of checking status including wrong data records and corrected data sources. These logs will be reformatted and published in a data description document in the online repository in the future. Once in the database, the validated case report is uploaded by the database administration to the official GitHub/Dataverse, which is accessible to the public. These steps ensure a validated source and data set, offering certainty and confidence.
5. Usage notes
5.1. Data access and sharing
The data products are released and shared on both GitHub and Harvard Dataverse (https://dataverse.harvard.edu/). Harvard Dataverse is an online data repository where research data are shared, preserved, Retrieved, explored, and analyzed. The published data have Digital Object Identifier (DOI) 10.7910/DVN/8HGECN and is open to all communities. Moreover, the datasets are accessible permanently. The GitHub provides an automatic data staging and publication region connected to the accounts of the database manager, which is maintained and updated promptly. To maintain consistency, each data file is released simultaneously at GitHub and Harvard Dataverse.
The spatiotemporal data cube is stored in a GitHub repository (https://github.com/stccenter/COVID-19-Data) on a daily time step. As one of the most popular open-source communities, GitHub is a solution for data consumers and application developers to share data and codes. Publishing the data cube on GitHub assures data release and sharing and facilitates the following: 1) allows data consumers to report issues/problems through the GitHub repository; 2) allows data consumer to folk or mark the repository to trace data update for timely analysis; and 3) allows data analysis code (e.g. data visualization), to be published with data to facilitate the data cube’s utility in research and policy matters.
For regions and countries with internal disputes and sensitive regions or areas, that part of data is not included in the published datasets. It is suggested that users contact the authors directly if there is an interest in data from controversial regions.
5.2. Index calculation use case
The data cube can be used to calculate various indices, which are useful indicators of virus spread under different circumstances, such as:
Daily new cases: Number of new confirmed/death/recovered cases compared to the previous day, which can be computed by subtracting the total number of cases reported the previous day from the total number of cases reported the present day.
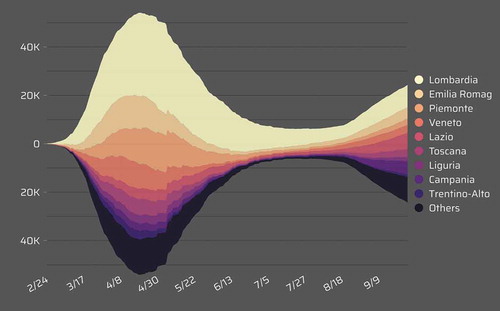
Active cases: Number of cases who have been diagnosed with the virus, but have not died or recovered from it, which can be computed by subtracting the total number of deaths and recovered cases from the total number of confirmed cases. As an example, active cases in admin1 regions of Italy from Feb. 24 to Sep. 26 are shown in . The second rising peak of confirmed cases could be easily identified after Aug. 18 from the line chart visualization, and the active increased much in most of the admin 1 region of Italy.
Case fatality rate (CFR): Proportion of total number of death cases compared to the total number of confirmed cases.
Case doubling time: Number of days it takes for the number of cases to double in size. Assuming a constant growth rate, the case doubling time can be estimated by
, where N1 and N2 are the number of cases reported on day t1 and t2, respectively.
Basic reproduction number (R0): Based on a simple Susceptible-Exposed-Infected-Recovered (SEIR) model, R0 can be estimated by
Figure 7. Evolution of active cases in admin1 regions of Italy from Feb. 24 to Sep. 26
Supplemental Material
Download MS Word (229.9 KB)Acknowledgments
The research presented in this paper was funded by the National Science Foundation (1841520 and 1835507).
Disclosure statement
No potential conflict of interest was reported by the authors.
Data availability statement
The data cube described in this article is openly available on GitHub at https://github.com/stccenter/COVID-19-Data and Harvard Dataverse at https://dataverse.harvard.edu/dataset.xhtml?persistentId=doi:10.7910/DVN/8HGECN under CC-BY license.
Supplementary material
Supplemental data for this article can be accessed here
Additional information
Notes on contributors

Dexuan Sha
Dexuan Sha is a PhD Candidate on Earth Systems and Geoinformation Sciences (ESGS) in the Department of Geography and Geoinformation Sciences, College of Science, George Mason University. His primary research focuses on the core area of high-performance computing for distributed big data processing, cloud-based cyberinfrastructure, object-based image analysis, classification and segmentation from high spatial resolution image and geographic information science, deep learning and remote sensing.

Yi Liu
Yi Liu is a Ph.D. student in Aerospace and Mechanical Engineering at University of Notre Dame. He obtained his bachelor's degree in Automotive Engineering from Tongji University in China, and master's degree in Mechanical and Aerospace Engineering from Syracuse University. His current research focuses on high-fidelity computational fluid dynamics and high-performance computing, with applications in direct aeroacoustic simulations.

Qian Liu
Qian Liu is a PhD Candidate on Earth Systems and Geoinformation Sciences (ESGS) in Department of Geography and Geoinformation Sciences, College of Science, George Mason University. Her primary research focuses on the core area of geographical events detection and segmentation, machine learning applications in natural phenomena, precipitation data downscaling, global precipitation climatology analysis, remote sensing and geographical data fusion, geographic information science and remote sensing.

Yun Li
Yun Li is a PhD candidate of GGS department of GMU and her research focuses on the Earth data discovery, high performance computing, and outreach to spatial temporal analytics for environmental and climate data. She has worked as co-investigator for several R&D projects funded by NASA and NSF. The MUDROD Earth data discovery project, in which she served as the one of the lead developers, leveraging machine learning algorithms to improve data discovery in the Earth science domain. The Planetary Defense project she attended leveraged the advanced framework proposed in the MUDROD project to serve the PD domain for data discovery, analysis and visualization. She also worked as one of the developers for STCSpark, which aims to provide a high-performance framework for vector data analysis. She is the author and co-author of 10 papers introducing her researches in these research projects.

Yifei Tian
Yifei Tian has been working as a data administrator and developer in NSF Spatiotemporal Innovation Center. He received his master degree of Applied information technology with a concentration in Data Analytics and Intelligence Methods at George Mason University. He obtained his bachelor's degree in Management Information System at University of Georgia. Currently working on COVID-19 case data, social economic data, database, and web service platforms.

Fayez Beaini
Fayez Beaini has been working as an intern for the NSF Spatiotemporal Innovation Center. He is currently working on his biomedical undergraduate at George Mason University. He deals with quality control of COVID-19 regional data of countries around the world. He also manages a small team of volunteers which aid him in collecting data for various uses.

Cheng Zhong
Cheng Zhong is a M.S student at George Mason University major in computer science. He has been working as a software engineer in NSF Spatiotemporal Innovation Center, a collaboration among GMU, Harvard, and UCSB. His current research mainly focuses on map reduce application in mining mass datasets.

Tao Hu
Tao Hu is the post-doctoral fellow at Harvard Center for Geographic since July, 2019. He is working on the Spatial Data Lab project. Before that, he was a post-doctor researcher at Kent State University since 2016. He received Ph.D. and B.S in GIS from Wuhan University. His primary research field is GIScience with a focus on geospatial data analytics, spatiotemporal analysis with applications to urban crimes, public health, and innovation studies. He has more than 20 peer-reviewed publications and also served as a peer reviewer for more than 10 international journals.

Zifu Wang
Zifu Wang is a Ph.D student of Geographic Information Science at George Mason University. He has been working as a GRA in NSF Spatiotemporal Innovation Center, a collaboration among GMU, Harvard, and UCSB. His research focuses on Cloud Computing and Big Data analysis which improves the efficiency of computing tools on Geo-science fields.

Hai Lan
Hai Lan is senior research scientist at George Mason University and the assistant director of the NSF Spatiotemporal Innovation Center, GMU site. He is passionate about exploring innovative solutions to geospatial issues in earth science, environmental science and urban study. Specifically, his research interests include big geospatial data analytics, high performance cloud computing, data mining, complex systems modeling, geo-simulation and geo-visualization. He has been funded as Co-PI and graduate research assistant in multiple interdisciplinary research projects funded by various sponsors, including Microsoft, NASA and NSF etc. He is an active researcher and he publishedseveral peer reviewed papers on different scientific journals and conference proceedings.

You Zhou
You Zhou is a Master graduate of George Mason University majoring in Industrial/Organizational Psychology, and she will attend University of Minnesota for doctoral study starting from Fall 2020. During her time in George Mason University, she participated in the NSF Spatiotemporal Innovation Center COVID-19 rapid response project, in which she helped collecting socioeconomic data, such as US state-level policy in combating COVID-19.

Zhiran Zhang
Zhiran Zhang is a PhD student in School of Resource and Environmental Sciences, Wuhan University. She is a visiting student in Department of Geography and Geoinformation Science, George Mason University. Her primary research mainly focuses on the spatiotemporal analysis methods and machine learning applications in location recommendation.

Chaowei Yang
Chaowei Phil Yang is Professor at George Mason University and the founding Director of the NSF Spatiotemporal Innovation Center, a collaboration among GMU, Harvard and UCSB (phase 1). His research focuses on utilizing spatiotemporal principles/patterns to optimize computing infrastructure to support science discoveries and engineering development. He has been funded as PI by multiple resources such as NSF and NASA with over $10M expenditures. He also participated/participates in several large projects total over $40M. He published over 300 papers, edited six books and 10+ special issues for international journals. His publications have been among the top five cited and read papers of IJDE and CEUS. His PNAS spatial computing definition paper was captured by Nobel Intent Blog in 2011.
References
- 1Point3Acres. (2020). COVID-19 in US and canada: real time updates with credible sources. [Retrieved 2020 May 1, 2020]. https://coronavirus.1point3acres.com/
- Africa DSSARoS. (2020). Statistics South Africa. http://www.statssa.gov.za/
- Austria FMRo. (2020). Coronavirus [Retrieved April 1, 2020]. https://www.sozialministerium.at/Informationen-zum-Coronavirus/Neuartiges-Coronavirus- (2019-nCov).html
- Bolivia Go. BoliviaSegura COVID-19 2020 [July 1, 2020]. https://www.boliviasegura.gob.bo/
- BRASIL C. (2020). Painel Coronavírus [Retrieved March 1, 2020]. https://covid.saude.gov.br/
- Canada Go. Coronavirus disease (COVID-19) 2020 [Retrieved March 1, 2020]. https://www.canada.ca/en/public-health/services/diseases/coronavirus-disease-covid-19.html
- Cao, Z., Zhang, Q., Lu, X., Pfeiffer, D., Jia, Z., Song, H., & Zeng, D. D. (2020). Estimating the effective reproduction number of the 2019-nCoV in China. MedRxiv.
- (CDC) CfDCaP. (2020). Coronavirus disease 2019 (COVID-19) Cases in the U.S.. Retrieved 2020 March 1, 2020. https://www.cdc.gov/coronavirus/2019-ncov/cases-updates/cases-in-us.html
- CDCgov. (2020). Characteristics of health care personnel with COVID-19—United States, February 12–April 9, 2020. https://wwwcdcgov/mmwr/volumes/69/wr/pdfs/mm6915e6-Hpdf.
- centrs Spuk. (2020). COVID-19 apstiprināto un aktīvo gadījumu skaits pa administratīvajām teritorijām. Retrieved April 1, 2020. https://data.gov.lv/dati/eng/dataset/covid-19-pa-adm-terit
- China NHCotPsRo. Daily report of China 2020 Retrieved 2020 March 1, 2020. http://www.nhc.gov.cn/xcs/yqtb/list_gzbd.shtml
- Coronavirus Albania. (2020). Retrieved April 1, 2020. https://coronavirus.al/statistika/
- Coronavirus disease. (2020) (COVID-2019) situation reports [InternetR]. Retrieved March 1, 2020. https://www.who.int/emergencies/diseases/novel-coronavirus-2019/situation-reports.
- Coronavirus Locations: COVID-19 Map by County and State [Internet]. (2020). Retrieved March 1, 2020. https://usafacts.org/visualizations/coronavirus-covid-19-spread-map/.
- COVID19 Albanian data repository. (2020). Retrieved April 1, 2020. https://github.com/lucil/covid19-albanian-data
- COVID-19 Japan Anti-Coronavirus Dashboard. (2020). Retrieved March 1, 2020: https://www.stopcovid19.jp/
- COVID19-eu-data. (2020). Retrieved March 1, 2020: https://github.com/covid19-eu-zh/covid19-eu-data
- Croatia GotRo. (2020). Croatian institute of public health. Retrieved March 1, 2020. https://koronavirus.hr/
- DataScienceResearchPeru. (2020). Latin America COVID-19 data repository by DSRP https://github.com/DataScienceResearchPeru/covid-19_latinoamerica
- Dati, C. P. 2020. COVID-19 Italia Retrieved March 1, 2020: https://github.com/pcm-dpc/COVID-19
- Dong, E., Du, H., & Gardner, L. (2020). An interactive web-based dashboard to track COVID-19 in real time. The Lancet Infectious Diseases, 20(5), 533–534.
- Folkhälsomyndigheten. Folkhälsomyndigheten COVID 19 dashboard (2020). Retrieved March 1, 2020. https://experience.arcgis.com/experience/09f821667ce64bf7be6f9f87457ed9aa
- Geographic Data Access Middleware [Internet]. (2020). http://www.gadm.org.
- Gray, J., Chaudhuri, S., Bosworth, A., Layman, A., Reichart, D., Venkatrao, M., ... & Pirahesh, H. (1997). Data cube: A relational aggregation operator generalizing group-by, cross-tab, and sub-totals. Data Mining and Knowledge Discovery, 1(1), 29–53.
- group DSfSIr. (2020). Coronavirus COVID-19 (2019-nCoV) data repository for South Africa. [Retrieved March 1, 2020]. https://github.com/dsfsi/covid19za
- Guatemala Go. (2020). Situation of COVID-19 in Guatemala. Retrieved July 1, 2020]. . https://tablerocovid.mspas.gob.gt/
- Haiti MoPHo. (2020). Retrieved May 1, 2020: https://mspp.gouv.ht/newsite/documentation.php
- Hale, T., Petherick, A., Phillips, T., & Webster, S. (2020). Variation in government responses to COVID-19. Blavatnik school of government working paper. 31.
- Hamzah, F. B., Lau, C., Nazri, H., Ligot, D. V., Lee, G., Tan, C. L., ... & Chung, M. H. (2020). CoronaTracker: Worldwide COVID-19 outbreak data analysis and prediction. Bulletin of the World Health Organization, 1, 32.
- Health AGDo. (2020). Coronavirus (COVID-19) current situation and case numbers. Retrieved March 1, 2020: https://www.health.gov.au/news/health-alerts/novel-coronavirus-2019-ncov-health-alert/coronavirus-covid-19-current-situation-and-case-numbers
- Hu, T., Guan, W., Zhu, X., Shao, Y., Liu, L., Du, J., ... Bao, S. (2020). Building an open resources repository for COVID-19 research. Data and Information Management, 4(3), 130–147. doi:10.2478/dim-2020-0012
- India MoHaFWGo. (2020). COVID-19 INDIA. Retrieved April 1, 2020. https://www.mohfw.gov.in/
- Institut, R. K. (2020). Coronavirus SARS-CoV-2Retrieved March 1, 2020. https://www.rki.de/DE/Content/InfAZ/N/Neuartiges_Coronavirus/Fallzahlen.html
- Institut SS. Overvågning af COVID-19. (2020). Retrieved April 1, 2020. https://www.ssi.dk/sygdomme-beredskab-og-forskning/sygdomsovervaagning/c/covid19-overvaagning
- (ISO) IOfS. (2020). ISO 3166 COUNTRY CODES March 1, 2020. https://www.iso.org/iso-3166-country-codes.html
- Law, G., & Hammitzsch, M. (editors). (2013). Hierarchical administrative subdivision codes. Proceedings of the 10th International ISCRAM Conference, Baden-Baden, Germany, May 2013.
- Lins, L., Klosowski, J. T., & Scheidegger, C. (2013). Nanocubes for real-time exploration of spatiotemporal datasets. IEEE Transactions on Visualization and Computer Graphics, 19(12), 2456–2465.
- Liu, Q., Harris, J. T., Chiu, L. S., Sun, D., Houser, P. R., Yu, M., ... & Yang, C. (2020). Spatiotemporal impacts of COVID-19 on air pollution in California, USA. Science of the Total Environment, 750, 141592.
- Liu, Q., Liu, W., Sha, D., Kumar, S., Chang, E., Arora, V., ... & Zhang, Z. (2020). An environmental data collection for COVID-19 pandemic research. Data, 5(3), 68.
- Liu, Q., Sha, D., Liu, W., Houser, P., Zhang, L., Hou, R., ... & Yang, C. (2020). Spatiotemporal patterns of COVID-19 impact on human activities and environment in Mainland China using nighttime light and air Quality data. Remote Sensing, 12(10), 1576.
- Liu, Y., Ning, Z., Chen, Y., Guo, M., Liu, Y., Gali, N. K., ... & Liu, X. (2020). Aerodynamic characteristics and RNA concentration of SARS-CoV-2 aerosol in Wuhan hospitals during COVID-19 outbreak. BioRxiv.
- Ma, Y., Zhao, Y., Liu, J., He, X., Wang, B., Fu, S., ... & Luo, B.. (2020). Effects of temperature variation and humidity on the death of COVID-19 in Wuhan, China. Science of the Total Environment, 138226. doi:10.1016/j.scitotenv.2020.138226
- Marx, R. W. (1986). The TIGER system: Automating the geographic structure of the United States census. Government Publications Review, 13(2), 181–201.
- Mexico MoH. Información Internacional y Nacional sobre nuevo Coronavirus (COVID-2019) 2020 [April 1, 2020]. Available from: https://www.gob.mx/salud/documentos/informacion-internacional-y-nacional-sobre-nuevo-coronavirus-2019-ncov
- Natural Earth [Internet]. (2020). Retrieved March 1, 2020]. Available from: https://www.naturalearthdata.com/.
- (NCDC) NCfDC. (2020). COVID-19 NIGERIA. Retrieved May 1, 2020: https://covid19.ncdc.gov.ng/
- Nigeria Novel, O. S. Coronavirus (COVID-19) public dataset GitHub2020. Retrieved May 1, 2020: https://github.com/Kamparia/nigeria-covid19-data
- Pakistan Go. Pakistan COVID-19 dashboard. (2020). Retrieved July 1, 2020. http://covid.gov.pk/stats/pakistan
- Preda, G. (2020). COVID_19_ro. Retrieved May 1, 2020: https://github.com/gabrielpreda/covid_19_ro
- (RBH) RdbdH. (2020). Listed cases of COVID-19 in Haiti[Retrieved May 1, 2020. https://www.coronahaiti.org/
- Romania IAMso. (2020) Retrieved May 1, 2020. https://www.mai.gov.ro/category/comunicate-de-presa/
- Salud, M. (2020). Casos confirmados en Chile COVID-19. [Retrieved April 1, 2020. https://www.minsal.cl/nuevo-coronavirus-2019-ncov/casos-confirmados-en-chile-covid-19/
- Saúde, M. (2020). COVID19-Brazil-timeseries. Retrieved March 1, 2020. https://github.com/elhenrico/covid19-Brazil-timeseries
- Sha D, Miao X, Lan H, Stewart K, Ruan S, Tian Y. (2020). Spatiotemporal analysis of medical resource deficiencies in the US under COVID-19 pandemic. PLoS ONE 15(10), e0240348. doi:10.1371/journal.pone.0240348.
- Shereen, M. A., Khan, S., Kazmi, A., Bashir, N., & Siddique, R. (2020). COVID-19 infection: Origin, transmission, and characteristics of human coronaviruses. Journal of Advanced Research. doi:10.1016/j.jare.2020.03.005
- Standard SH. (1995). Federal information processing standards publicatio 180-1. National institute of standards and technology. 17, 15.
- Surveillances, V. (2020). The epidemiological characteristics of an outbreak of 2019 novel coronavirus diseases (COVID-19)—China, 2020. China CDC Weekly, 2(8), 113–122.
- sweden Tphao. (2020). Retrieved March 1, 2020. https://www.folkhalsomyndigheten.se/the-public-health-agency-of-sweden/
- Tájékoztató oldal a koronavírusról. (2020). Retrieved April 1, 2020.
- Ukraine NSaDCo. (2020). Coronavirus epidemic monitoring system . https://covid19.rnbo.gov.ua/
- Wang, J., Tang, K., Feng, K., & Lv, W. (2020). High temperature and high humidity reduce the transmission of COVID-19. SSRN 3551767.
- Wang, M., Jiang, A., Gong, L., Luo, L., Guo, W., Li, C., ... & Chen, Y. (2020). Temperature significant change COVID-19 Transmission in 429 cities. MedRxiv.
- Welfare TMoHaF. COVID-19 REST API for India. (2020). [Retrieved April 1, 2020]. Available from: https://api.rootnet.in/
- Yang, C., Clarke, K., Shekhar, S., & Tao, C. V. (2020). Big spatiotemporal data analytics: a research and innovation frontier. Taylor & Francis.
- Yang, C., Sha, D., Liu, Q., Li, Y., Lan H., Guan, W. W., Hu, T. (2020). Taking the pulse of COVID-19: A spatiotemporal perspective. International Journal of Digital Earth, 13(10), 1186-1211.
- Yuan, D. X. (2020). COVID-19/2019-nCoV infection time series data warehouse. Retrieved 2020 February 10, 2020. https://github.com/BlankerL/DXY-COVID-19-Data
- Zoia, C., Bongetta, D., Veiceschi, P., Cenzato, M., Di Meco, F., Locatelli, D., ... & Fontanella, M. M. (2020). Neurosurgery during the COVID-19 pandemic: Update from Lombardy, northern Italy. Italy: Springer.
- России Оиокв. (2020). Оперативные данные.