
 ?Mathematical formulae have been encoded as MathML and are displayed in this HTML version using MathJax in order to improve their display. Uncheck the box to turn MathJax off. This feature requires Javascript. Click on a formula to zoom.
ABSTRACT
In this study, based on the EM-DAT (The Emergency Events Database) database, disaster assessment for the “Belt and Road” region was carried out in relation to the indicator of the Sustainable Development Goals (SDGs) agenda launched in 2015. A new method for diagnosing trends in the
indicators based on the Theil-Sen median method is proposed. In addition, using the data available in the EM-DAT, an overview of disaster records is used to quantify disasters for a total of 73 countries. The disaster trends for the period 2015‒2019 were found to demonstrate the following. (1) As a result of geological and climate conditions, Asia and Africa are high-risk disaster areas and disasters have caused considerable economic losses and affected the populations in developing and underdeveloped countries in these regions. (2) The clear positive value of
found for China reflects the country’s encouraging achievements in disaster prevention and mitigation. (3) The value of
was observed to be increasing in South Asia, northwest Africa and South Africa, with the increase in India and Mauritania being the most serious. The new method proposed in this paper allows the real trend in the
indicator in various countries to be derived and provides critical intelligence support for international disaster risk reduction plans and sustainable development goals.
1. Introduction
Climate change is having widespread affects on ecological systems across the world, inducing extreme risks of drought (Azadi et al., Citation2018; Vicente-Serrano, Quiring, Peña-Gallardo, Yuan, & Domínguez-Castro, Citation2020), flood (da Silva, Alencar, & de Almeida, Citation2020), rainstorms (Vaughan, Citation2019) and other water-related disasters. Climate change is also having a drastic impact on economic development, natural resources, and efforts towards the eradication of poverty. Related reports point out that if no action is taken, the average increase in the Earth’s surface temperature may exceed 3°C this century. The Intergovernmental Panel on Climate Change (IPCC) has also described some important strategies needed to keep the temperature rise within 1.5°C (IPCC, Citation2018a). Key assessments of this report and the implications for the Sendai Framework for Disaster Risk Reduction (SFDRR) are expected to act as a catalyst for strengthening current and future disaster risk-reduction efforts, particularly those dealing with issues such as flood impacts, heat-related health impacts, sea-level rise and forest fires in developing countries (Djalante, Citation2019). These are important actions that are needed to protect biodiversity and ecosystems, promote food security, help with managing the water supply, maintain human security, enhance health and well-being, and boost economic growth. Various parts of the world have been seriously affected by climate change but current efforts to fight climate change are still limited and weak (IPCC, Citation2018b). As a result, solving the development challenges that accompany climate change has led to “climate action” being necessary so that the world as a whole and different regions can achieve sustainable development at the same time as economic vitality.
The United Nations Sustainable Development Goals (SDGs) are 17 global development goals set by the United Nations (Assembly, Citation2015). These SGDs will continue to guide global development work from 2015 to 2030 after the Millennium Development Goals (MDGs) expire between 2000 and 2015. The Sustainable Development Goals aim to solve social, economic and environmental development problems in an integrated manner during the period from 2015 to 2030. The 13th SDG is to “Take urgent action to combat climate change and its impacts”, and five specific targets and eight evaluation indicators have been established concerning sub-goal 13.1 “Strengthen resilience and adaptive capacity to climate related hazards and disasters in all countries”. In connection with the SDGs agenda, countries participating in the “One Belt And One Road” initiative have made continuous efforts towards disaster reduction and prevention (Mall et al., Citation2019; Rana, Citation2020; Zuccaro, Leone, & Martucci, Citation2020) and technological exploration (Amina Khan, Gupta, & Gupta, Citation2020). Governments of various countries have carried out a range of research into disaster risk reduction (DDR), focusing on drought, floods (Bwambale, Nyeko, Muhumuza, & Kervyn, Citation2020), tsunamis (Imamura, Boret, Suppasri, & Muhari, Citation2019) and other types of disasters. The Indonesian government has initiated health education in schools and community-based disaster risk reduction (DRR) plans in response to major disasters (Pascapurnama et al., Citation2018); the European Commission has posted a series of policy goals related to climate-change adaptation (Faivre, Sgobbi, Happaerts, Raynal, & Schmidt, Citation2018). Historical data about natural hazards in vulnerable Bangladesh has been collated and analyzed to addresses the gap between existing historical disaster records and disaster risk reduction goals (Alam, Citation2019). Sri Lanka has launched Capacity Development for Disaster Risk Reduction courses for affected populations (Iizuka, Citation2020); these courses include, for example, first-aid training. As a country prone to disasters, China is committed to managing and mitigating the disaster risks associated with climate change (Feng & Chao, Citation2020; Gao, Liu, & Wu, Citation2020), and has accumulated a great deal of scientific data and experience in connection with seismic research (Chen, Hu, & Peng, Citation2018; Wu, Ma, Jiang, & Jiang, Citation2013), drought monitoring (Zhao, Zhang, Zhu, Shen, & Yu, Citation2020), flash floods (Liu et al., Citation2019) and other fields.
The 13th SDG goal clarifies the direction governments should take to promote climate action, especially in response to extreme weather and disasters. At the same time, it will also help to improve the monitoring and assessment of disaster risk reduction capabilities, and strengthen the ability of countries to adapt to, resist, and reduce extreme disasters caused by climate change. By making use of the advantages of big data in relation to the Earth sciences and SGD indicators, it is possible to quantify disaster information at a large geographical scale and to conduct valuable disaster assessments of different countries and regions (Jia, Citation2020; Sarker, Peng, Yiran, & Shouse, Citation2020).
2. Materials and methods
2.1. Overview of the Belt and Road region
The Belt and Road Initiative is a global infrastructure development strategy that was proposed by the Chinese government in 2013. It includes the “Silk Road Economic Belt” and the “21st Century Maritime Silk Road”. “Silk Road Economic Belt” refers to the overland routes through landlocked Central Asia, while “21st Century Maritime Silk Road” refers to the Indo‒Pacific sea routes from China to Southeast Asia and South Asia, the Middle East and Africa (Kuo & Niko, Citation2018). The majority of Belt and Road region is located within the Asian‒European, Indian Ocean, and African tectonic plates. Complex geological structures and plate motions cause frequent geological disasters and seismic activity within the region. In addition, the Belt and Road region covers a diverse range of climate types including subtropical, temperate, and cold temperate. The monsoon climate in the region leads to uneven distributions of temperature and rainfall, which can lead to floods and other extreme weather events (Gebremeskel Haile et al., Citation2019; Yang & Zhang, Citation2020; Zhong, Hua, & Yan, Citation2020). The region also experiences earthquakes, making it a high-risk area for disaster in global terms (Chai, Wang, & Liu, Citation2020). The Belt and Road region contains a considerable number of developing and underdeveloped countries in Asia and Africa. These countries have low levels of economic development, weak infrastructure, and a limited ability to withstand disasters. Widespread and frequent disasters have restricted infrastructure construction and socio-economic development within the Belt and Road region (Anwar Khan, Chenggang, Khan, & Muhammad, Citation2020). This has been accompanied by a large number of deaths and injuries as well as severe economic losses, especially in Southeast Asia, and in central and southern Africa.
2.2. Data source
The Emergency Events Database (EM-DAT) (https://www.emdat.be/) is one of the most valuable free international databases. The database was launched by the Centre for Research on the Epidemiology of Disasters (CRED) in 1988. The EM-DAT contains important core data on the occurrence and impact of more than 220,000 large-scale disasters worldwide from 1900 to the present. As a global disaster database, the EM-DAT provides a large amount of natural and technological disaster data for international projects and scientific research. The natural disasters in the database include disasters that can be classified as geophysical, meteorological, hydrological, climatological, biological, and astronomical. “Technological” disasters include industrial accidents, transport accidents and other, miscellaneous accidents. The database has provided open-source data support and forms an objective basis for national disaster prevention and mitigation as well as risk assessment.
2.3. Methods
The current calculation methods used for SDG 13.1.1 only take into account data on disasters for the current year and do not include anomalous data for individual years that are related to sudden disaster impacts. Therefore, the aim of this study was to conduct Theil-Sen median trend analysis on the SDG 13.1.1 indicators (Birkes & Dodge, Citation1993). The values of SDG13.1.1 were divided into the periods 2000‒2015 and 2000‒2019. These values, and the differences between them, were used to determine the trends in the SDG13.1.1 indicator. The specific methods used are described in the following.
2.3.1. Calculation of SDG13.1.1 values
has been defined to be a specific, effective indicator that can be used to quantitatively monitor and evaluate governments’ response to climate change. It is defined as the “number of deaths, missing persons and directly affected persons attributed to disasters per 100,000 population” (UNISDR, Citation2018):
Here, A2 is the number of deaths due to the disaster, A3 is the number of missing persons as a result of the disaster and B1 is the number of people directly affected by the disaster.
2.3.2. Reconstruction of SDG13.1.1 time series
The occurrence of disasters has great spatiotemporal uncertainty: as a consequence, the composition of the annual SGD index varies. With the aim of enhancing the robustness of the interannual sequence and scientifically reflecting long-term disaster trends, in this study, a cumulative method was devised to reconstruct the annual SDG 13.1.1 values. The formula used was
Here, is the calculated value of the SDG indicator for year i;
and
represent the two time periods 2000‒2015 and 2000‒2019.
2.3.3. Trend analysis for two time periods
The Theil-Sen Median method (Birkes & Dodge, Citation1993) is a recognized non-parametric statistical trend calculation method for robustly fitting a line. The method is highly efficient and is insensitive to measurement errors and outliers and is often used for analysing trends in long-term series of data. The relevant formula is
where and
are data from the time series;
and
represent different years.
The Mann‒Kendall trend test is a non-parametric statistical test that can be applied to monotonically increasing (or decreasing) time series of data (Kendall, Citation1975; Mann, Citation1945). This method does not require the observed data to follow a certain statistical distribution. It also does not require the trend to be linear and is not affected by missing values and outliers. This test is, therefore, widely used in testing the significance of trends in long-term series of data. For a time series ,
= 1, 2, …
, …
, …, n, the standardized test statistic, Z, is defined as
where
is the signum function;
is the variance of S.
Mann‒Kendall trend analysis was carried out for the 2000‒2015 and 2000‒2019
sequences. The results were recorded as
and
, respectively.
2.3.4. Calculation of the trend from 2015 to 2019
In order to make sense of the calculated trend and evaluate the real trend in indicator after the initial year of the SDGs (2015), 2000‒2015 was set as the benchmark stage for the Millennium Development Goals (MDGs). By calculating the difference between the period 2000‒2019 and the period 2000‒2015, the actual trend in
between 2015 and 2019 ‒ which was given the name
was obtained:
If was greater than 0, this indicated that the
indicator improved between 2015 and 2019; if
was less than 0, this indicated that there was a deterioration in the
indicator from 2015 to 2019. As for the value of
, the more positive the value means the greater deterioration. The final results were categorized as “+++ Significant Improvement”, “++ Obvious Improvement”, “+ Improvement”, “‒Deterioration”, “‒‒ Obvious Deterioration” and “‒‒‒ Significant Deterioration”.
3. Results
3.1. Overview of disasters in the Belt and Road region from 2015 to 2019
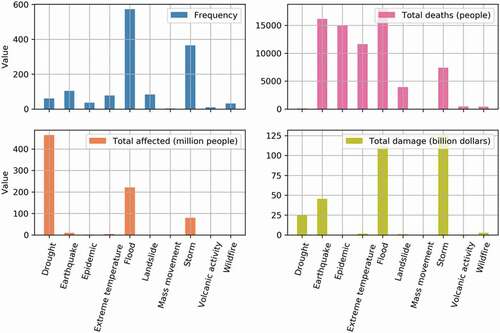
From 2015 to 2019, countries in the “Belt and Road” experienced various types of disasters, including drought, earthquake, epidemic, extreme temperatures, floods, landslides, storms, volcanic activity, and wildfires. Based on the 2015‒2019 disaster data from the EM-DAT database, a detailed analysis of the frequency and impact of disasters in the countries in the Belt and Road region was carried out (). The results show that floods had the highest frequency, with a total of 573 reports between 2015 and 2019; this was followed by storms, with a total of 365 reports. Floods were the disaster type that led to the largest total number of deaths, with total deaths reaching 17,903. This was followed by earthquakes and extreme temperatures, which had death tolls reaching 16,145 and 11,627 respectively. In terms of disaster impact, droughts and floods had the most serious impacts, affecting 465 million and 221 million people, respectively. Storms caused the greatest property losses, resulting in total damage of 125.7 billion dollars between 2015 and 2019. This was followed by floods and earthquakes, which caused losses of 111.1 billion dollars and 45.6 billion dollars, respectively.
Figure 1. Statistical data for different disaster types in the Belt and Road region from 2015 to 2019.
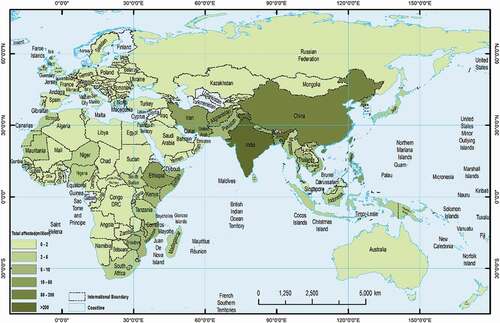
Generally speaking, Asia is a disaster-prone region. The data for 2015‒2019 show that the countries with the highest frequency of disasters and greatest numbers of affected people are concentrated in Southeast Asia, including China, India, the Philippines, and Indonesia (). The total number of disasters that occurred in each of these countries during this period was 152, 91, 70, and 66, respectively. Japan (East Asia), Pakistan and Afghanistan (Central Asia), and France and Italy (Europe) are also high-risk areas, with the number of occurrences of disasters ranging from 20‒50 in each country.
Figure 2. The frequency of disasters in the countries of the Belt and Road region from 2015 to 2019.
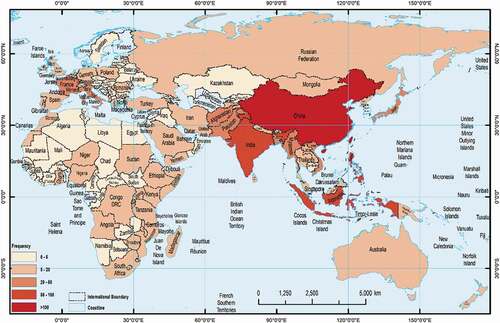
Figure 3. The total number of affected people in countries of the Belt and Road region from 2015 to 2019.
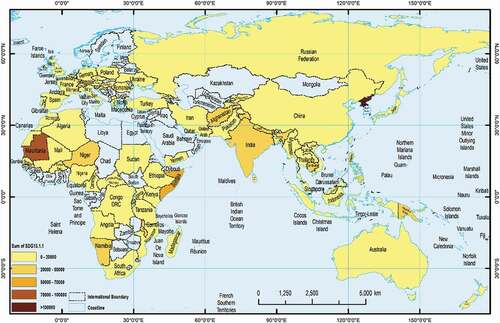
From the values of the sum of from 2015 to 2019 (), the spatial discrepancies in the frequency of disasters can be seen. The severe drought that North Korea suffered between 2015 and 2019 affected 29.36 million people and caused economic losses of 114 million dollars, making it the country with the highest total
indicator for the five-year period. Mauritania, which lies in the arid desert area of northwest Africa, was affected by severe drought in 2017 and 2018. The affected population reached 4.28 million and this led to the country also having a high
indicator. Other countries with high values of this indicator are mainly located in Central Asia and Africa. The resilience of these countries is affected by their underdeveloped economies and high population densities.
Figure 4. Sum of for the countries in the Belt and Road region from 2015 to 2019.
3.2. Trends in the evolution of SDG13.1.1 in the Belt and Road region from 2015 to 2019
According to the new method described in this article, the trend in for the Belt and Road region from 2015 to 2019 was calculated as
. shows the high-risk regions in Asia and Africa, especially the Southeast Asian countries at the junction of the Asian‒European plate and the Indian Ocean plate, and the arid areas of northwest and southern Africa. The histograms illustrate the overall differences between
and
. shows that China’s
was the highest from 2015 to 2019, reflecting its outstanding disaster prevention and reduction efforts.
for some countries in Southeast Asia and Africa, including Thailand, Bangladesh, Niger, Tanzania and Ethiopia, is also clearly high. It can also be seen that there has been an improvement in the
indicator since 2015 in other regions such as Europe, Russia, Australia, and Indonesia.
Figure 5. Histograms of the slope of for the countries in the Belt and Road region from 2015 to 2019.
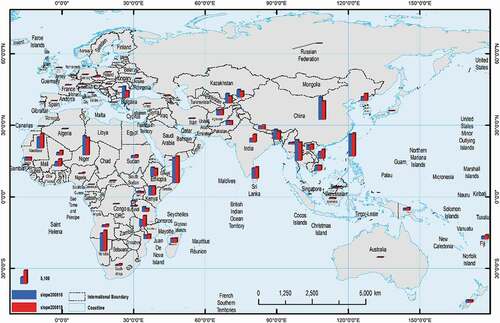
Figure 6. for the countries in the Belt and Road region from 2015 to 2019.
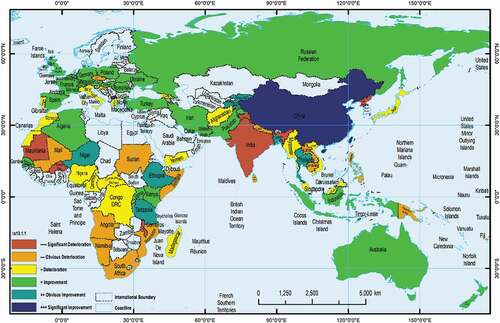
Regarding the regions where there has been a deterioration in , countries in Southeast Asia and Africa have particularly low values of
. Southern and Central Africa can be seen to be the region with the clearest deterioration in
since 2015 ‒ in particular, this includes underdeveloped Mauritania, Burkina Faso and Malawi. India, which has a high population density and a vulnerable ecosystem that is severely affected by climate change (IPCC, Citation2018b), is one of the countries in Asia where
has increased significantly. The
of other economically underdeveloped countries such as North Korea, Laos, Cambodia, Papua New Guinea and the Philippines is also negative.
4. Discussion and conclusion
The Belt and Road region is a huge economic community that promotes the development of individual countries; however, regional natural disaster risk assessments are lacking. Previous studies have only considered disaster data for specific Belt and Road countries (Yu et al., Citation2018) and have not looked at the spatial distribution of the countries where these disasters occurred. There is also a lack of studies on disaster assessment in the Belt and Road region based on the SDG goals. In this paper, a new disaster monitoring method based on the SDG goals was proposed. This method was used to evaluate the natural disaster situation in countries in the Belt and Road region from 2015 to 2019. This method takes into account the changes before and after 2015 and thus can truly reflect the long-term disaster resilience of different countries. Although Southeast Asia is a region with a high incidence of natural disasters, China achieved encouraging disaster reduction results in the period 2015‒2019. In contrast, among the countries in this region, India has experienced some of the greatest deterioration in disaster resilience. Countries in western and southern Africa also lack effective disaster resilience, which leads to deterioration in the evaluation indicators. The results showing the spatial distribution of should help to provide a scientific perspective that countries can use in their future disaster risk assessment efforts.
4.1. Credibility and reasonableness of the modified RSDG trend method
In order to evaluate the rationality of the method that was proposed in this paper, the Theil-Sen Median slope of the original
time series for 2015 to 2019 without data reconstruction was also calculated for comparison. The original values of
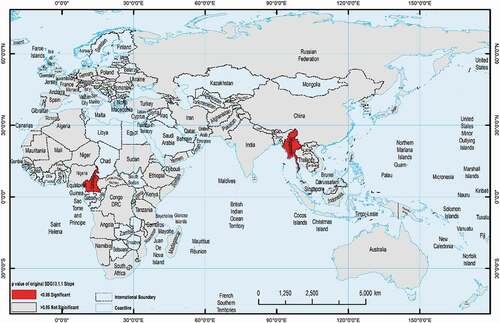
for China, Australia, Europe and central African countries can be seen to be decreasing year by year, whereas there is an increasing trend for Russia, India and southern African (). However, only two countries, Cameroon (Africa) and Myanmar (South Asia), passed the 0.05 significance test ().
Figure 7. Original slope values for countries in the Belt and Road region from 2015 to 2019.
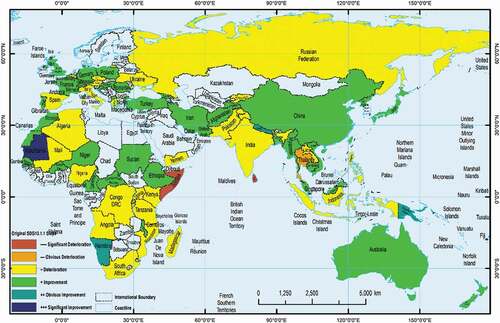
Figure 8. P values for the trend in for countries in the Belt and Road region from 2015 to 2019.
On the whole, the results for the trends in the original are unsatisfactory. The calculated slope values do not reasonably reflect the real trends in the time series and the spatial heterogeneity in the monitoring results is not as good as that obtained using the improved RSDG method. The range of results is restricted mainly to the categories of slight improvement and deterioration (). In addition, the simple
slope results for Mauritania, Cameroon and Myanmar () give optimistic estimates that do not reflect reality (). The reason for this discrepancy is that the trends in the variables are highly dependent on the values in the start year due to small number of years in the series, and the mean filling method cannot accurately reflect the randomness of disaster events.
To sum up, by constructing the time series, in this study, the uncertainty in the calculations due to the lack of annual data was reduced. In addition, the use of 20-year time series allowed the long-term trends in the indexes to be calculated. Thus, the improved methods used for calculating trends that were introduced in this paper can more reasonably diagnose the dynamic changes in indicators, thus aiding the scientific evaluation of the effect of disaster prevention and reduction efforts.
4.2. Uncertainty in and limitations of disaster assessment
The standards, types and content of the data included in the EM-DAT database, and the procedures and methods used for data collection follow certain guidelines. The disasters events included in the database must meet at least one of the following three conditions: 10 or more people died in the disaster; 100 or more persons were affected/injured/made homeless by the disaster; the state declared a state of emergency and/or called for international assistance (EM-DAT, Citation2009). At the same time, some countries have still not established a disaster database or monitoring system, resulting in the absence of background data. In this study, calculations were not carried out for countries that had too much missing background data in the past 20 years. This inevitably results in incomplete monitoring results and introduces uncertainty into the assessment of overall regional disaster prevention and mitigation. Therefore, obtaining a full understanding of the background to disasters and local knowledge (Bwambale et al., Citation2020) as well as establishing effective disaster risk information sharing are necessary for reducing the uncertainty in disaster monitoring and also important to achieving the goals of the scientific assessment of disaster risks and the prevention and reduction of disasters.
Acknowledgments
We are grateful to the Emergency Events Database (EM-DAT) (https://www.emdat.be/) for providing the disaster data. We also thank the reviewers for their constructive suggestions and comments.
Disclosure statement
No potential conflict of interest is reported by the authors.
Data availability statement
The data that support the findings of this study are openly available in ScienceDB at http://www.dx.doi.org/10.11922/sciencedb.j00076.00055.
Correction Statement
This article has been republished with minor changes. These changes do not impact the academic content of the article.
Additional information
Funding
Notes on contributors

Yuanhuizi He
Yuanhuizi He is a Ph.D. student at the State Key Laboratory of Remote Sensing Science, Aerospace Information Research Institute, Chinese Academy of Sciences (CAS). She is the first author of three original research articles and the co-author of four research articles. Her research interests include global change and drought monitoring as well as risk assessment using remote sensing technology.

Lei Wang
Li Wang received his Ph.D. degree from the Institute of Remote Sensing Applications, Chinese Academy of Sciences (CAS) in 2008. He is a professor at the Aerospace Information Research Institute, CAS. He has authored or co-authored more than 100 publications and his publications have appeared in, among others, Science Advances, Remote Sensing of Environment and the Journal of Geophysical Research: Biogeosciences. His research areas include land-cover and land-use change, the terrestrial carbon cycle, crop classification and disaster monitoring.

Fang Chen
Fang Chen received his Ph.D. degree from the Institute of Remote Sensing Applications, Chinese Academy of Sciences (CAS) in 2007. He is a professor at the Aerospace Information Research Institute, Chinese Academy of Sciences (CAS). He has published over 20 original research articles in peer-reviewed, internationally recognized journals and holds one patent. His research interests include interdisciplinary work that combines remote sensing, ecology and other fields of study to assess spatial patterns of disaster risk.
References
- Alam, E. (2019). Importance of long-term earthquake, tsunami and tropical cyclone data for disaster risk reduction in Bangladesh. Progress in Disaster Science, 2, 100019.
- Assembly, G. (2015). Sustainable development goals. SDGs, Transforming Our World, 2030, 338–350.
- Azadi, H., Keramati, P., Taheri, F., Rafiaani, P., Teklemariam, D., Gebrehiwot, K., … Witlox, F. (2018). Agricultural land conversion: Reviewing drought impacts and coping strategies. International Journal of Disaster Risk Reduction, 31, 184–195.
- Birkes, D., & Dodge, Y. (1993). 6.3 Estimating the regression line. In Vic Barrment, Ralph A & Geoffrey S. Watson(Eds.). Alternative methods of regression (pp. 113–118). New York: Wiley-Interscience.
- Bwambale, B., Nyeko, M., Muhumuza, M., & Kervyn, M. (2020). Questioning knowledge foundation: What is the best way to integrate knowledge to achieve substantial disaster risk reduction? International Journal of Disaster Risk Reduction, 51, 101850.
- Chai, D., Wang, M., & Liu, K. (2020). Driving factors of natural disasters in belt and road countries. International Journal of Disaster Risk Reduction, 51, 101774.
- Chen, Y., Hu, J., & Peng, F. (2018). Seismological challenges in earthquake hazard reductions: Reflections on the 2008 Wenchuan earthquake. Science Bulletin, 63(17), 1159–1166.
- da Silva, L. B. L., Alencar, M. H., & de Almeida, A. T. (2020). Multidimensional flood risk management under climate changes: Bibliometric analysis, trends and strategic guidelines for decision-making in urban dynamics. International Journal of Disaster Risk Reduction, 50, 101865.
- Djalante, R. (2019). Key assessments from the IPCC special report on global warming of 1.5 °C and the implications for the Sendai framework for disaster risk reduction. Progress in Disaster Science, 1, 100001.
- EM-DAT. (2009). EM-DAT – data entry – field description/definition. Retrieved from https://www.emdat.be/guidelines
- Faivre, N., Sgobbi, A., Happaerts, S., Raynal, J., & Schmidt, L. (2018). Translating the Sendai Framework into action: The EU approach to ecosystem-based disaster risk reduction. International Journal of Disaster Risk Reduction, 32, 4–10.
- Feng, A., & Chao, Q. (2020). An overview of assessment methods and analysis for climate change risk in China. Physics and Chemistry of the Earth, Parts A/B/C, 117, 102861.
- Gao, J., Liu, L., & Wu, S. (2020). Hazards of extreme events in China under different global warming targets. Big Earth Data, 4(2), 153–174.
- Gebremeskel Haile, G., Tang, Q., Sun, S., Huang, Z., Zhang, X., & Liu, X. (2019). Droughts in East Africa: Causes, impacts and resilience. Earth-Science Reviews, 193, 146–161.
- Iizuka, A. (2020). Developing capacity for disaster risk reduction: Lessons learned from a case of Sri Lanka. Progress in Disaster Science, 6, 100073.
- Imamura, F., Boret, S. P., Suppasri, A., & Muhari, A. (2019). Recent occurrences of serious tsunami damage and the future challenges of tsunami disaster risk reduction. Progress in Disaster Science, 1, 100009.
- IPCC. (2018a). Global Warming of 1.5°C [Press release]. Retrieved from https://www.ipcc.ch/sr15/
- IPCC. (2018b). IPCC’s special report on global warming of 1.5°C Retrieved from https://www.cseindia.org/ipcc-s-special-report-on-global-warming-of-1-5-c-9056
- Jia, G. (2020). The role of big Earth data in understanding climate change. Big Earth Data, 4(2), 91–93.
- Kendall, M. (1975). Rank correlation measures. London: Charles Griffin.
- Khan, A., Chenggang, Y., Khan, G., & Muhammad, F. (2020). The dilemma of natural disasters: Impact on economy, fiscal position, and foreign direct investment alongside Belt and Road Initiative countries. Science of the Total Environment, 743, 140578.
- Khan, A., Gupta, S., & Gupta, S. K. (2020). Multi-hazard disaster studies: Monitoring, detection, recovery, and management, based on emerging technologies and optimal techniques. International Journal of Disaster Risk Reduction, 47, 101642.
- Kuo, L., & Niko, K. (2018). What is China’s Belt and Road Initiative? The Guardian. Retrieved from https://www.theguardian.com/cities/ng-interactive/2018/jul/30/what-china-belt-road-initiative-silk-road-explainer
- Liu, W., Carling, P. A., Hu, K., Wang, H., Zhou, Z., Zhou, L., … Zhang, X. (2019). Outburst floods in China: A review. Earth-Science Reviews, 197, 102895.
- Mall, R. K., Srivastava, R. K., Banerjee, T., Mishra, O. P., Bhatt, D., & Sonkar, G. (2019). Disaster risk reduction including climate change adaptation over South Asia: Challenges and ways forward. International Journal of Disaster Risk Science, 10(1), 14–27.
- Mann, H. B. (1945). Nonparametric tests against trend. Econometrica, 13(3), 245–259.
- Pascapurnama, D. N., Murakami, A., Chagan-Yasutan, H., Hattori, T., Sasaki, H., & Egawa, S. (2018). Integrated health education in disaster risk reduction: Lesson learned from disease outbreak following natural disasters in Indonesia. International Journal of Disaster Risk Reduction, 29, 94–102.
- Rana, I. A. (2020). Disaster and climate change resilience: A bibliometric analysis. International Journal of Disaster Risk Reduction, 50, 101839.
- Sarker, M. N. I., Peng, Y., Yiran, C., & Shouse, R. C. (2020). Disaster resilience through big data: Way to environmental sustainability. International Journal of Disaster Risk Reduction, 51, 101769.
- UNISDR. (2018). Indicator 13.1.1: Number of deaths, missing persons and directly affected persons attributed to disasters per 100,000 population. Retrieved from https://unstats.un.org/sdgs/metadata/files/Metadata-13-01-01.pdf
- Vaughan, A. (2019). Global warming will drive extreme wet weather in summer. New Scientist, 243(3244), 9.
- Vicente-Serrano, S. M., Quiring, S. M., Peña-Gallardo, M., Yuan, S., & Domínguez-Castro, F. (2020). A review of environmental droughts: Increased risk under global warming? Earth-Science Reviews, 201, 102953.
- Wu, Z., Ma, T., Jiang, H., & Jiang, C. (2013). Multi-scale seismic hazard and risk in the China mainland with implication for the preparedness, mitigation, and management of earthquake disasters: An overview. International Journal of Disaster Risk Reduction, 4, 21–33.
- Yang, Z., & Zhang, J. (2020). Dataset of high temperature extremes over the major land areas of the Belt and Road for 1979-2018. Big Earth Data, 4(2), 128–141.
- Yu, L., Peng, C., Regmi, A. D., Murray, V., Pasuto, A., Titti, G., & Priyadarshana, D. G. T. (2018). An international program on silk road disaster risk reduction–a Belt and Road initiative (2016–2020). Journal of Mountain Science, 15(7), 1383–1396.
- Zhao, J., Zhang, Q., Zhu, X., Shen, Z., & Yu, H. (2020). Drought risk assessment in China: Evaluation framework and influencing factors. Geography and Sustainability. doi:https://doi.org/10.1016/j.geosus.2020.06.005
- Zhong, L., Hua, L., & Yan, Z. (2020). Datasets of meteorological drought events and risks for the developing countries in Eurasia. Big Earth Data, 4(2), 191–223.
- Zuccaro, G., Leone, M. F., & Martucci, C. (2020). Future research and innovation priorities in the field of natural hazards, disaster risk reduction, disaster risk management and climate change adaptation: A shared vision from the ESPREssO project. International Journal of Disaster Risk Reduction, 51, 101783.