
ABSTRACT
The rapid development of ocean observation technology has resulted in the accumulation of a large amount of data and this is pushing ocean science towards being data-driven. Based on the types and distribution of oceanographic data, this paper analyzes the present and makes predictions for the future regarding the use of big and small data in ocean science. The ocean science has not fully entered the era of big data. There are two ways to expand the amount of oceanographic data to better understanding and management of the ocean. On the data level, fully exploit the potential value of big and small ocean data, and transform the limited, small data into rich, big data, will help to achieve this. On the application level, oceanographic data are of great value if realize the federation of the core data owners and the consumers. The oceanographic data will provide not only a reliable scientific basis for climate, ecological, disaster and other scientific research, but also provide an unprecedented rich source of information that can be used to make predictions of the future.
KEYWORDS:
1. Definition
Since the journal, Nature, published a special issue on “big data” in 2008 (Nature, Citation2008), many professionals in science, economics and other fields have coined a new term for the incredible amount of digital information that now exists: “big data”. In February 2011, the journal, Science, published a special issue (Science, Citation2011) that focused on the explosive growth of various kinds of data, arguing that the collection, maintenance and use of massive data has become an important field of scientific research. As a professional institution, the McKinsey Global Institute makes use of big data in many fields for the first time (Manyika et al., Citation2011). In 2012, the US government announced a 200 USD million investment to launch the “Big Data Research and Development Initiative” (Agrawal et al., Citation2012a; Agrawal, Das, & Abbadi, Citation2012b). In 2014, Huadong Guo pointed out that research into scientific data has become a new type of scientific research and that the scientific paradigm has begun to change from being model-driven to data-driven (Guo, Wang, Chen, & Liang, Citation2014). Although there is as yet no consensus regarding a definition of big data, Gartner introduced that big data differs from traditional data in terms of the “3Vs” – volume, velocity and variety. Subsequently, “value” and “veracity” have been added as two further characteristics, giving a total of five (Guo et al., Citation2014; Tankard, Citation2012). In addition to these general characteristics of big data, in the field of ocean science, big data has another two features – spatial–temporal coupling and geographical correlation (Qian & Chen, Citation2018).
Spatial–temporal coupling: big ocean data are data with similar space and time attributes, namely, multi-dimensional data. With the further development of observation technology in particular, the spatial resolution and temporal frequency of data are increasing. Therefore, the data need to be analyzed both spatially and temporally. The characteristics of the time and space domains are diverse and high-dimensional, which leads to greater challenges in the analysis of big data.
Geographical correlation: big ocean data differ from other types of big data in terms of randomness and contingency. As the geographical characteristics of the data are affected by the proximity effect, the spatial relationships between adjacent regions can be linear or non-linear, meaning that the modal characteristics of these relationships can be represented by different spacetime scales.
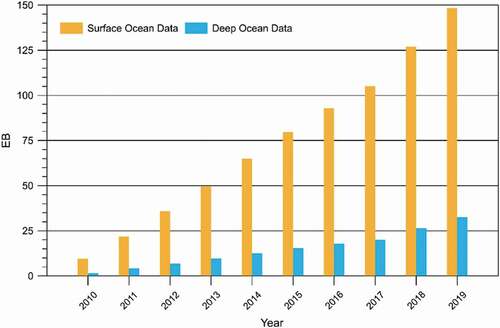
Because of its characteristics, ocean science data is now an important component of “big data”, including satellites, buoys, research vessels, models, reanalysis data and others (); however, ocean science has not fully entered the era of big data and still makes use of both big data and “small” data. On the one hand, from the perspective of data types, the vast majority of ocean science data is obtained from remote sensing and modelling, which can be considered sources of big data, whereas the data acquired from buoys and submersible vehicles constitute small data (). On the other hand, from the perspective of data distribution, nearly 90% of oceanographic data are acquired at the surface of the ocean, whereas data from the deep ocean are still scarce (). Looking to the future, how to take full advantage of the potential of small data, mine the value that can be obtained from big data and transform the limited, small data into rich, big data are issues that need to be considered.
Figure 1. Distribution of ocean science data acquired in the past decade, based on publicly available data from the internet.
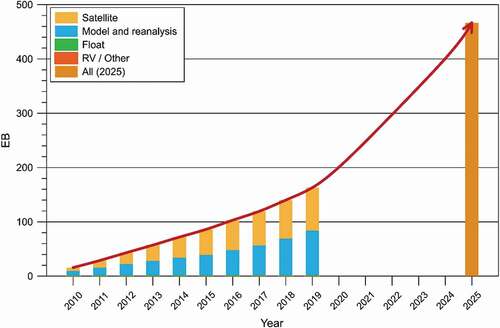
Figure 2. Distribution of ocean science data acquired in the past decade, based on publicly available data from the internet. Small ocean science data (from buoys, ship surveys, etc.) are in blue; big oceanographic data (from satellites, models and reanalysis data) are in orange.
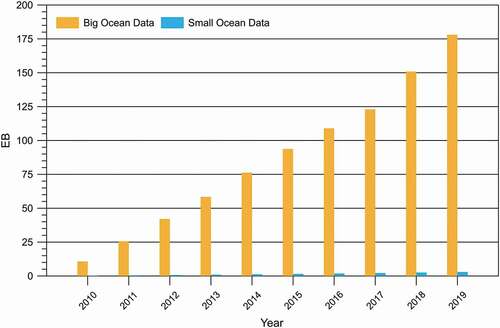
Figure 3. Distribution of ocean science data acquired in the past decade, based on publicly available data from the internet. Deep ocean data (from buoys, deep submersibles, partial models and reanalysis) are in blue; surface data (from satellites, ships, partial models and reanalysis) are in orange.
2. Data sources
2.1. Small data
2.1.1. Research vessels
A research vessel (RV) is a ship specially used for oceanographic surveys and research. It carries instruments and equipment for directly observing the ocean, collecting samples and studying the ocean. The use of research vessels is the oldest and most sophisticated method of monitoring the ocean, producing nearly 20 GB of observation data per year. However, this is still small in terms of the total amount of ocean science data that exists.
Based on their respective tasks, RV ships can be divided into comprehensive research ships, professional research ships and special research ships (Wu, Chen, & Yang, Citation2013). It has been more than 100 years since the first Challenger oceanographic survey ship was launched. China’s first oceanographic research ship, the Venus, was launched in 1956. Since then, China has more than 50 oceanographic research ships. In total, more than 40 countries around the world have oceanographic research ships, with the total number being more than 500. In 2019, China’s new comprehensive professional research ship ‘Dongfanghong 3ʹ was completed. The development of oceanographic research ships has continued over the last few decades, with RVs cruising areas from those close to the coastline to the open ocean and polar regions, thus making great contributions to China’s oceanographic research.
2.1.2. Ocean buoys
A buoy is an offshore platform used to carry all kinds of ocean and atmosphere sensors (Wu et al., Citation2013). Buoys constitute an important part of the ocean monitoring system, and, in contrast to other monitoring methods, buoys can perform automatic, continuous and long-term synchronous monitoring of the ocean environment under extreme environmental conditions. Buoys provide a temporal and spatial extension of the monitoring carried out by coastal observation stations, research ships and aircraft at a lower cost. Based on their locations at, buoys can be divided into moored buoys, submersible buoys and drifting buoys.
Moored buoys first appeared during World War II. The submersible buoy system was used by the United States in the early 1950s for subsurface and deep-sea environmental monitoring. Drifting buoys are mobile observation platforms developed according to the needs of specific ocean experiments and environmental monitoring plans. In the late 1970s, as computer and satellite communications technology began to be applied, buoy technology developed fast. The development of ocean buoys in China began in the mid-1960s and buoys were first put into use in the 1990s. At present, China is one of the countries that makes a major contribution to ocean monitoring using buoys (Yu et al., Citation2009).
2.1.3. Submersible
A submersible is self-propelled oceanographic device that can both travel on the surface and work independently underwater (Wu et al., Citation2013). In 1554, the Italian scientist, Tarcilia, invented the wooden submersible, which later had a great influence on the development of these devices. The first practical submersible was designed in 1717 by Halley (Cukier, Citation2010). Until the 1960s, most efforts to develop submersibles focused on breakthroughs in the depth that could be reached. At present, there are more than 200 manned deep-sea submersibles, mainly used in offshore oil and gas development.
In November 2010, China’s “Hailong” ROV (Remote Operated Vehicle) successfully completed a sea test at a depth of 3500 m. In July 2012, “Jiaolong” dived to a depth of 7062 m in a trench test area, a Chinese manned deep-sea record. This means that China has the ability to send manned submersible vehicles to more than 99.8% of the world oceans. In future, the “Warrior” and “Struggle” submersibles will further explore the deep sea.
2.1.4. Ocean observation network
The US’s Seaweb is the world’s first ocean observation network. The European Union has developed a series of underwater acoustic communication networks for making ocean observations with support from the MAST (Marine Science and Technology) programme. Integrated Ocean Observing Network, Australian Ocean Data Network, European Multidisciplinary Seafloor Observatory and Ocean Networks Canada are known as ocean observation networks. The Argo project, a large-scale network launched in 1998, aims to establish a real-time, high-resolution world ocean monitoring system that can rapidly collect accurate, large-scale global ocean temperature and salinity profile data. Argo floats improve the accuracy of climate predictions and are considered to constitute “ volution in ocean observation”. By June 2020, there were 3,964 functioning Argo buoys in the global ocean (Argo website, http://www.argo.org.cn/).
Underwater observations can also be made using a series of instruments, probes and command- controlled fixed, unmanned underwater systems. Sound waves are used for communicating with the land. Alternatively, a shuttle box or fiber-optic cables can be employed to connect the underwater instruments with asea-surface buoy. In this way, 3-D monitoring of the ocean from the surface to the ocean bed can be carried out in a long-term, continuous and real-time manner. These underwater platforms are known as the third Earth science observation platform– that is, they complement remote sensing systems and surface observation systems. The deployment of ocean observation networks allows more data from the deep ocean to be obtained; however, these data still make up only a small part of all oceanographic data.
2.2. Big data
2.2.1. Ocean remote sensing
Ocean remote sensing is the use of sensors to conduct remote, non-contact observations of the ocean to obtain images or data related to the ocean landscape orits constituent elements. The development of ocean remote sensing can be roughly divided into an initial period (1939–1969), an experimental period (1970–1977), a research period (19781991) and an application period (1992–present). Ocean remote sensing began during the Second World War (1939–1945) and the earliest aerial remote sensing of the ocean was used to complete the mapping of coasts and the measurement of offshore water depths (Dai, Mou, Wang, & Tian, Citation2014). In 1969, NASA held a workshop at Williams University that led to the development of SkylabandGEOS-3. In the 1990s, remote sensing satellites began to be launched in large numbers (Martin, Citation2004; Michael & Nicholas, Citation2014).
China’s deployment of oceanographic satellites began with the launch of Fengyun-1 in 1988, which was the first polar-orbiting meteorological satellite developed and launched by China. In May 2002, the successful launch of China’s first oceanographic satellite HY-1A marked a new phase in China’s development of oceanographic satellites. The successful launch of HY-1B in 2007 and HY-2 in 2011 filled the gaps in the observations of ocean dynamical and environmental variables. In the future, China will launch the HY-3 radar satellites, which will form a three-dimensional network for the monitoring of China’s ocean environment (Lin, Zhang, & Yuan, Citation2015).
At present, ocean satellites can generate nearly 8 EB of data every year. These form a part of big oceanographic data, but nearly 80% of these data are yet to be explored. Some of the maritime satellites that have been launched in the past decade are listed in .
Table 1. List of satellites launched by selected countries in the past decade.
2.2.2. Model and reanalysis data
By combining the basic physical processes of the ocean and a high-performance computer, a mathematical model can be established so as to simulate the ocean state (including the temperature, salinity, ocean currents, waves, tides and other elements) and describe the specific conditions of the ocean in a parameterized and quantitative way. With the rapid improvement of computer computing power, numerical simulations of the ocean have developed greatly in recent years and gradually become an important source of big ocean data, such as POM (Princeton Ocean Model), FVCOM (An Unstructured Grid, Finite-Volume Coastal Ocean Model), ROMS (Regional Ocean Model System), SWAN (Simulating Wave Nearshore), FOAM (Fast Ocean Atmosphere Model), and HYCOM (Hybrid Coordinate Ocean Model) (Randall & Zehnder, Citation2001; Zheng, Song, Zhang, & Bao, Citation2008). According to the World Climate Research Program (WCRP), there were more than 40 ocean models. Each model has both advantages and disadvantages, for instance, ROMS has good ecological accompanying module and FOAM is good at to simulate the global coupled ocean-atmosphere (Zheng et al., Citation2008).
Reanalysis is the use of data assimilation technology to fuse and optimally integrate various sources and types of observation data with numerical prediction products so as to reconstruct long-term historical data and solve the problem of the uneven spatial and temporal distribution of observations. Reanalysis data is a very important data source in modern climate change research and has been widely used in many research fields, such as atmosphere–ocean–land interactions, climate monitoring and seasonal forecasting, climate variability and change, the global water cycle and the Earth’s energy balance. Ocean reanalysis data commonly used as the basis of ocean models include the International Comprehensive Ocean–Atmosphere Data Set (ICOADS) and data from the European Centre for Medium Range Weather Forecasts (ECMWF) and the National Center for Environmental Forecasting/National Center for Atmospheric Research (NECP/NCAR). The ocean datasets obtained by assimilation methods include the SODA (Simple Ocean Data Assimilation) and OFES (OGCM for the Earth Simulator) reanalysis datasets (Li et al., Citation2010).
A variety of new technologies and equipment have been gradually forming a three-dimensional, multidisciplinary and integrated ocean data acquisition and detection network that has high spatial and temporal coverage. On the whole, the acquisition of ocean data has moved from traditional means to new technologies, from single factors to multiple ones, and from single surveys to operational normalized surveys, thereby establishing the concept of big data in terms of the total amount of ocean science data. In contrast, data acquired by traditional means and deep-sea data are relatively scarce and so can be considered small data. In the context of a better understanding of the ocean, these small data cannot meet the needs of effective sampling at the space–time scale for many important ocean processes and cannot support in-depth research or meet the needs of comprehensive ocean management.
3. Value
3.1. Storage management
Ocean data storage and management is a key factor that ensures successful application of data. All the major maritime countries in the world have ocean data centers responsible for data processing and management; these centers collect national and global ocean data through various nodes and distribute these data to the public.
Initially, traditional methods including disk arrays and CDs were used for storing small ocean science data (Cardenas, Manadhata, & Rajan, Citation2013). With the increasing amount of data, stores of ocean satellite data are now linked by the Network Attached Storage (NAS) system, which is composed of Gbps switches. The first- level storage employs high-speed online stores consisting of optical disks. High-capacity and low- speed disk-array near-line storage is used for secondary storage, and off-line storage method is adopted for the tertiary storage (Fichaut, Schaap, Maudire, & Manzella, Citation2012; Jiang, Lin, & Zhang, Citation2014).
The development of data storage has laid the foundation for data sharing. The International Oceanographic Data and Information Exchange (IODE) programme of the Intergovernmental Oceanographic Commission (IOC), established in 1960, carries out international oceanic data exchange, and plays an important role in the data sharing of multiple national ocean centers, such as DNAs (Designated National Agencies), NODCs (National Oceanographic Data Centres), RNODCs (Responsible National Oceanographic Data Centres) and WDCs (World Data Centres – Oceanography) etc. In 1993, organizations such as the IOC, the World Meteorological Organization (WMO), the United Nations Environment Program (UNEP) and the International Council of Science and Technology (ICSU) jointly established the Global Ocean Observing System (GOOS). In the 1980s, the U.S. government implemented a national policy of complete and open sharing of state-owned scientific data for public welfare scientific data. In 2002, the European Union proposed the principle and guiding ideology of public scientific data, open sharing of information held by public authorities, and established the SeaDataNet infrastructure network on this basis.
The advent of the era of big data has introduced more advanced storage technologies, the core of which is distributed file storage and cloud computing. Distributed file storage consisted of a distributed file system plus a NoSQL database, typically represented as Hadoop’s HDFS+HBase file storage scheme or Google’s GFS+Big Table. Distributed computing developed from Hadoop’s MapReduce to Spark in-memory computing, Storm streaming computing and Spark streaming computing. These technologies can efficiently deal with the trends towards multi-regional, heterogeneous data in ocean science and with the increasing amount of data. At present, the main cloud storage platforms include Google Store, Amazon S3, Microsoft Azure, Ali Cloud, Cloudera and IBM Blue Cloud (Neves & Bernardino, Citation2015). Greenplum Database is an open-source massively parallel data platform for analytics, machine learning and AI (Liu & Yao, Citation2015)
In order to make cloud storage suitable for sensitive satellite oceanographic data, it is necessary to divide the data according to their different security classifications and establish an appropriate index structure, so as to improve the query efficiency of ultra-high-dimensional data. With the continuous acquisition of real-time observation data by data storage systems, it is necessary to carry out dynamic migration based on the characteristics of ocean data to realize the optimal utilization of the storage system resources.
3.2. Analysis methods
The traditional data analysis methods used in ocean science mainly include cluster analysis, regression analysis, principal component analysis, interpolation analysis, correlation analysis and other statistical analysis methods, which provide important technical support for laying an important theoretical foundation for small ocean science data. As the amount of data in ocean science has increased through MapReduce, Storm, Stream Base, Pregel and other advanced parallel computing frameworks, the process of mining information from oceanographic data has developed from the traditional Empirical Orthogonal Method (EOF) to the Four-dimensional Harmonic Extraction Method (4D-HEM) (Chen, Citation2006; Chen, Wang, & Qian, Citation2016; Dean & Ghemawat, Citation2008; Lorenz, Citation1950; Mcloughlin, Laramee, Peikert, Post, & Chen, Citation2009).
The visualization is one of the effective methods to analyze the phenomenon of the ocean. It can be divided into the vector and scalar field visualizations from the data type. The methods of vector field visualization mainly include chart method, geometric method, texture method, and topological method. The flow field visualization method based on texture and particle tracking study make a foundation for the complex flow field visualization. NASA Scientific Visualization Studio has made more than 5300 visualization videos of the ocean including the famous “Perpetual Ocean” which use streamline technology (NASA’s Goddard Space Flight Center, Citation2012). In terms of scalar field visualization algorithms, the research mainly focuses on volume rendering algorithms. The University of California, Davis has realized in large-scale volume rendering, real-time illumination, multivariate feature extraction etc. (Jadamec, Kreylos, Chang, Fischer, & Yikilmaz, Citation2018; Yu, Xie, Ma, Kolla, & Chen, Citation2015). In addition, in terms of scientific visualization analysis, World Wind, Skyline, Open Scene Graph (OSG) and Google Earth can simulation and visualization of ocean and atmospheric environment (Sarthou, Mas, Jacquin, Moreno, & Salamon, Citation2015). The Ocean University of China built the i4Ocean platform based on the MVAR architecture, and realized ocean visualization based on LIC and Ray-Casting algorithms (Li, Chen, Kong, Wang, & Qian, Citation2011).
With the development of cloud computing, regional chains, Artificial Intelligence (AI) and open data policies, ocean science data analysis has been pushed to a new level (Li et al., Citation2020; Li, Wang, & Li, Citation2013; Reichstein et al., Citation2019; Zaidi et al., Citation2018). Supercomputers have made possible big ocean science data computing. At the 2020 International Supercomputing Congress, China’s deployment of super computers ranked first in terms of numbers. “Fugaku”, the top supercomputer, could make nearly 41.5 trillion calculations per second, thus allowing better understanding of the Earth’s systems, including the marine system, and providing technical support for sustainable development.
The data-driven scientific model is bringing a new perspective to ocean research. However, due to the spatial–temporal coupling and geographical correlation characteristics of big ocean data, traditional data-mining algorithms cannot be effectively decoupled and geographically decomposed, which means that mining algorithms urgently need to be improved and adjusted so that they can be applied to the analysis of ocean data.
3.3. Application
At present, ocean science data mainly provide decision-making support in fields including climate prediction, disaster assessment, and social and economic development. In particular, complete numerical prediction systems based on high-performance clusters provide technical support for the application of marine scientific data in climate prediction. For example, NOAA plans to launch the WoF (Ward-on-Forecast) System in 2023; this will provide 3–10-km resolution refined weather forecasts and disaster warnings for the U.S. and its adjacent waters (Agrawal et al., Citation2012a). The marine forecasting service in China has realized 50-km grid forecasting, and a new generation of grid forecasting products with a resolution of 10 km is under development. All kinds of forecast products have been applied to studies of red tides, green-tide monitoring, sea-ice monitoring, fisheries and water-quality investigations.
In addition, there are many institutions provide industry solutions based on ocean science data. SINAY is a company which can provide maritime data and thematic modules with actionable key indicators (SINAY, Citation2021). BigOceanData is one of the first organizations to explore the potential of vessel tracking technology. They focus on providing clients with the exact solution which require through bespoke development of core data management and tracking software components (BigOceanData, Citation2021). Ocean Networks Canada was created by the University of Victoria in 2007 as a not-for-profit society under the British Columbia Societies Act to provide dedicated governance and management of this world-leading ocean observatory (Ocean Networks Canada, Citation2021). Open Ocean is a company which provide online decision-making solutions for industrial marine activities, especially in high resolution modelling, statistical analysis and data mining (Open Ocean, Citation2021).
The support provided by marine scientific data to social and economic development is mainly reflected in the gradual transition from “digital ocean” to “transparent ocean” to “smart ocean”. At the early stage, all countries in the world were actively engaged in the construction of a so-called digital ocean; these developments included the Neptune plan formulated by the United States and Canada, Japan’s ARANA plan, the African Offshore Resource Data and Network Information Platform set up by 25 maritime African countries and China’s “iOcean” platform (Foresman, Citation2008; Guo, Liu, & Zhu, Citation2010). At present, China’s “Transparent ocean” plan is also steadily advancing. This plan has achieved leapfrog development from transparency in observation to transparency in prediction, thus laying a foundation for the future construction of “smart ocean” platforms (Guo, Citation2017). From the perspective of big data, data assets will become the core competitiveness in all industries. From the perspective of industrial development, it is highly competitive to build application-oriented innovative enterprises with distinctive applications based on data platforms. At present, ocean-related industries are actively promoting the application of big ocean science data. However, industrial applications of the transformation of big data are a new phenomenon, and there is not much previous experience to base these on. Therefore, there are still many problems to be solved in the application of ocean science data.
4. Future research topics and key techniques
4.1. Small data shift (Small data become big data)
Compared with surface ocean data, deep ocean data are sparse and fragmented and constitute small ocean science data. However, these data are of great significance not only to theoretical studies of the ocean but also to resource exploration, climate analysis, defense and other industries. At present, deep ocean data are still at the stage of data accumulation, so it is necessary to focus on the development and employment of these newly acquired data, and on the transmission and analysis techniques that can be used to turn small data into big data.
For the acquisition of deep ocean science data, efforts should be made to develop techniques including the use of underwater gliders, deep-sea Argo floats, underwater environmental monitoring robot technologies and long-term in-situ systems for observing the deep-sea seabed boundary layer. The ocean internet of things also needs to be developed so that the interconnection of all ocean observation equipment (sensors) can be realized. The integration of all kinds of data and information such as that related to the environment, ecology and resources also needs to happen so that the goals of full time-domain ocean-situation awareness, whole-ocean network coverage and an all-round information service can be realized.
In relation to the transmission of deep ocean science data, research should focus on the network used to transmit the observations, and on the technology used to maintain this network. Solve problems of data transmission network including different standards, high complexity, and maintenance difficulty. We need to improve the transmission rate for data from the deep ocean environment, to ensure that the transmission network expands and is secure, and to achieve the goal of transmitting petabytes of observation data in an efficient, stable and secure way.
In relation to the analysis of deep ocean science data, data fusion and reconstruction algorithms that can expand finite small data to infinite big data are required. In terms of data fusion, classical mathematical methods such as least squares, maximum likelihood estimation and weighted average can be combined with modern data-fusion techniques such as neural networks, genetic algorithms and entropy theory to realize the fusion of multi-source collaborative observation data. Reconstruction algorithms can be based on compressed sensing theory, meaning that the signal requires much less accurate recovery sampling points than that implied by the Nyquist criterion. In addition, with the fast development of AI, neural networks, deep learning, support vector machines (SVMs) and genetic algorithms can be applied to data reconstruction.
4.2. Big data tolerance (Big data contain small data)
Although ocean science data have reached the level of big data in terms of total volume, the current big data machine learning models are often purely data-driven and divorced from theory. Therefore, the authenticity and reliability of big data models requires the existence of small data. In order to achieve a high degree of consistency between data models and the theoretical mechanisms, mining algorithms and the model construction technology can be optimized.
Traditional big data mining algorithms rely on divide-and-conquer and scale-transformation strategies. The need to search a large and complex attribute space has caused serious problems for data-intensive computing. At the same time, due to the complex correlation and the noise within the data, it is not uncommon to find meaningless patterns. In order to effectively improve big data mining and scientific discovery in the context of marine science, the development of automatic data-mining methods based on AI reasoning theory using small data is urgently needed.
Traditional model-building techniques focus on the analysis of big-data mining from the perspective of spatial–temporal independence, which has certain limitations when describing ocean system processes that are spatially and temporally correlated. A breakthrough in technology is needed to construct an AI model based on spatial and temporal correlation. It would then be possible to add temporal and spatial variables to describe ocean processes based on small data for traditional AI algorithms, improve the breadth and depth of the application of AI algorithms in the field of ocean system science and enhance the authenticity of modelling results.
4.3. New application areas
The ocean is a key component of the earth system, and accurate and precise prediction of changes in the ocean and the earth’s climate system is a key means of scientific response to and mitigation of global climate change. The current forecast and prediction of ocean and earth system changes are developing towards multi-circle layer coupling and high resolution, combined with AI, supercomputers, and the increasing number of integrated ocean and earth system observation data, improving the ocean and earth (Reichstein et al., Citation2019). The refined and accurate forecasting of system changes is an urgent task and a huge challenge facing the world. In the future, the resolution of the earth system model is required to be from hundred kilometers to the kilometer level, and the physical process will rise from a large-scale average approximate parameterized description to an explicit description of detailed processes such as typhoons, small and medium-scale vortices, and wave breaking. At present, the application of oceanographic data is lack of services for marine related industries, but mainly focused on scientific applications. One of the important reasons is that, the core data owners are not the consumers. If implement the federation of data owners and consumers, the value of oceanographic data will be better exploited and new applications will be explored. This will enable the promotion of the integration of ocean science technology and the economy and format ocean science data product systems to help realize the integration of industrial applications of ocean science data, which will help to provide decision support for the government, and finally, to help solve issues in relation to people’s livelihoods, as well as in defense, security, environmental protection and other fields.
5. Conclusions
Developments in modern ocean science can be divided into three stages. The first stage is the theory-driven stage, which relates to how many important theories have explained physical phenomena in the ocean in innovative ways and greatly promoted our understanding of the ocean. The second is the technology-driven stage, in which exploration mainly depends on the development of various observation methods. The third is the data-driven stage, which has been brought about thanks to the increase in data volume resulting from the abundance of observations. As the data-driven stage has developed, opportunities and challenges have arisen. Great opportunities exist in relation to changing the paradigm of how people understand the ocean. During the theoretical stage, industrial leaders were responsible for exploring the ocean. In the technology-driven stage, elites made further explorations of the ocean. Now at the third stage, everyone can be an expert in data science and an ocean explorer.
However, it will take a long time to realize comprehensive big data in the ocean. The big ocean data era will follow the development rules of big data in other industries. The government will lead the development in the early stage, and large companies will participate in the middle. Finally, and finally small and medium-sized enterprises will become the main force to explore the application and service. Nowadays, on the data level, the research institutions are the core of data acquisition, but not the core of data application. How the data combined operation of the company’s business is a problem. On the one hand, the data providers need to establish convenient ways for data sharing, analyzing, and expression. On the other hand, the data users need to have capacity of data application. On the application level, the ocean data are useful for climate prediction, environmental detection, water quality survey, scientific research, etc. In fact, the ocean the value of ocean data can be expanded when they are combined with ocean economy and the data owners federate with the users. The challenge is to break through the inhomogeneities in the temporal and spatial distribution of small and big ocean science data. The organic combination of data science and ocean science should be steadily promoted. A focus on theory in the fields of ocean science and technological innovation is also required, as are advances in basic research and core technology. The use of rich ocean science data can accelerate industrial development. Eventually, ocean science education and industry in China will be transformed into an evidence-based and data-based science.
Disclosure statement
No potential conflict of interest was reported by the author(s).
Additional information
Funding
References
- Agrawal, D., Bernstein, P., Bertino, E., Davidson, S., Dayal, U., Franklin, M., … Widom, J. (2012a). Challenges and opportunities with big data. A Community White Paper Developed by Leading Researchers across the United States. https://infolab.usc.edu/imsc/research/bigdatawhitepaper.pdf
- Agrawal, D., Das, S., & Abbadi, A. E. (2012b). Data Management in the Cloud: Challenges and Opportunities. Synthesis Lectures on Data Management. 4. 1–138. https://doi.org/10.2200/S00456ED1V01Y201211DTM.032
- BigOceanData. (2021, February 22). Retrieved from https://www.bigoceandata.com/
- Cardenas, A. A., Manadhata, P. K., & Rajan, S. P. (2013). Big data analytics for security. IEEE Security and Privacy Magazine, 11(11), 74–76.
- Chen, G. (2006). A novel scheme for identifying principal modes in geophysical variability with application to global precipitation. Journal of Geophysical Research, 111, D11103.
- Chen, G., Wang, X., & Qian, C. (2016). Vertical structure of upper-ocean seasonality: Extratropical spiral versus tropical phase lock. Journal of Climate, 9, 4021–4030.
- Cukier, K. (2010). Data, data everywhere: A special report on managing information. Economist, 2, 10–11.
- Dai, H. L., Mou, N. X., Wang, C. Y., & Tian, M. (2014). Development status and trend of ocean buoy in China (in Chinese). Meterological, Hydrological and Marine Instruments, 31(2), 118–121.
- Dean, J., & Ghemawat, S. (2008). MapReduce: Simplified data processing on large clusters. Communications of the ACM—50th Anniversary, 51(1), 107–113.
- Fichaut, M., Schaap, D., Maudire, G., & Manzella, G. M. R. (2012). SeaDataNet Pan-European infrastructure for ocean and marine data managem en, Eguga.
- Foresman, T. W. (2008). Evolution and implementation of the digital Earth vision, technology and society. International Journal of Digital Earth, 1(1), 4–16.
- Guo, H. D. (2017). Big Earth data: A new frontier in Earth and information sciences. Big Earth Data, 1(1–2), 4–20.
- Guo, H. D., Liu, Z., & Zhu, L. W. (2010). Digital Earth: Decadal experiences and some thoughts. International Journal of Digital Earth, 3(1), 31–46.
- Guo, H. D., Wang, L. Z., Chen, F., & Liang, D. (2014). Chinese Science Bulletin, 59, 5066–5073.
- Jadamec, M. A., Kreylos, O., Chang, B., Fischer, K. M., & Yikilmaz, M. B. (2018). A visual survey of global slab geometries with show Earth model and implications for a three‐dimensional subduction paradigm. Earth and Space Science, 5(6), 240–257.
- Jiang, X. W., Lin, M. S., & Zhang, G. Y. (2014). An overview of HY-2 satellite ground application system (in Chinese). Strategic Study of CAE, 16(6), 4–12.
- Li, D. R., Wang, S. L., & Li, D. Y. (2013). Spatial data mining theories and applications (in Chinese) (pp. 1–3). Beijing: Science Press.
- Li, W., Chen, G., Kong, Q., Wang, Z., & Qian, C. (2011). A VR-ocean system for interactive geospatial analysis and 4D visualization of the marine environment around Antarctica. Computers and Geosciences, 37(11), 1743–1751.
- Li, X., Li, B., Zheng, G., Ren, Y., Zhang, S., Liu, Y., … Wang, F. (2020). Deep learning-based information mining from ocean remote sensing imager y. National Science Review, 7, nwaa047.
- Li, X. T., Zheng, P. N., Wang, F. J., and Teng, J. (2010). Summary of common marine data (in Chinese). Marine Forecasts, 27(5), 81–89.
- Lin, M. S., Zhang, Y. G., & Yuan, X. Z. (2015). The development course and trend of ocean remote sensing satellite (in Chinese). Haiyang Xuebao, 37(1), 1–10.
- Liu, K., & Yao, Y. (2015). Power your big data analytics with pivotal Greenplum database. Annual Technical Conference, Santa Clara.
- Lorenz, K. Z. (1950). The comparative method in studying innate behavior patterns. In Society for Experimental Biology, Physiological mechanisms in animal behavior. (Society's Symposium IV.) (p. 221–268). Academic Press
- Manyika, J., Chui, M., Brown, B., Bughin, J., Dobbs, R., Roxburgh, C., & Hung, B. A. (2011). The big data: The next frontier for innovation, competition, and the productivity. Chicago. McKinsey Global Institute.
- Martin, S. (2004). An introduction to ocean remote sensing. Cambridge: Cambridge University Press.
- Mcloughlin, T., Laramee, R. S., Peikert, R., Post, F. H., & Chen, M. (2009). Over two decades of integration-based, geometric flow visualization. Computer Graphics Forum, 29(6), 1807–1829.
- Michael, A. W., & Nicholas, C. C. (2014). Satellites: Make Earth observations open access. Nature, 513(7516), 30–31.
- NASA’s Goddard Space Flight Center. (2012, April 9). NASA views our perpetual ocean. ScienceDaily.www.sciencedaily.com/releases/2012/04/120409204414.htm
- Nature. (2008). Big data. Nature, 455.
- Neves, P., & Bernardino, J. (2015). Big data in the cloud: A survey. Open Journal of Big Data, 1, 3–20.
- Ocean Networks Canada. (2021, February 22). Retrieved from https://oceannetworks.ca/
- Open Ocean. (2021, February 22). Retrieved from http://www.openocean.fr/en/
- Qian, C., & Chen, G. (2018). Big Data Science for Ocean: Present and Future. Bulletin of Chinese Academy of Sciences, 33(8), 884–891.
- Randall, D. A., & Zehnder, J. (2001). General circulation model development: Past, present, and future. International Geophysics Series, Applied Mechanics Reviews, 54(5), B94.
- Reichstein, M., Camps-Valls, G., Stevens, B. Jung, M., Joachim Denzler, N. Carvalhais, Prabhat (2019). Deep learning and process understanding for data-driven Earth system science. Nature ,566(7743): 195–204.
- Sarthou, A., Mas, S., Jacquin, M., Moreno, N., & Salamon, A. (2015). Earthscape, a multi-purpose interactive 3D global viewer for hybrid data visualization and analysis. International Archives of the Photogrammetry, Remote Sensing and Spatial Information Sciences, XL-3/W3, 487–493.
- Science. (2011). Challenges and opportunities. Science, 331.
- SINAY. (2021, February 22). Retrieved from https://sinay.ai/en/
- Tankard, C. (2012). Big data security. Network Security, 2012(7), 5–8.
- Wu, Z. H., Chen, H. J., & Yang, J. H. (2013). Big spatial data infrastructure (pp. 9–10). Hangzhou: Zhejiang University Press.
- Yu, H., Xie, J., Ma, K. L., Kolla, H., & Chen, J. H. (2015). Scalable parallel distance field construction for large-scale applications. United States. doi:https://doi.org/10.1109/TVCG.2015.2417572
- Yu, Z. G., Xiong, J. S., Zhang, T. L., & Shi, H. D. (2009). Marine technology. Beijing: China Ocean Press.
- Zaidi, A., Chandola, V., Allen, M., Sanyal, J., Stewart, R. N., Bhaduri, B. L., & McManamay, R. A. (2018). Machine learning for energy-water nexus: Challenges and opportunities. Big Earth Data, 2, 228–267.
- Zheng, P. N., Song, J., Zhang, F. R., & Bao, X. W. (2008). Common instruction of some ogcm (in Chinese). Marine Forecasts, 25(4), 108–120.