
ABSTRACT
Big open data comprising comprehensive, long-term atmospheric and ecosystem in-situ observations will give us tools to meet global grand challenges and to contribute towards sustainable development. United Nations’ Sustainable Development Goals (UN SDGs) provide framework for the process. We present synthesis on how Station for Measuring Earth Surface–Atmosphere Relations (SMEAR) observation network can contribute to UN SDGs. We describe SMEAR II flagship station in Hyytiälä, Finland. With more than 1200 variables measured in an integrated manner, we can understand interactions and feedbacks between biosphere and atmosphere. This contributes towards understanding impacts of climate change to natural ecosystems and feedbacks from ecosystems to climate. The benefits of SMEAR concept are highlighted through outreach project in Eastern Lapland utilizing SMEAR I observations from Värriö research station. In contrast to boreal environment, SMEAR concept was also deployed in Beijing. We underline the benefits of comprehensive observations to gain novel insights into complex interactions between densely populated urban environment and atmosphere. Such observations enable work towards solving air quality problems and improve the quality of life inside megacities. The network of comprehensive stations with various measurements will enable science-based decision making and support sustainable development by providing long-term view on spatio-temporal trends on atmospheric composition and ecosystem parameters.
1. Introduction and background
At present, a better understanding of various interactions and feedbacks between Earth surface and atmosphere is required to improve climate-related predictions and mitigation plans (Arneth et al., Citation2010; Kulmala et al., Citation2015). To meet the interlinked environmental global grand challenges, more comprehensive and accurate data are needed. Most importantly, if the global CO2 emissions continue increasing at the current rate, we will have, within 40 years, atmospheric CO2 concentration over 500 ppm (www.esrl.noaa.gov/gmd/ccgg/trends/). This value can be considered to be critical tipping point for unpredicted behaviour of the climate and consequently of the Earth system. The Grand Challenges of the Earth, such as climate change, air quality, and water and food supply are interlinked, but current observations are fragmented. For the future aspiration, we need an integrated approach to understand feedbacks between different Earth components to reduce uncertainties in climate change predictions, to improve urban air quality and to mitigate and adapt to climate change effectively (Baklanov, Molina, & Gauss, Citation2015; Kulmala, Citation2015, Citation2018).
In 2015, the United Nations General Assembly defined 17 Sustainable Development Goals (SDGs), with associated 169 targets and 232 indicators to be achieved by the year 2030 (United Nations, Citation2015). These goals, also referred to as Agenda 2030, are a comprehensive, global effort to strengthen sustainability in its three dimensions: economic, social and environmental. The goals are ambitious and deeply interconnected in an interlinked world; one goal cannot be met without working actively on the others and without global cooperation (United Nations, Citation2019). To meet the SDGs, an international research framework extending from a local to global scale is needed. The SDGs are closely linked to other UN agendas such as the Paris Climate Agreement, the New Urban Agenda and the Sendai Framework for Disaster Risk Reduction (Murray, Maini, Clarke, & Eltinay, Citation2017). The goals have been officially adopted by all 193 UN member states, which signifies a commitment on meeting SDGs on all the levels of governance nationally and internationally.
In Finland, we have Stations for Measuring Earth Surface–Atmosphere Relations (SMEAR) e.g. in Hyytiälä (SMEAR II) and Värriö (SMEAR I) (see chapter 2 and 3), which support work towards SDGs and connect to political and organizational strategies on municipal and organizational, national and EU levels. Some examples of these include Finland’s incorporation of SDG’s in national processes and policies on governmental level (Prime Minister’s Office Citation2020, Voluntary National Review 2020 Finland – Report on the Implementation of the 2030 Agenda for Sustainable development), commitment to the EU Green Deal (European Commission, Citation2019, The European Green Deal) and the Society’s Commitment to support Agenda 2030. Society’s Commitment refers to commitments that can be established with companies, municipalities, organizations, administration, educational institutions, local actors and individuals, and are overseen by the Finnish National Commission on Sustainable Development (sitoumus2050.fi/en/mika-on-sitoumus-#/).
The need for climate action is well recognized in SDGs. SDGs 11, 12 and 13 call us to “take urgent action to combat climate change and its impacts” (SDG 13), to “ensure sustainable consumption and production patterns” (SDG 12) and to “make cities and human settlements inclusive, safe, resilient and sustainable” (SDG 11, United Nations, Citation2015, 26–28). Many of the specific targets listed under these goals focus on raising awareness about climate friendliness and sustainable lifestyle as well as on supporting sustainable national and international policy-making, business and use of resources. It is also acknowledged that different societies, communities and individuals all have specific needs and special effort should be made to support developing countries as well as communities and individuals in vulnerable positions. In other words, we need to ensure that “no one is left behind” (E/HLS(2016)1).
To solve global challenges, we need global data. Currently, we do not have sufficient data or analytical methods to assess the progress of all SDG indicators. It has been estimated that only 45% of the indicators are supported by both data and methods, which makes it difficult to implement SDGs (Guo, Citation2018, Citation2020). Overall, we need big data to achieve SDGs (Ford et al., Citation2016), and for that we need global strategies as well as practical local solutions, such as safe and effective ways to collect and store data (e.g. Espey, Citation2019). Starting from 1991, the University of Helsinki has developed a comprehensive station concept measuring atmosphere–ecosystem relations: SMEAR. The most comprehensive station platform, called SMEAR II is located in Hyytiälä (61°51ʹ N, 24°17ʹ E, 181 m above sea level) in southern boreal pine forest, wetland and lake, and it measures fluxes and concentrations of several ecosystem and atmosphere-related variables 24/7 (Hari, Andreae, Kabat, & Kulmala, Citation2009; Hari & Kulmala, Citation2005; Hari et al., Citation2016; Junninen et al., Citation2009). Comprehensive atmospheric and Earth surface observations of the SMEAR network can contribute to SDGs by providing data from different locations with varying environmental conditions, including air quality, for example, from Värriö Station in Finnish Lapland and Chinese megacities. Atmospheric and ecosystem data not only provide a valuable input, especially in understanding complex phenomena and feedbacks related to climate change and global warming, but also provide a big data pool to be utilized in practical applications and solutions at the local to regional scales.
SDG target 12.a calls us to “support developing countries to strengthen their scientific and technological capacity to move towards more sustainable patterns of consumption and production” (United Nations, Citation2015). In any country, science and technology are a prerequisite for building sustainability but there will be no change without political will and a change in people’s behaviour. Just as decision-makers need to adapt science-based policies regarding climate change and sustainability, scientists need to actively provide input to decision-makers (United Nations, Citation2019). In general, an ongoing and honest dialogue between sectors is required to integrate different types of knowledge in working towards achieving the SDGs. In the context of SMEAR, the need for climate education (i.e. Climate University, https://climateuniversity.fi/) and policy advice have been recognized as a key factor in meeting the Agenda 2030 goals.
To maximize the positive contribution of atmospheric and ecosystem big data in solving the SDGs (Ford et al., Citation2016), it is important to acknowledge the interconnectedness of the goals; how can we use the data as effectively as possible to achieve specific SDGs and, on the other hand, to support the Agenda 2030 as a whole? Achieving the SDGs requires careful scrutiny of the interactions between various environmental and socioeconomic aspects of the goals and the targets. In general, the possible trade-offs and co-benefits among SDGs need to be addressed and balanced (United Nations, Citation2019). It is recognized that the goals relate and depend on each other but there are different approaches how to proceed (e.g. Scharlemann et al., Citation2020). The interconnectedness makes the vision of sustainable future coherent and ambitious, but there are also some related challenges it poses to the implementation of SDGs. These challenges include lack of data coverage and/or missing variables for many indicators, imbalance in capacities between countries and intertwined but mutually restricting indicators. Open big Earth data can help to tackle these challenges by enabling collecting scientific data on regional and global scales thus supporting the scientific accuracy, timeliness and diversity of research and novel solutions related to SDGs (Guo, Citation2020).
Only ten years remain to achieve the SDGs. Currently it is estimated that the measures taken have not been nearly sufficient, although a lot of progress have been made in terms of, for example, national strategies that incorporate SDGs, private sector initiatives and civil society mobilization (United Nations, Citation2019). Already well before the establishment of the Agenda 2030, it was recognized that environmental issues are also social by nature (e.g. Hackmann, Moser, & St, Citation2014). Thus, we need to constantly look for new frameworks for understanding environmental change. To reach the goals in time, the interactions between different SDGs need to be understood better. Understanding the environment-human linkages of the SDGs is also essential and requires to be scrutinized even more carefully than has been done until now. Environment–human linkages include both nature’s effect on people and human impact on the environment (Scharlemann et al., Citation2020). Although assessments about interactions between SDGs exist, they are mostly concentrated on specific SDGs or a defined group of actors (Scharlemann et al., Citation2020). The global effort to implement SDGs has shown that understanding and creating change while living in the Anthropocene requires an approach that acknowledges human-environment or socioecological systems (United Nations, Citation2019). More than that, it often requires an approach that covers not only interdisciplinary scientific cooperation but also working together with non-academic professionals and different groups of stakeholders (Hackmann et al., Citation2014). There continues to be a growing need for transdisciplinary approach from society and the scientific community, especially in relation to sustainability (Lang et al., Citation2012).
The big data based on comprehensive, long-term atmospheric and ecosystem observations is essential in understanding grand environmental challenges (e.g. Kulmala, Citation2015, Citation2018). Reinforcing open access, comprehensive measurements and transdisciplinary methods support the work towards sustainable development in the SDG framework. The atmospheric and ecosystem data and research are more useful when studied as a part of a comprehensive approach that acknowledges the various feedback loops that take place when we scrutinize environmental, socio-economical and cultural factors as a whole (Kulmala et al., Citation2015; Lappalainen et al., Citation2016). The aim of this paper is to summarize how the comprehensive atmospheric observations within the SMEAR observation network can contribute towards reaching UN SDGs from local to global scale.
2. In situ big data and the SMEAR concept
2.1. Comprehensive and continuous long-term in situ measurements
We need comprehensive, long-term in-situ measurements integrated with remote sensing, experimental approach and modelling () to quantify and predict current and future climate change drivers, to unravel mechanisms and feedbacks involved in ecosystems’ responses to climate, and to select and test mitigation and adaptation measures (Guo, Citation2018; Kulmala, Citation2018). Such holistic approach requires strategic collaboration between environmental disciplines.
Figure 1. SMEAR II is our flagship station in a boreal coniferous forest with satellite sites in a nearby lake and peatland. It provides comprehensive, on-line long-term measurements on the Earth surface–atmosphere processes and interactions since year 1995. The world’s longest data series on atmospheric aerosol size distribution has been collected at SMEAR II. The comprehensive ground-based data are best utilized when combined with remote data and multiscale models
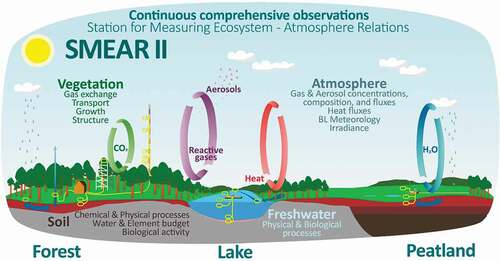
SMEAR is a well-equipped environmental observation station to provide comprehensive, on-line measurements on the Earth surface–atmosphere processes and interactions to create understanding from nano-scale to global scale. SMEAR is a unique research infrastructure concept in its comprehensiveness. SMEAR station is an integrated and sophisticated approach to observe in a coherent way material and energy exchange between the atmosphere and the Earth surface in-situ 24/7 (). It is designed to provide high quality, unbiased data and associated metadata on land, aquatic and urban Earth surface–atmosphere interactions. Compared to several other organized observation networks in Europe and globally, which are often focused on certain type of observations, such as greenhouse gases, trace gases, atmospheric aerosols or ecosystem functions, the SMEAR station integrates the measurements across disciplines and domains (Hari et al., Citation2009, Citation2016). In this way only, it is possible to identify the interactions and feedback loops () that are central to finding sustainable solutions to grand challenges in both global and regional scale (e.g. Kulmala et al., Citation2020, Citation2004)
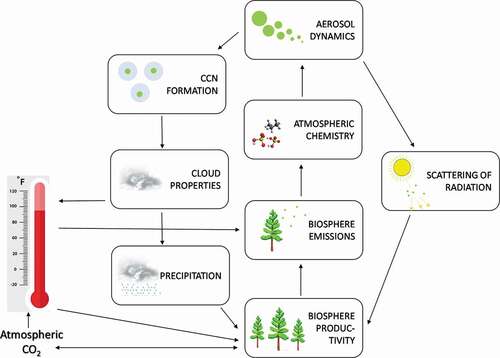
Figure 2. Schematic example of a complex feedback loop studied at SMEAR II (Kulmala et al., Citation2020, Citation2014, Citation2004). Biosphere productivity and further biogenic volatile compounds emitted from vegetation contribute to atmospheric chemistry and aerosol dynamics. Aerosol dynamics feeds back to biosphere productivity and emissions via two loops: 1) by contributing to cloud condensation nuclei (CCN) and further to cloud properties and precipitation, and 2) by increasing the ratio of scattered solar radiation that plants can utilize more efficiently than direct radiation. Finally, the ecosystem-atmosphere entity feeds back to the global climate as increasing air temperature and atmospheric CO2 concentration have a positive effect on boreal vegetation productivity and emissions, whereas vegetation productivity decreases atmospheric CO2 concentration via terrestrial carbon sink increasing cloudiness, which decreases air temperature
Measurement data are open and easily accessible for international multidisciplinary research community at a user-friendly interface SmartSMEAR (smear.avaa.csc.fi/, Junninen et al., Citation2009). The SMEAR services include open access to comprehensive multidisciplinary long-term atmosphere–ecosystem observation data, physical and virtual access to the platforms, technical design and assistance in setting up new measurement sites, hands-on training at the platforms, help in troubleshooting instrument malfunctions, and beyond state-of-the-art instrument development, in-depth calibration, and development and benchmarking new technologies.
Synergistic use of the continuous comprehensive in-situ measurements, satellite and other remote sensing data, experiments, laboratory analysis and multi-scale modelling provide novel insights into the complex natural and anthropogenic processes within and between the atmosphere and the other parts of the Earth system in different ecosystems. The SMEAR stations together with their open data platform SmartSMEAR bring accessible many unique and invaluable data series from the sites that have been in operation already for decades. The continuity and versatility of scientifically rigorous environmental data series that are nationally and internationally harmonized are required to produce sufficiently diverse knowledge to understand the critical changes in the atmosphere and environment. Long and multidisciplinary time series allow us to promote serendipitous science, i.e. formulate and answer scientific questions in the future that we do not know yet to exist. SMEAR observations are also an important verification component complementing Earth observations from space and providing unique ground-truthing for the remote sensing information collected by current and future satellite missions.
2.2. The flagship station SMEAR II
The SMEAR II station is located in a managed, rather homogenous Scots pine (Pinus sylvestris L.) stand established in 1962 by sowing on a flat terrain at Hyytiälä Forestry Field Station of the University of Helsinki (61°51ʹN, 24°17ʹE, 181 m above sea level; Hari & Kulmala, Citation2005). The station represents moist boreal coniferous forests. Boreal forests cover about 30% of the Earth’s forest area and moist boreal forests contain about 20% of carbon present in the terrestrial biome (Scharlemann, Tanner, Hiederer, & Kapos, Citation2014). Nearby lake and peatland (a patterned bog) area are SMEAR II satellite sites. The SMEAR II station represents globally important background conditions with a relatively low anthropogenic impact.
Measurements are carried out at ecosystem and atmospheric storage pools and interfaces involving three different layers: soil, tree canopy and the atmosphere. Various methods, operating simultaneously at different spatial and temporal scales are used to measure the material and energy fluxes between the different storage pools. For example, the interface between a leaf of a tree or soil and the atmosphere is locally enclosed in a chamber, and different fluxes are determined from the mass balance of the chamber. Turbulent fluxes at ecosystem scale are measured with micrometeorological techniques. Concentration gradients in the air and soil are used for making flux estimates by applying available transport coefficients. Aerosol and ion size distributions are measured in order to be able to study ion, cluster and aerosol dynamics in the atmosphere inside and above the forest. Solar irradiance, diffuse irradiance, photosynthetically active radiation and radiation balance are monitored above the canopy, because solar radiation is the source of energy for several processes in the ecosystems and the atmosphere. Two-decade long example time series of wind direction and intensities, soil temperature, ecosystem gross primary production, atmospheric O3 concentration and atmospheric particle concentrations from SMEAR II and SMEAR I stations are shown in . The selected variables demonstrate the significant interlinkages among the ecosystem and atmosphere. Wind direction and intensity are the examples of meteorological data (), which are needed when tracking air mass origin for example during pollution episodes in Värriö (see also Section 4.1) or new particle formation events. Soil temperature is an example of an important environmental variable controlling growth and other vegetation processes (; Lintunen et al., Citation2020), whereas ecosystem gross primary production is a good example of a variable that tightly links meteorology and biosphere, because meteorological variables, most importantly solar radiation, drives photosynthesis in plants, and by photosynthesis plants absorb CO2 from the atmosphere and store it in plant biomass and soil (). As radiative conditions on Earth are modified by cloudiness and aerosol load in the atmosphere, photosynthesis is interlinked to formation and growth of aerosol particles (Ezhova et al., Citation2018). On the other hand, the oxidation products of volatile organic compounds (VOC), emitted by vegetation, can contribute to particle formation and growth, creating thus an important feedback between atmospheric and ecosystem processes (; Ehn et al., Citation2014; Kulmala et al., Citation2014). Tropospheric O3 is an example of atmospheric oxidants, oxidating for example VOCs, and thus making O3 a player in aerosol formation (). In addition, tropospheric O3 concentration has multiple effects in the atmosphere as it is a greenhouse gas and it affects air quality and human health (Doherty, Heal, & O’Connor, Citation2017). The last example variable, atmospheric particle concentration, is hence an essential variable affecting climate via aerosol-radiation and aerosol-cloud interactions, air quality and human health (; Rosenfeld et al., Citation2014; Doherty et al., Citation2017). The aim with all these measurements is to understand the processes responsible for the interactions and feedbacks between the Earth surface and atmosphere, atmospheric composition and fluxes as well as ecosystem processes. The most relevant processes studied at the site are photosynthesis, respiration, transpiration, methane dynamics, emission of volatile organic compounds, atmospheric new particle formation and growth, aerosol dynamics and cloud microphysics.
Figure 3. Wind roses from SMEAR II (Hyytiälä station) and SMEAR I (Värriö station) from 2004 to 2020. The length from the centre shows the frequency of the wind directions (%) and colour scale reflects the intensity of the winds associated with the direction. The results are presented as 10 min averages measured above the canopy (33.6 m in Hyytiälä and 16 m in Värriö)
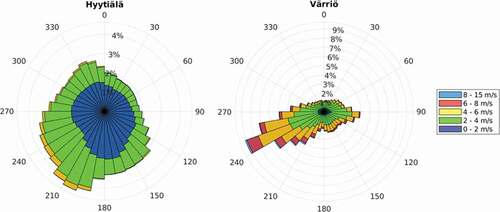
Figure 4. Daytime (12:00–15:00) monthly median near surface soil temperature between 1997 and 2020 (a) in SMEAR II (Hyytiälä) and (c) SMEAR I (Värriö). Average diurnal variation in soil temperature shown as hourly medians of January and July data of the whole measurement period for (b) Hyytiälä and (d) Värriö
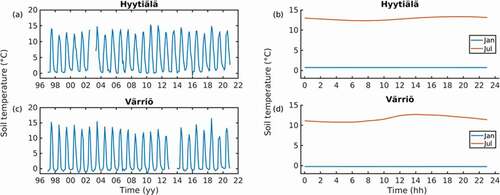
Figure 5. Daytime (12:00–15:00) monthly median ecosystem gross primary production (GPP), i.e. the CO2 uptake rate through photosynthesis (a) in SMEAR II (Hyytiälä) between 1997 and 2020, and (c) in SMEAR I (Värriö) between 2012 and 2020. Average diurnal variation in GPP shown as hourly medians of January and July data of the whole measurement period for (b) Hyytiälä and (d) Värriö
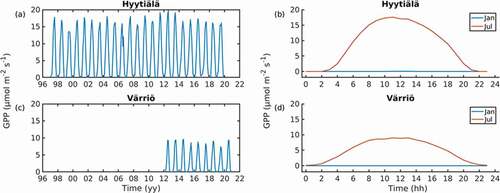
Figure 6. Daytime (12:00–15:00) monthly median O3 concentration between 1998 and 2020 (a) in SMEAR II (Hyytiälä) and (c) in SMEAR I (Värriö). Average diurnal variation in O3 concentration shown as hourly medians of January and July data of the whole measurement period for (b) Hyytiälä and (d) Värriö
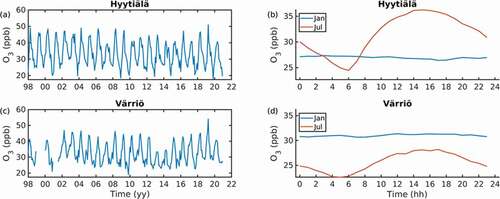
Figure 7. Daytime (12:00–15:00) monthly median total (Ntot) and nucleation mode (Nnuc) particle number concentrations between 1998 and 2020 (a) in SMEAR II (Hyytiälä) and (c) in SMEAR I (Värriö). Average diurnal variation in particle concentrations is shown as hourly medians of January and July data of the whole measurement period (b) for Hyytiälä and (d) for Värriö. The particle number concentrations were calculated using DMPS (differential mobility particle sizer) measurements. The nucleation mode includes particles with diameter between 3 and 25 nm in electrical equivalent diameter. Note that in Värriö the lower cut-off size of the DMPS system was 8 nm until May 2003. The upper cut-off size of Hyytiälä DMPS was extended from 500 nm to 1000 nm in December 2004, and in Värriö the upper cut-off size was extended from 500 nm to 850 nm in October 2004
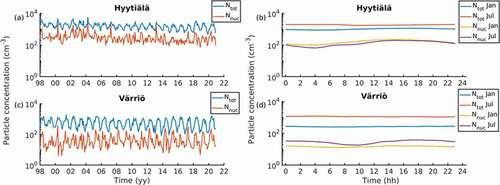
Clear seasonal and diurnal patterns are visible in , together with some long-term trends and differences between the stations. The distance between SMEAR I and SMEAR II stations is approximately 7 degrees of latitude, and they both represent a rather homogenous Scots pine forest area. Due to e.g. colder air temperature and shorter growing season, ecosystem gross primary production is nearly 50% lower in northern SMEAR I than southern SMEAR II (). Although seasonal air temperatures are very different at these stations, the difference in soil temperatures is not that large, which in winter is explained by the isolating snow cover (). Wind roses show that westerly winds dominate at the sites, as can be expected, yet the wind directions are more evenly distributed at the southern SMEAR II station (). However, in the wind data from SMEAR I we can see a secondary maximum in easterly wind directions, which contribute to the advection of air pollutants from the Kola peninsula region (Kyrö et al., Citation2014). The ozone concentrations in summer are higher at SMEAR II and in winter in SMEAR I and the diurnal minimum is at early morning hours, which relates to the photochemistry of ozone and temporal variations of intensity of shortwave radiation at the sites (). Both the total and nucleation mode particle number concentrations are higher in the southern SMEAR II than in the SMEAR I () due to lower concentrations of precursor gases and fewer local pollution sources.
The main components of SMEAR II are i) an instrumented, 128 m tall mast, ii) 35 m tall tower for monitoring aerosols, air ions, clusters and trace gases, iii) aerosol and mass spec containers and cottages, iv) instrumentation for monitoring tree physiology and radiation (by two 25 m towers), v) two instrumented mini catchments and vi) radar and lidar field. The total amount of measured variables at SMEAR II is >1000 when all measurement heights and size channels of aerosol instruments are considered. All together we are measuring more than 1200 different variables. These variables include for example:
Concentrations and fluxes of CO2, H2O, CH4, CO, SO2, NO, NOx, O3 and various biogenic and anthropogenic volatile organic compounds as well as carbonyl sulphide
Air temperature, wind speed and direction, relative air humidity, ambient pressure, solar radiation, precipitation, evapotranspiration, snow depth and snow water content
Atmospheric vertical profiling with cloud and weather radar and a microwave radiometer
Fluxes of momentum, sensible and latent heat
Soil temperature, soil heat flux, soil moisture, soil water content, water table level and soil matrix potential
Sampling of rain, snow, litter, soil and water runoff flow
Cluster chemical composition and concentration, particle volatility, aerosol total number concentration, aerosol particle number size distribution, aerosol chemical composition, aerosol optical depth, atmospheric absorption, aerosol particle scattering and back scattering, mobility distribution of atmospheric ions
Number of particles able to form cloud droplets at the ground level
Boundary layer height and wind profile in the boundary layer, vertical distribution of kinetic energy
Cloud base height and radar reflectivity
Characterization of precipitation, amount, droplet distribution, phase
Black carbon particle mass concentration, aerosol black carbon mass concentration and attenuation as well as heavy metal and ion masses and radon
Tree stem, branch and root temperature, tree stem, branch, root and mychorrizal growth, tree sap flow and pressure, chlorophyll fluorescence and leaf area index
Photochemical reflectance index and normalized difference vegetation index
Over the years, the SMEAR II station also attracts innovative and comprehensive research collaboration with top-level infrastructures. These include e.g. aerosol formation studies (Boy et al., Citation2004; Kulmala et al., Citation2001), atmospheric oxidation (Crowley et al., Citation2018; Williams et al., Citation2011), Zeppelin camping in 2013 (Nieminen et al., Citation2015) and the U.S. Department of Energy (DOE) Atmospheric Radiation Measurement (ARM) user facility for the Biogenic Aerosols – Effects on Clouds and Climate measurement camping in 2014 (Petäjä et al., Citation2016).
2.3. Co-location of international research infrastructures
SMEAR stations provide co-location of different international research infrastructures (RI) such as European research infrastructures ICOS (Integrated Carbon Observation System, www.icos-cp.eu), ACTRIS (Aerosol, Clouds and Trace Gases Research Infrastructure, www.actris.eu), eLTER (Integrated European Long-Term Ecosystem, Critical Zone & Socio-Ecological Research Infrastructure, www.lter-europe.net/elter) and AnaEE (Infrastructure for Analysis and Experimentation on Ecosystems, www.anaee.eu), as well as to WMO-GAW (the Global Atmospheric Watch by World Meteorological Organization), community.wmo.int/activity-areas/gaw). ICOS-FI provides information of regional budgets of GHG (greenhouse gases) sources and sinks, their human and natural drivers, and the controlling mechanisms; ACTRIS-FI provides information of atmospheric composition and processes, climate and air quality; LTER-FI provides information on ecosystem processes, biodiversity, land-use change and ecosystem services; whereas AnaEE-FI manipulates environmental variables to foster research on impacts of future conditions. WMO-GAW provides global coordinated atmospheric composition observations and analyses. The co-location means that these different environmental components, their interactions and combined effects are studied at the same location, which yields considerable added value for the measurements (Kulmala, Citation2018). The Flagship station SMEAR II has operational, integrated measurements of the mentioned European research infrastructures as well as WMO/GAW, which enables to study atmosphere, ecosystems, their interactions and how they contribute to the Earth system as a whole. The coordinated and integrated observations in the atmosphere–ecosystem domain will help the societies to respond and find best practices related to climate change, mitigation and adaptation, land-use change, environmental degradation and poor air quality.
We see that there is a great synergy to combine the SMEAR concept and international RIs in the environmental domain. Co-location of international RIs enables answering research questions that cannot be answered by measurements conducted with a single RI, because comprehensive and multidisciplinary measurements over the traditional boundaries enable studying complicated interactions and feedback processes between different environmental components. This is the only way we can understand the complex changes taking place in the environment. We see that the SMEAR concept brings benefits for the international research infrastructures, because it offers a structured platform for all the multidisciplinary infrastructure components and thus leads to improved and efficient capacity of stations and other platforms contributing to the international research infrastructures (Kulmala, Citation2018). Also, researchers and technicians working at the SMEAR stations have had a significant contribution in developing the international standardization of various observations. For example, SMEAR expertise on nanoparticle measurements and atmospheric mass spectrometry contributes to ACTRIS via two central facility units that are parts of Centre for Aerosol In Situ Measurements and Centre for Reactive Trace Gases In Situ both operated at University of Helsinki. Similarly, the international research infrastructures bring benefits for the SMEAR concept, because they offer access to harmonized protocols, standardized data and tools, which allow seamless comparison of data from different ecosystems and sites across the world. A set of agreed metadata and standard parameters measured at all of the individual sites is the basis for establishing a coherent data source.
2.4 Contribution of big data on Earth surface–atmosphere interactions to UN Sustainable Development
The SMEAR concept produces research and data services to solve questions related to sustainability, climate change, environment degradation and air quality, and thus strongly supports the SDGs from the UN Agenda 2030. The research enabled by the SMEAR stations contribute to the solutions that will help the business sector and society to reach the Paris climate targets, to mitigate and adapt to climate change, and thus support the EU Green Deal commitments and the UN SDGs. The Whole System Approach of the SMEAR concept (Hari et al., Citation2009, Citation2016), allows us to address the complex social questions related to climate and environment at different scales and disciplines. This makes it possible to raise socially relevant research questions in combination with the natural scientific observational schemes and provides a good foundation for policy-relevant research on environmental questions.
There is a need to improve the climate projections, to develop the terrestrial carbon sequestration options taking into account also other interlinked climate forcers like aerosols and trace gases, to lift up the existing monitoring and forecasting systems of the terrestrial carbon cycle to an entirely new level, to carry out more and better measurements spanning from process level to global scale for the better understanding of both natural and anthropogenic carbon sources and sinks, as well as atmospheric processes affecting air quality and furthermore health. The global annual cost of climate change impacts will reach an estimated of hundreds of billions of euros by 2030 (UNEP, Citation2016) and it will increase sharply with the level of global warming. These practical needs provide emerging business opportunities for various industries, and European Green Deal Investment will mobilize at least 1 trillion euros of sustainable investments over the next decade (European Commission, Citation2020). The information produced by extensive in-situ measurements combined with remote sensing and new verification systems is essential for society to design the economically and socially optimal sustainability strategies and climate-neutrality pathways and to be able to meet Paris Agreement targets (Kriegler et al., Citation2018). Continuously operated, comprehensive measurement stations and experimental platforms produce high-quality, standardized data of the environment and are a unique springboard for new innovations. The measurement data and innovations enable establishment of start-up companies and provide the business sector with tools to move towards carbon-neutral and environmentally sustainable operations.
The environmental and sustainability challenges are closely connected with each other and require a multidisciplinary approach to be properly addressed. The SMEAR concept combines these aspects into one integrated RI with distributed sites and provides cutting-edge science to develop a sound process-based understanding and predictions of the major environmental trends of climate change, land-use change, environmental degradation, air quality, adaptation of ecosystems to climate change and the quality of their life supporting services. Scientific questions related to climate change are the most prominent examples, where different biological, physical, chemical and anthropogenic processes are interlinked and cannot be studied separately.
SMEAR-type data are especially needed in understanding global biogeochemical interactions between the atmosphere and ecosystems, determining how climate-ecosystem feedback loops may change atmospheric composition in the future and how ecosystems will respond to environmental changes. As specific examples, the SMEAR data have been used to directly observe for the first time atmospheric aerosol nucleation above a boreal forest (Ehn et al., Citation2014; Kulmala et al., Citation2013), to quantify the feedback between climate warming causing increased ecosystem carbon sink and emission of volatile organic compounds from the ecosystem causing cooling via aerosol formation (Kulmala et al., Citation2020, Citation2014), to link seasonality of photosynthesis and volatile organic compound (monoterpene) synthesis in a boreal forest (Aalto et al. Citation2015), to quantify global and regional aerosol and precursor concentrations (e.g. Asmi et al., Citation2013; Kontkanen et al., Citation2017; Laj et al., Citation2020), to assess aerosol sources in continental scale (Crippa et al., Citation2014; Fountoukis et al., Citation2014), to study the climate responses of the GHG fluxes between atmosphere and different ecosystems (Fernández-Martínez et al., Citation2017; Helbig et al., Citation2020; Knox, Jackson, & Poulter et al., Citation2019; Korrensalo et al., Citation2018; Rinne et al., Citation2018), to improve peatland carbon cycling and wetland methane process modelling (Raivonen et al., Citation2017), and to reveal substantial rates of and needed conditions for new particle formation in polluted environment (Kulmala et al., Citation2021; Yao et al., Citation2018). Recently, the SMEAR stations have provided data as part of the ACTRIS and ICOS infrastructures to assess the impacts of European scale lockdown to atmospheric composition and provided analysis related to aerosol dispersion (ACTRIS, Citation2020; Dinoi, Gulli, Ammoscato, Calidonna, & Contini, Citation2021), and shown the reduction in urban CO2 emissions as a result of COVID-19 lockdown across Europe (Papale et al., Citation2020).
3. VÄRI case study
3.1. Aims of VÄRI end-user case study
Värriö Research Station (www2.helsinki.fi/en/research-stations/varrio-subarctic-research-station), founded in 1967, is located in the Värriö strict nature reserve (founded 1991), in the municipality of Salla, close to the Finnish–Russian border. The station hosts the SMEAR I measurement station, which was the first SMEAR station founded in 1991 (Hari et al., Citation1994). The measurements cover long-term observations on environmental conditions, such as ecosystem phenology, berry and cone production, and bird and insect populations and measurements and analysis on the dispersion of air pollutants, atmospheric processes, and the processes in the subarctic ecosystems. Värriö research station participated in the EU-funded project Leading-edge research at Värriö Research Station in 2018–2020 to benefit the economy of Eastern Lapland administered by local federation of Eastern Lapland (VÄRI). The goal of the project was to increase co-operation between Värriö Research Station and the local economy and surrounding society in general and to increase the use of top-quality environmental observations is done at the Värriö station. The data have not been well known by the local communities and should be better utilized to give additional value for the locals (economy, marketing, public awareness). The idea was to disseminate the results of research conducted at the station for the benefit of local businesses and residents.
In the VÄRI project, the research results were refined into an easily understandable form for the use of the local businesses and to familiarize the people living near-by with the station and its data sets. The aim was to involve local businesses and to enable them to use refined research data for their product development. To enable this, the local entrepreneurs were offered a chance to visit the station and attend in a workshop at the station. In this way, the research data can be utilized to meet UN sustainable goals in local point of view.
3.2. VÄRI-project results, impacts and next steps
VÄRI-project launched a www-site with popular information about the research area and its special characteristics in travel marketing point of view. Some research data are visualized on the site (kuntayhtyma.visitkemijarvi.fi/fi/hankkeet/paattyneet_hankkeet/vari/pure_and_beautiful_eastern_lapland/#) with animated videos, where it is possible to see the diurnal, annual and long-term changes in the measurement data. Data sets visualized on the web page are heat sum in growing season 1975–2018, deviation of the air mean temperature from long term average (1975–2018) and gain of life expectancy per week in North-Eastern Lapland. As a public outreach, one of the visualized results was the influence of clean air to the prolonged life expectancy. In general, air pollutants, like atmospheric aerosols and other atmospheric pollutants shorten life expectancy (e.g. Lelieveld et al., Citation2020). The experimental data results show that Värriö station air is very clean (e.g. Kyrö et al., Citation2014). Based on parameterized influence on negative health effects and observed concentrations at the station, we calculated a difference of exposure obtained, when comparing the time spent in a polluted megacity and the time in Eastern Lapland. This gave us an indicative value for the increased life expectancy, when spending one week breathing clean eastern Lapland air instead of being exposed to the air in polluted megacity. This was one of the outcomes that the local businesses can utilize to strengthen Eastern Lapland’s image as clean environment for various products and natural resources as well as tourism destination.
Within the project we visualized key parameters from the SMEAR I observations, such as number of snow cover days per year. The results show that the number of snow cover days has decreased approximately five days per decade. Snow probability percentage per day is also estimated on the web page to convey that while global temperature is rising, there will still be a proper, snowy winter in Lapland in decades to come. This information is pertinent to attract tourists to the area, who seek true winter conditions.
As an outreach component, the project created a Pure and Beautiful Eastern Lapland logo as a marketing tool for companies in international tourism, bio-refinery business, forestry and reindeer husbandry as a trademark of clean environment and sustainable way of life. The logo is available for the local companies free of charge.
Summarizing the next steps of the VÄRI-project we identified two key pathways. First, four local upper secondary schools started collaboration with SMEAR I station as their scientific partner. This will underline the strong natural science background of these schools and will increase the attraction of these schools for new students. SMEAR I is in a key role to produce up-to-date, scientific knowledge and integrate it as part of local college studies. Second, in connection with the SDGs and work towards sustainable future, VÄRI-project proposed next steps towards low-carbon local society. There is a clear need to inform the decision makers, local inhabitants and companies to decrease their carbon footprint. This should be done in a harmonized manner and in connection with the environmental observations at SMEAR I in Värriö.
As a summary, the VÄRI-project was a proof-of-concept of co-operation between scientific station and local community. It was a pilot project, where regional council, municipalities, companies, educational establishments and local people worked together with researchers from the local station, got to know each other and created ways to work together. To expand this work, there are also few other research stations in the Finnish Lapland, e.g. Kilpisjärvi biological station (University of Helsinki) and Pallas-Sodankylä atmosphere-ecosystem supersite (Finnish Meteorological Institute), which provide environmental data pertinent to the sustainable development of the region. The opportunities should be taken advantage of following the examples from the VÄRI-project.
4. From local via regional to global
4.1. From local via regional
At the local–regional scales the SMEAR measurements provide data to increase process understanding of atmosphere–earth surface interactions and to answer specific questions such as local/regional air pollution load and if combined with the trajectory analysis also its potential sources. For example, the observed new particle formation trends in the SMEAR I station in Värriö, have been connected to the sulphur emissions transported from Russia. Kyrö et al. (Citation2014) showed that the policy action on the sulphur emissions in a Kola Peninsula region, in Russia, had positive impact on the local air quality and reduced pollution load also in Finland, near the Russian border. The Värriö case study, the VÄRI project, introduced in the previous chapter, demonstrated how the station of comprehensive, long-term measurements of environmental monitoring and related scientific results can be used for the benefit of the local community, in this case, for bio-refinery business, forestry, reindeer husbandry and tourism in the Salla municipality region.
In Helsinki, we have the SMEAR III station operating as a cluster at three different locations, in the Helsinki city centre, in Kumpula and in a sub-urban Viikki region (www.atm.helsinki.fi/SMEAR/index.php/smear-iii). Referring to SDG 11, “Sustainable cities and communities”, the cities generate ca 70% of human-induced greenhouse gas emissions (UN Habitat Strategic Plan 2020–2023, 7, Citation2019). The SMEAR concept provides e.g. comprehensive CO2 data for the verification of CO2 emissions in the city environment and comprehensive atmospheric trace gas and particle data for studying air pollutants. For example, Rantala et al. (Citation2016) studied the anthropogenic and biogenic sources of volatile organic compounds in urban environment, and Karttunen, Kurppa, Auvinen, Hellsten, and Järvi (Citation2020) showed that street trees weaken pollutant dispersion but also enhance removal by dry deposition in urban environment.
In China, urban measurements, based on SMEAR station concept, done in Nanjing (Ding et al., Citation2013, Citation2016a, Citation2016b; Huang et al., Citation2016; Qi et al., Citation2018) and Beijing (Cai et al., Citation2020; Chen et al., Citation2021; Kulmala et al., Citation2021; Liu et al., Citation2020; Wang et al., Citation2020; Zhou et al., Citation2020), have demonstrated the interactions between local and regional weather conditions and dynamics with local and regional pollution cocktail (Kulmala, Citation2015). Comprehensive atmospheric observations in a mega city environment enables city authorities to monitor the city-sub-environments from the polluted street canyons to sub urban districts and to measure anthropogenic emissions, but also indoor-outdoor emission flows. These measurement activities have also provided unique data on how COVID-19 lockdown and societal changes have influenced environmental conditions locally in megacities and regionally in a gigacity. Urbanization of East-China has extended to scale where cities and megacities are merging inside Beijing-Xi’an-Nanjing-Shanghai region that can be called as gigacity (Kulmala et al., Citation2021b). Environmental processes inside this region are dominantly urban with almost extinct rural processes. This is causing novel environmental conditions with unique processes and thus the concept gigacity has been proposed.
SMEAR station concept has been used to construct urban measurement stations in Nanjing and Beijing. Station for Observing Regional Processes of the Earth System (SORPES, Ding et al., Citation2013, Citation2016b) of the Nanjing University has provided data since 2012 with tens of publications produced during these years. SORPES II station is currently under construction in Suzhou-city. Nanjing University has also established, together with University of Helsinki, a Joint International Research Laboratory of Atmospheric and Earth System Sciences (JirLATEST) in 2015. SORPES is capable of carrying out simultaneous and coordinated observations with other SMEAR type stations in China and globally, and during the following years the concept will be expanded from Nanjing city scale to Jiangsu province scale by joining the data with SORPES II station in Suzhou. Beijing University of Chemical Technology (BUCT) has established an urban measurement station in Beijing. BUCT station has received political support from both Finnish and Chinese governments and has provided novel publications on atmospheric processes in Beijing (e.g. Chen et al., Citation2021; Zhou et al., Citation2020) and also lately the influence of COVID-19 lockdowns on pollution cocktail in capital of China (Yan et al., Citation2021). SORPES and BUCT stations are the cornerstones for gigacity concept (Kulmala et al., Citation2021b) and have provided a platform for collaboration activities for example with Chinese Academy of Sciences (CAS) and Tsinghua and Fudan Universities.
When connecting environmental information to local socio-economic analysis, we exploit the use of environmental data to the next level, boost new businesses like the early warning services and forecasts. Overview of the regional characteristics e.g. observed changes in the atmospheric composition, ecosystems and requirements for the land-atmosphere monitoring system have been carried out for the new Silk Road Economic Belt and Russian Far East environments (Lappalainen et al., Citation2018; Petäjä et al., Citation2021). This type of regional analyses is needed to better tackle the goals, such as “disaster reduction and transport”, of the SDG 11 “Sustainable cities and communities” in a more detailed manner.
4.2. To global context
The UN SDG 2030 agenda calls for solving the global environment-economic development problems in an integrated manner. This will require a global verification system with big data together with advanced data analytics. The SMEAR station concept, as a hierarchical station structure and how the existing networks of e.g. meteorological stations, flux stations and advanced stations could be optimally organized, have been discussed by Hari et al. (Citation2016). Furthermore, the specific characteristics and future research infrastructure needs for the marine Earth components have been discussed by Vihma et al. (Citation2019). The implementation of the most comprehensive network of advanced stations would not only provide the complementary big data to construe the radiative forcing by different emissions and drivers (IPCC report), but would also deliver a long-term, consistent big data to verify the impact of the mitigation actions and to further analyse the factors cross-affecting global challenges (Kulmala, Citation2018).
To contribute to the UN SDGs better, especially to the SDG 13 “Climate Action” in the future, observations need to be combined with models. By combining the SMEAR in situ data with satellite-based remote sensing, laboratory experiments, computer models together with machine learning tools we can even re-new our understanding of the land–atmosphere–ocean feedbacks and better quantify the complex air chemistry and physics in the urban environments (Kulmala, Citation2018; Guo, Citation2018; ). Especially satellite-based remote sensing provides unique connection points with ground-based measurements provided by the SMEAR stations. Long-term collaboration with Aerospace Information Research Institute (AIR) of the Chinese Academy of Science (CAS) and the Digital Belt and Road program (DBAR) address the open data access and sharing of big data from satellite imagery and other Earth observations. This is especially needed in Asia, the Middle East and East Africa to ensure the maximum usage of research data towards the sustainable development of these regions and the UN SDGs (Guo, Citation2018). The space-borne remote sensing is well established and provides high quality data for the regions through satellite missions of European Space Agency (ESA), NASA and Chinese Satellite Systems. The data availability and easy access can be organized e.g. by GEOSS (the Global Earth Observation Systems of Systems) programs or through European Environmental Research Infrastructure (ENVRI) to European Science Cloud (EOSC).
4.3. PEEX program, a multilateral framework
Starting from 2012, Pan-Eurasian Experiment (PEEX) program has been promoting the approach towards integrated, comprehensive Earth surface–atmospheric measurements especially in the Northern Eurasian region and in China (Kulmala et al., Citation2015; Lappalainen et al., Citation2016; Petäjä et al., Citation2021). The approach has included a concept design of a hierarchy of stations for a network mostly based on existing station infrastructure and capacity (Alekseychik et al., Citation2016; Hari & Kulmala, Citation2005; Hari et al., Citation2016; Vihma et al., Citation2019). PEEX provides a holistic, science-based approach supported by the capacity building activities e.g education, training and outreach.
Russia is the Arctic country having over 20,000 kilometres coastline of the Arctic Ocean (Zenkovich, Citation1985). Siberia is the largest boreal forest and wetland region of the world (Solomeshch et al., Citation2005). Thus, the impact of the climate change mitigation actions taking place in Russia has fundamental effect also on the global climate. In addition, air quality problems in Russian cities, especially in Moscow are a significant health issue (Chubarova et al., Citation2019). In the frame of PEEX, we have carried out several bilateral and international projects, but just recently started Russian Mega Grant project “Megapolis – heat and pollution island: interdisciplinary hydroclimatic, geochemical and ecological analysis” will be the first concrete step towards SMEAR station network in Russia and setting up the first station in Moscow megacity environment. The project is setting up a new Laboratory of Urban Environment and Climate for studying environment impact on citizens’ health in megacities based on the SMEAR concept.
As a whole, the Eastern European PEEX academic network has 44 universities and research organizations (singed a Memorandum of Understanding (MoU), status April 2021), which also provides potential stations for upgrading measurements based on the SMEAR concept. Currently, PEEX China network includes 30 universities and city administrations, and 9 of them are officially apart of the PEEX network (singed a MoU), that are mainly interested in monitoring and studying air pollution formation and dynamics in the gigacity region and analyzing the indoor air quality. The Chinese Ecosystem Research Network (CERN) for the ecosystem monitoring is part of global eLTER network and supports the SMEAR concept network in China. CERN provides a standardized station network that could be upgraded based on the SMEAR concept by including an atmospheric component to the measurement setups. One of the main partners in PEEX China is Aerospace Information Research Institute (AIR), Chinese Academy of Sciences (CAS) and their contribution to PEEX through satellite research provides vital knowledge on environmental process in Eurasia. The other main partner is Nanjing University, and their contribution is to promote and take steps towards establishing the comprehensive observation network in China.
4.4. Future concept
The SMEAR flagship station serves as a big data platform to contribute to the SDGs on all levels and scales in the society by offering big data for the stakeholders from research community to public and private sectors and citizens. In this way we can get from novel scientific knowledge to practical solutions and policy making and verification. To exploit the ground based in situ data efficiently, we need to contract new data products and user-friendly data interfaces together with the service development applicable from local to global scales. The Smart-SMEAR interface (Junninen et al., Citation2009) enables e.g. data mining for trace gas and aerosol data, meteorological parameters and the use of air mass back-trajectories (). Data hackathons are one example of a modern co-design event to gather all stakeholders, data provides, researchers, coding experts and end users around the same table to innovate new services (Concilio et al., Citation2017). We also need to educate instrument experts, big data analysts and next generation of scientists, all having background in multi and cross disciplinary system understanding (Lauri, Ruuskanen, Riuttanen, Kulmala, & Hari, Citation2020) and combine novel e-learning to big data. In Finland, we have launched this type of national academic framework called “Climate university” (https://blogs.helsinki.fi/climateuniversity/).
Traditionally, research infrastructures have served the research community and enabled data pool for scientific breakthroughs. As a showcase, the initial scientific breakthrough based on the SMEAR II data was the discovery of aerosol particles in the forest environments and connecting their growth to biogenic organic compounds emitted by the forest vegetation (Kulmala et al., Citation2001; Kulmala, Hari, Laaksonen, Vesala, & Viisanen, Citation2005; Kulmala et al., Citation2012). We are now expanding the scientific scope from atmospheric sciences towards social, economic and legal sciences and combining the SMEAR data together with socio-economic data sets. The marine SMEAR concept could provide comprehensive observations in applications such as sea ice-ocean conditions for the short-term and seasonal-to-decadal forecasts, which would improve sustainable planning and risk assessment of offshore construction, ship transport and fisheries (Vihma et al., Citation2019). The agricultural SMEAR concept could improve sustainable land use and food production by improving the GHG measurements from agricultural soils for the greenhouse gas inventories (Syväsalo, Regina, Pihlatie, & Esala, Citation2004). Also, SMEAR type data together with regional dispersion models can be used for source identification of atmospheric pollutants (e.g. Baklanov et al., Citation2017). These examples demonstrate the multi potential of the atmosphere-Earth surface data and how it can be used for understanding the atmospheric chemistry and atmospheric composition at local and regional scales and in several domains for the benefit of the society and contributing to the SDGs. Comprehensive atmosphere-Earth surface data can also be used to develop and further support Earth System Simulators that include atmosphere, land and marine Earth components (e.g. Law et al., Citation2017) and the comprehensive data sets together with simulators are potentially crucial tools to meet the needs of the SDGs.
Standardized data are needed for the evaluation of the periodic global stock take, which is the key element to assess collective progress towards the Paris Agreement and the UN SDGs long-term goals. SMEAR big data contribute to these international and country level data collections. International organizations like Intergovernmental Panel on Climate Change (IPCC), World Meteorological Organization (WMO), GEOSS- Group on Earth Observations and UN are coordinating and collecting standardized data on a global scale and thus support data interoperability. SMEAR big data also strengthens the scientific basis for EU’s land use, land-use change and forestry (LULUCF) policies by providing data for the development of economic-ecological-climatological models on forest resources, carbon sequestration and timber use at stand, market and country level. This all will boost a culture of standardization and interoperability outside Europe, mainly in Asia and in Africa as called by the implementation of SDGs. In the end, the global big data approach can enable the policy makers to make science-based decisions on climate change and air pollution and to perform cutting-edge environmental-energy policies.
In the last years, INAR has made an effort to produce a SMEAR station – service concept for upscaling the station network. The specific measuring device assembly could be tailored for the different type of end users and in a way that the new device setup can produce maximum synergies with the existing station measurement capacity. The product orientated approach enables setting up totally new stand-alone stations. The SMEAR service bases on a modular structure, where instrument modules and services are tailored for local natural or urban environments, for different purposes starting from atmospheric–ecosystem monitoring to urban air quality monitoring. SMEAR II station has been a platform to test, pilot and benchmark novel technologies and instrumentation. We have a proven track record of creating spin-off companies, e.g. Airmodus Ltd. (airmodus.com) and Kärsa Ltd. (karsa.fi/), who also use SMEAR II station for a reference in their marketing. The SMEAR II station has been used as testbed for instrument technology (e.g. for Vaisala).
The integrated measurements, data analysis and the education platform provide a proof of concept for setting up the advanced comprehensive in-situ observation system. Currently SMEAR stations operate in Finland and Estonia, and accredited SMEAR stations are located in Nanjing (Station for Observing Regional Process of Earth System, SORPES, 2010-present) and in Beijing (Haze Beijing by Beijing University of Chemical Technology) in China and also in Cyprus, South-Africa and Greenland. Several new stations are under negotiation and in progress in Chinese megacities, such as Shanghai, Suzhou and Guangzhou, and Moscow in Russia. These stations will mostly be based on academic franchising. For the future aspiration, it is important to recognize that the ground station infrastructure in Europe, Eurasia, Asia, the Eastern Mediterranean and the Middle East (EMME) region, in Africa and in the Arctic regions are driven by different interests. For example, in Europe (a European strategic 2019/2582 (RSP)) the main focus is on verifying the carbon neutrality, in Asia on urban air quality, and in the Artic context on climate change and teleconnections. The modular SMEAR concept can be flexibly modified to meet all of these specific goals.
5. Conclusions
The Grand Challenges of the Earth are interlinked. However, current observations are fragmented into different disciplines and Earth components. For the future, we need an integrated and co-located measurement approach in order to gain better understanding of the Earth system and the various feedbacks between the different Earth components as a whole. Such an approach needs to be strongly linked to international research infrastructure networks, i.e. network-specific standards and protocols are strictly followed within the co-located super sites. This is a cost-effective approach. This way, we can gain the needed information to reduce uncertainties in climate change predictions, to improve urban air quality, to mitigate and adapt climate change effectively and in general, to provide the needed data for solving the SDGs. The SMEAR concept, described in detail in this paper, is such an approach and already well tested in various environments, well documented and well-coordinated.
SMEAR stations co-locate measurements of the European research infrastructures ICOS, ACTRIS, eLTER and AnaEE together with global infrastructures GEO-GEOSS and WMO-GAW. Importantly, the co-location of the ground-based systems should be improved and, importantly, when new stations are established in remote or urban regions they should be integrated, standardized measurements of earth surface and atmosphere including well defined metrology (e.g. Kulmala, Citation2018). Thus, the future tasks should aim on the identification of the optimal in situ stations network contribution to global data sets in collaboration with the remote sensing satellite data products. In situ data are needed also for the satellite products validation in the regions where we have the most serious data gaps. Combining the socio-economic data to environment data would bring the analysis to the next level of relevance to the society and the systematic global Earth Observations would be the necessary tool for the verification of the climate policy actions as such and also to meet the Paris agreement.
As a practical step towards implementation of the global Earth observatory, we propose a global network of the SMEAR type stations. This GlobalSMEAR initiative (Lappalainen et al., Citation2016; Lappalainen, Kulmala, Zilitinkevich, Kulmala, & Zilitinkevich, Citation2015; Lappalainen et al., Citation2014) provides an asset to upgrade and expand the existing station networks towards a global network (Hari & Kulmala, Citation2005; Hari et al., Citation2016; Kulmala, Citation2018). The vision of the GlobalSMEAR network is to provide continuous and comprehensive information of atmosphere, various ecosystems and their interactions from local to global scales and together with integrating data analysis will provide answers to environmental Grand Challenges. Furthermore, the GlobalSMEAR network would provide new business opportunities for a private sector such as forecasting and early warning services and development and benchmarking of novel environmental instrument technology. The stations could be constructed in new locations or by upgrading already existing infrastructure. The envisioned GlobalSMEAR stations would be operated by local stakeholders and their investments would enhance the local research infrastructure and capacities.
A station network of 1000 well-equipped ground stations around the world (see Kulmala, Citation2018), along with the produced open big data combined with relevant socio-economic data, would enable to track the changes in environmental conditions and societies globally, continuously providing observational evidence to understand the factors affecting the grand challenges, and fulfilling of the requirements of the UN SDGs. The SMEAR stations and the globalSMEAR station network will provide environmental big data to answer present research questions and will provide tools to identify new arising questions and challenges in the future both from scientific and socio-economic points of view. The big, comprehensive data will contribute to achieve UN SDGs. Particularly the contributions to understanding climate change, sustainable water and food supplies as well as improving human health and well-being are crucial and also to achieve these without the big data is difficult or even impossible. Overall, the logic behind the chain of actions goes in the following way: first, we collect big data, which gives us the scientific insights into sustainability. Supported by the integrative analysis of the comprehensive data, we are able to define the critical obstacles and enable the decision makers to base their decisions on scientific data. In this manner, we are able to achieve the UN SDGs.
Acknowledgements
We acknowledge the following projects: ACCC Flagship funded by the Academy of Finland grant number 337549, Russian Mega Grant project “Megapolis - heat and pollution island: interdisciplinary hydroclimatic, geochemical and ecological analysis” application reference 2020-220-08-5835, “Quantifying carbon sink, CarbonSink+ and their interaction with air quality” INAR project funded by Jane and Aatos Erkko Foundation, European Research Council (ERC) project ATM-GTP Contract No. 742206 and the Arena for the gap analysis of the existing Arctic Science Co-Operations (AASCO) funded by Prince Albert Foundation Contract No. 2859. We thank the technical and scientific staff in Värriö and Hyytiälä stations. We also would like to thank Dr. Nuria Altimir, University of Helsinki, for the design of the SMEAR station schematic visuals.
Disclosure statement
No potential conflict of interest was reported by the author(s).
Data availability statement
The data that support the findings of this study are openly available at https://smear.avaa.csc.fi/or from the corresponding author ([email protected]) upon reasonable request.
Additional information
Notes on contributors
Markku Kulmala
Academician, Prof. Markku Kulmala leads the Institute for Atmospheric and Earth System Research (INAR), University of Helsinki. He is active in international initiatives to improve comprehensive continuous measurement networks all around the world, and to solve air quality–climate change interactions. Kulmala’s research consists of SMEAR field stations and GlobalSMEAR network. Kulmala has published over 1100 original research papers, 18 of which in Nature, 17 in Science and 7 in Physical Review Letters. According to the ISI Web of Knowledge, Kulmala has been 1st in the Citation Rankings in Geosciences (1.5.2011–30.4.2018). The total number of citations is over 60500 (from over 20000 different papers). His H-factor is 120. Prof. Kulmala is the Foreign Member of Chinese Academy of Sciences, and Russian Academy of Sciences. He is a member of 5 other Academies. He acts as a president of European Center of International Eurasian Academy of Sciences. He is winner of many international awards (>10) and has nine honored doctoral degrees / professorships.
Anna Lintunen
Dr. Anna Lintunen (Research coordinator, Adjunct professor, University of Helsinki) is a tree ecophysiologist with expertise in the responses of tree structure and function to drought and freezing stress. Her strength is the expertise in various physiological methods and approaches to study tree ecophysiology at the interface of biology and physics; also woody plants apply the laws of physics, which is essential especially in studying transport processes (diffusion of water, CO2 and oxygen and xylem and phloem transport) and phase transitions (freezing and cavitation). She is among the few scientists in the world that have specialized in studying apoplastic freezing processes in woody plants. She has supervised two graduated PhD students, and currently she has five PhD-students under her supervision. She coordinates research in the Atmosphere and Climate Competence Center (ACCC) flagship (led by Academician Markku Kulmala), the Center of Excellence in Atmospheric Science (2014-2019), and is a member in the Executive Committee of the Institute for Atmospheric and Earth System Research (INAR) at the University of Helsinki. She obtained her PhD from the University of Helsinki in 2013. Her H-index is 12, and she has published 33 peer-reviewed papers with 496 citations. ORCID: 0000-0002-1077-0784
Ilona Ylivinkka
Ilona Ylivinkka (M.Sc. in meteorology, 2019) is a doctoral student in atmospheric sciences at INAR of the University of Helsinki, working currently at SMEAR II research station. She is interested in processes connecting the atmosphere and boreal forest ecosystem, including feedbacks involving aerosols, clouds and radiation. She is studying aerosol precursor gases, impacts of biotic plant stresses on aerosol dynamics, and the role of different cloud types on various boundary layer processes such as aerosol dynamics, radiation, and photosynthesis. Her H index is 3, and she has published 6 peer-reviewed papers with 47 citations. ORCID: 0000-0002-5591-4876
Janne Mukkala
Janne Mukkala Doctral student (M.Sc., geography) joined Institute for Atmospheric and Earth System Research (INAR) in February 2021. He works in Värriö research station. His main research interests are science diplomacy and universities third mission. He worked as a project worker in VÄRI-project for the local federation of Eastern Lapland.
Rosa Rantanen
Rosa Rantanen (D.Soc.Sc.) currently works at the Institute for Atmospheric and Earth System Research (INAR) at the University of Helsinki as a Research Coordinator in the Atmosphere and Climate Competence Center (ACCC) flagship and in the CO-CARBON project funded by the Strategic Research Council of the Academy of Finland. Rantanen obtained her PhD in practical philosophy from the University of Turku in 2019. She has published five peer-reviewed articles and won the European Association of Centres of Medical Ethics’ (EACME) abstract award (2012). Alongside her academic work, she has worked as a coordinator in the Finnish Red Cross, written reports for Finnish NGOs and served as a human rights observer. In 2020, she coordinated the preparation of the statement “Bending, but not breaking” published by the Finnish Academy of Science and Letters. Previously she has been involved in many interdisciplinary projects and bodies such as the UNESCO Chair in Bioethics Finnish Unit, the Finnish Death Studies Association and Center for the Study of Bioethics (Belgrade, Serbia).
Joni Kujansuu
Dr. Joni Kujansuu (University of Helsinki, Finland) has worked and studied over 14 years in Asia. His academic expertise is focused on air pollution-weather/climate interactions. He has done his M.Sc. studies in Beijing Forestry University on 1997-2002 and his PhD in Shinshu University, Japan. After working as an industry consultant for 4 years in Japan, he is now living in Finland and coordinating academic collaboration and commercializing academic innovations between Finland and China. He is the CEO of Smear Ltd that provide consultation services in atmospheric monitoring. Smear Ltd is University of Helsinki owned company that is based on SMEAR station concept developed by Academician, Prof. Markku Kulmala. Dr. Kujansuu has proficiency in written and spoken Mandarin Chinese and Japanese.
Tuukka Petäjä
Prof. Tuukka Petäjä has over 20 years of research experience related to atmospheric sciences. He is the vice-director of Institute for Atmospheric and Earth System Research responsible for the aerosol domain and research infrastructures. His research interests span from 1) Aerosol-cloud interactions, 2) Development of mass spectrometric methods for atmospheric aerosols and trace gases; 3) Measurement techniques, aerosol particles; 4) Long-term and field campaigns; 5) Aerosol-cloud-climate-biosphere interactions. He has educated 29 PhDs to completion. He has published over 430 peer reviewed articles (10 in Science, 9 in Nature), total citations 21700, h-factor of 69. He is a highly cited scientist (2014-, Thompson Reuters) and has received FAAR Award in excellent aerosol science and Vaisala Award 2013 for his work on combining state-of-the-art science and instrument development; Receiver of Science and Technology in Society Future Leader Award, New York Academy of Sciences, PI of Biogenic Aerosols – Effects on Clouds and Climate (BAECC), multiplatform research campaign to elucidate the role of secondary aerosols to clouds, supported by US Department of Energy; Science director of Pan Eurasian Experiment (PEEX), board member of PACES initiative, academician in International Eurasian Academy of Sciences (IEAS).

Hanna K. Lappalainen
Dr. Hanna K. Lappalainen, Docent, Pan-Eurasian Experiment (PEEX) Program Secretary General at the University of Helsinki, Institute for Atmospheric and Earth System Research (INAR) (FI) and the coordinator of the of the Atmosphere and Climate Competence Center (ACCC) Impact Program. She is the lead editor of the PEEX Science Plan and has a long-term experience of coordinating large-scale research projects. She has received NASA Goddar Team Award EOS-AURA satellite OMI-Team in 2005 and an International Eurasian Academy of Sciences, IEAS, Silver medal in 2015. Lappalainen is a representative of Finland in the Sustainable SAON Data working group, a national delegate of ISAC – The International Science Initiative in the Russian Arctic (ISIRA), Co-chair of the of the Arctic – GEOSS – High Mountain – Gold Regions HiMAC (2020), Academy Member of IEAS (nomination date 02 Dec, 2016), Co-Leader together with Academician M. Kulmala of the Universities of Arctic network “Arctic-boreal Hub” and a SIOS Editorial Board and the member of SIOS Data WG. She obtained her PhD from the University of Helsinki, Finland and has been engaged in analysis of the atmospheric biogenic volatile organic compounds and plant phenology. Her H-index is 15 (ISI Web of Science May 2021), and she has published 32 papers with 1002 citations. ORCID ID 0000-0003-3221-2318
References
- Aalto, J., Porcar‐Castell, A., Atherton, J., Kolari, P., Pohja, T., Hari, P., … Bäck, J. (2015). Onset of photosynthesis in spring speeds up monoterpene synthesis and leads to emission bursts, Plant, Cell & Environment, 38(11), 2299–2312.
- ACTRIS (2020) ACTRIS activities connected to the COVID-19 and lockdown in Europe. https://www.actris.eu/news-events/news/actris-activities-connected-covid-19-and-lockdown-europe-0, (accessed 24 March 2021).
- Alekseychik, P., Lappalainen, H. K., Petäjä, T., Zaitseva, N., Heimann, M., Laurila, T., … Kulmala, M. (2016). Ground-based station network in Arctic and Subarctic Eurasia: An overview. Geography Environment Sustainability, 9(2), 75–88.
- Arneth, A., Harrison, S. P., Bartlein, P. J., Bartlein, P. J., Bartlein, P. J., Feichter, H., … Zaehle, S. (2010). Terrestrial biogeochemical feedbacks in the climate system: From past to future. Nature Geoscience, 3(8), 525–532.
- Asmi, A., Collaud Coen, M., Ogren, J. A., Andrews, E., Sheridan, P., Jefferson, A., … Laj, P. (2013). Aerosol decadal trends – Part 2: In-situ aerosol particle number concentrations at GAW and ACTRIS stations. Atmospheric Chemistry and Physics, 13, 895–916.
- Baklanov, A., Molina, L. T., & Gauss, M. (2015). Megacities, air quality and climate. Atmospheric Environment, 126, 235–249.
- Baklanov, A., Smith Korsholm, U., Nuterman, R., Mahura, A., Nielsen, K. P., Sass, B. H., González-Aparicio, I. (2017). Enviro-HIRLAM online integrated meteorology–chemistry modelling system: Strategy, methodology, developments and applications (v7.2). Geoscientific Model Development, 10(8), 2971–2999.
- Boy, M., Petäjä, T., Dal Maso, M., Rannik, Ü., Rinne, J., Aalto, P., Kulmala, M. (2004). A of the field measurement campaign in Hyytiälä, August 2001 in the frame of the EU project OSOA. Atmospheric Chemistry and Physics, 4(3), 657–678.
- Cai, J., Chu, B., Yao, L., Yan, C., Heikkinen, L. M., Zheng, F., Daellenbach, K. R. (2020). Size-segregated particle number and mass concentrations from different emission sources in urban Beijing. Atmospheric Chemistry and Physics, 20, 12721–12740.
- Chen, T., Liu, J., Ma, Q., Chu, B., Zhang, P., Ma, J., He, H. (2021). Measurement report: Effects of photochemical aging on the formation and evolution of summertime secondary aerosol in Beijing. Atmospheric Chemistry and Physics, 21(2), 1341–1356.
- Chubarova, N. E., Androsova, E. E., Kirsanov, A. A., Vogel, B., Vogel, H., Popovicheva, O. B., & Rivin, G. S. (2019). Aerosol and Its Radiative Effects during the Aeroradcity 2018 Moscow Experiment. Geography, Environment, Sustainability, 12(4), 114–131.
- Commission, E. (2019). COM(2019)640 final, The European Green Deal, Brussels, https://eur-lex.europa.eu/legal-content/EN/ALL/?uri=celex:52019DC0640, (accessed 22 March 2021).
- Concilio, G., Molinari, F., & Morelli, N. (2017). Empowering Citizens with Open Data by Urban Hackathons, Conference: 2017 Conference for E-Democracy and Open Government (CeDEM), Danube University Krems, Austria. doi.https://doi.org/10.1109/CeDEM.2017.2
- Crippa, M., Canonaco, F., Lanz, V. A., Äijälä, M., Allan, J. D., Carbone, S., … Prévôt, A. S. H. (2014). Organic aerosol components derived from 25 AMS data sets across Europe using a consistent ME-2 based source apportionment approach. Atmospheric Chemistry and Physics, 14(12), 6159–6176.
- Crowley, J. N., Pouvesle, N., Phillips, G. J., Axinte, R., Fischer, H., Petäjä, T., … Lelieveld, J. (2018). Insights into HOX and ROX chemistry in the boreal forest via measurement of peroxyacetic acid, peroxyacetic nitric anhydride (PAN) and hydrogen peroxide. Atmospheric Chemistry and Physics, 18, 13457–13479.
- Ding, A., Huang, X., Nie, W., Sun, J., Kerminen, V.-M., Petaja, T., Fu, C. (2016a). Enhanced haze pollution by black carbon in megacities in China, Geophys. Geophysical Research Letters, 43(6), 2873–2879.
- Ding, A., Nie, W., Huang, X., Chi, X., Sun, J., Kerminen, V.-M., Fu, C. (2016b). Long-term observation of air pollution-weather/climate interactions at the SORPES station: A review and outlook. Frontiers of Environmental Science & Engineering, 10(5), 15.
- Ding, A. J., Fu, C. B., Yang, X. Q., Sun, J. N., Zheng, L. F., Xie, Y. N., Kulmala, M. (2013). Ozone and fine particle in the western YangtzeRiver Delta: An overview of 1 yr data at the SORPES station. Atmospheric Chemistry and Physics, 13(2013), 5813–5830.
- Dinoi, A., Gulli, D., Ammoscato, I., Calidonna, C. R., & Contini, D. (2021). Impact of the Coronavirus Pandemic Lockdown on Atmospheric Nanoparticle Concentrations in Two Sites of Southern Italy. Atmosphere, 12(3), 352.
- Doherty, R. M., Heal, M. R., & O’Connor, F. M. (2017). Climate change impacts on human health over Europe through its effect on air quality. Environmental Health, 16(1), 33–44.
- E/HLS(2016)1, Ministerial declaration of the 2016 high-level political forum on sustainable development, convened under the auspices of the Economic and Social Council, on the theme “Ensuring that no one is left behind” https://documents-dds-ny.un.org/doc/UNDOC/GEN/N16/241/66/PDF/N1624166.pdf?OpenElement, ( accessed 22 March 2021).
- Ehn, M., Thornton, J. A., Kleist, E., Sipilä, M., Junninen, H., Pullinen, I., Mentel, T. F. (2014). A Large Source of Low-volatility Secondary Organic Aerosol. Nature, 506(7489), 476–479.
- Espey, J. (2019). Sustainable development will falter without data. Nature, 571(7765), 299.
- European Commission (2020). COM(2020)21 final, European Green Deal Investment Plan, Brussels, https://www.eumonitor.eu/9353000/1/j9vvik7m1c3gyxp/vl5bgbajymzx, (accessed 22 March 2021).
- Ezhova, E., Ylivinkka, I., Kuusk, J., Komsaare, K., Vana, M., Krasnova, A., Kulmala, M. (2018). Direct effect of aerosols on solar radiation and gross primary production in boreal and hemiboreal forests. Atmospheric Chemistry and Physics, 18, 17863–17881.
- Fernández-Martínez, M., Vicca, S., Janssens, I. A., Ciais, P., Obersteiner, M., Bartrons, M., Peñuelas, J. (2017). Atmospheric deposition, CO2, and change in the land carbon sink. Scientific Reports, 7(1), 9632.
- Ford, J. D., Tilleard, S. E., Berrang-Ford, L., Araos, M., Biesbroek, R., Lesnikowski, A. C., Bizikova, L. (2016). Opinion: Big data has big potential for applications to climate change adaptation. Proceedings of the National Academy of Sciences, 113, 10729–10732.
- Fountoukis, C., Megaritis, A. G., Skyllakou, K., Charalampidis, P. E., Pilinis, C., Denier van der Gon, H. A. C., Pandis, S. N. (2014). Organic aerosol concentration and composition over Europe: Insights from comparison of regional model predictions with aerosol mass spectrometer factor analysis. Atmospheric Chemistry and Physics, 14(17), 9061–9076.
- Guo, H. (2018). Steps to the digital Silk Road. Nature, 554(7690), 25–27.
- Guo, H. (2020). Big Earth data facilitates sustainable development goals. Big Earth Data, 4(1), 1–2.
- Hackmann, H., Moser, S. C., & St, A. L.; Clair. (2014). The social heart of global environmental change. Nature Climate Change, 4(8), 653–655.
- Hari, P., Andreae, M. O., Kabat, P., & Kulmala, M. (2009). A comprehensive network of measuring stations to monitor climate change, Boreal Environment Research, 14, 442–446.
- Hari, P., & Kulmala, M. (2005). Station for Measuring Ecosystem–Atmosphere Relations (SMEAR II), Boreal Environment Research, 10, 315–322.
- Hari, P., Luoma, S., Hämeri, K., Luoma, S., Luoma, S., Aalto, P., Pulliainen, E. (1994). Air pollution in eastern Lapland: Challenge for an environmental measurement station. Silva Fennica, 28(1), 29–39.
- Hari, P., Petäjä, T., Bäck, J., Kerminen, V.-M., Lappalainen, H. K., Vihma, T., Kulmala, M. (2016). Conceptual design of a measurement network of the global change. Atmospheric Chemistry and Physics, 16, 10171028.
- Helbig, M., Waddington, J. M., Alekseychik, P., Amiro, B. D., Aurela, M., Barr, A. G., Zyrianov, V. (2020). Increasing contribution of peatlands to boreal evapotranspiration in a warming climate. Nature Climate Change, 10c(6), 555–560.
- Huang, X., Zhou, L., Ding, A., Qi, X., Nie, W., Wang, M., Boy, M. (2016). Comprehensive modelling study on observed new particle formation at the SORPES station in Nanjing, China. Atmospheric Chemistry and Physics, 16(4), 2477–2492.
- Junninen, H., Lauri, A., Keronen, P., Aalto, P., Hiltunen, V., Hari, P., & Kulmala, M. (2009). Smart-SMEAR: On-line data exploration and visualization tool for SMEAR stations. Boreal Environment Research, 14, 447–457.
- Karttunen, S., Kurppa, M., Auvinen, M., Hellsten, A., & Järvi, L. (2020). Large-eddy simulation of the optimal street-tree layout for pedestrian-level aerosol particle concentrations–A case study from a city-boulevard. Atmospheric Environment: X, 6. doi:https://doi.org/10.1016/j.aeaoa.2020.100073
- Knox, S. H., Jackson, R. B., Poulter, B., Wohlfahrt G., McNicol G., Fluet-Chouinard E., Zona D. (2019) FLUXNET-CH4 synthesis activity: Objectives, observations, and future directions. Bulletin of the American Meteorological Society, 100, 2607–2632.
- Kontkanen, J., Lehtipalo, K., Ahonen, L., Kangasluoma, J., Manninen, H. E., Hakala, J., Kulmala, M. (2017). Measurements of sub-3 nm particles using a particle size magnifier in different environments: From clean mountain top to polluted megacities. Atmospheric Chemistry and Physics, 17, 2163–2187.
- Korrensalo, A., Männistö, E., Alekseychik, P., Mammarella, I., Rinne, J., Vesala, T., & Tuittila, E.-S. (2018). Small spatial variability in methane emission measured from a wet patterned boreal bog. Biogeosciences, 15(6), 1749–1761.
- Kriegler, E., Luder, G., Bauer, N., Baumstark, L., Fujimori, S., Popp, A., & van Vuuren, D. P. (2018). Pathways limiting warming to 1.5°C. A Tale of Turning around in No Time? Philosophical Transactions of the Royal Society A: Mathematical, Physical & Engineering Sciences, 376(2119), 2119.
- Kulmala, M. (2015). China’s Chocking Air Coctail. Nature, 526(7574), 497–499.
- Kulmala, M. (2018). Build a global Earth observatory. Nature, 553(7686), 21–23.
- Kulmala, M., Dada, L., Dällenbach, K., Yan, C., Stolzenburg, D., Kontkanen, J., Kerminen, V.-M. (2021). Is reducing new particle formation a plausible solution to mitigate particulate air pollution in Beijing and other Chinese megacities? Faraday Discussions, 226, 334–347.
- Kulmala, M., Dal Maso, M., Mäkelä, J. M., Pirjola, L., Väkevä, M., Aalto, P., O’Dowd, C. D. (2001). On the formation, growth and composition of nucleation mode particles. Tellus, 53B(4), 479–490.
- Kulmala, M., Ezhova, E., Kalliokoski, T., Noe, S., Vesala, T., Lohila, A., Kerminen, V.-M. (2020). CarbonSink+Accounting for Multiple Climate Feedbacks from Forests. Boreal Environment Research, 25, 145–159.
- Kulmala, M., Hari, P., Laaksonen, A., Vesala, T., & Viisanen, Y. (2005). Research Unit of Physics, Chemistry and Biology of Atmospheric Composition and Climate Change: Overview of recent results. Boreal Environment Research, 10, 459–477.
- Kulmala, M., Kokkonen, T. V., Pekkanen, J., Paatero, S., Petäjä, T., Kerminen, V.-M., & Ding, A. (2021b). Opinion: Gigacity – A source of problems or the new way to sustainable development. Atmospheric Chemistry and Physics, 21(10), 8313–8322. https://doi.org/https://doi.org/10.5194/acp-21-8313-2021
- Kulmala, M., Kontkanen, J., Junninen, H., Lehtipalo, K., Manninen, H. E., Nieminen, T., … Worsnop, D. R. (2013). Direct Observations of Atmospheric Aerosol Nucleation. Science, 339(6122), 943–946.
- Kulmala, M., Lappalainen, H. K., Petäjä, T., Kurten, T., Kerminen, V.-M., Viisanen, Y., Zilitinkevich, S. (2015). Introduction: The Pan-Eurasian Experiment (PEEX) – Multidisciplinary, multiscale and multicomponent research and capacity-building initiative. Atmospheric Chemistry and Physics, 15, 13085–13096.
- Kulmala, M., Nieminen, T., Nikandrova, A., Lehtipalo, K., Manninen, H. E., Kajos, M. K., … Kerminen, V.-M. (2014) CO2-induced terrestrial climate feedback mechanism: From carbon sink to aerosol source and back. Boreal Environment Research, 19, 122–131.
- Kulmala, M., Petäjä, T., Nieminen, T., Sipila, M., Manninen, H. E., Lehtipalo, K., Kerminen, V.-M. (2012). Measurement of the nucleation of atmospheric aerosol particles. Nature Protocols, 7(9), 1651–1667.
- Kulmala, M., Suni, T., Lehtinen, K. E. J., Dal Maso, M., Boy, M., Reissell, A., Hari, P. (2004). A new feedback mechanism linking forests, aerosols, and climate. Atmospheric Chemistry and Physics, 4(2), 557–562.
- Kyrö, E.-M., Väänänen, R., Kerminen, V.-M., Virkkula, A., Petäjä, T., Asmi, A., Kulmala, M. (2014). Trends in new particle formation in Eastern Lapland, Finland: Effect of decreasing sulfur emissions from Kola Peninsula. Atmospheric Chemistry and Physics, 14, 4383–4396.
- Laj, P., Bigi, A., Rose, C., Andrews, E., Lund Myhre, C., Collaud Coen, M., Zikova, N. (2020). A global analysis of climate-relevant aerosol properties retrieved from the network of Global Atmosphere Watch (GAW) near-surface observatories. Atmospheric Measurement Techniques, 13(8), 4353–4392.
- Lang, D. L., Wiek, A., Bergmann, M., Stauffacher, M., Marten, P., Moll, P., Thomas, S. J. (2012). Transdisciplinary research in sustainability science: Practice, principles, and challenges. Sustainability Science, 7(Supplement 1), 25–43.
- Lappalainen, H. K., Kerminen, V.-M., Petäjä, T., Kurten, T., Baklanov, A., Shvidenko, A., Kulmala, M. (2016). Pan-Eurasian Experiment (PEEX): Towards a holistic understanding of the feedbacks and interactions in the land–atmosphere–ocean–society continuum in the northern Eurasian region. Atmospheric Chemistry and Physics, 16, 14421–14461.
- Lappalainen, H. K., Kulmala, M., Kujansuu, J., Petäjä, T., Mahura, A., de Leeuw, G., Guo, H. (2018). The Silk Road agenda of the Pan-Eurasian Experiment (PEEX) program. Big Earth Data, 2(1), 8–35.
- Lappalainen, H. K., Kulmala, M., Zilitinkevich, Z., Kulmala, M., & Zilitinkevich, S. Copyright © 2015 WEB: www.atm.helsinki.fi/peex, ISBN 978-951-51-0587-5 (printed), ISBN 978-951-51-0588-2 (online)
- Lappalainen, H. K., Petäjä, T. T., Kujansuu, J. T., Kerminen, V.-M., Shvidenko, A., Bäck, J. K., Kulmala, M. T. (2014). Pan Eurasian Experiment (PEEX) - a Research Initiative Meeting the Grand Challenges of the Changing Environment of the Northern Pan-Eurasian Arctic-Boreal Areas. Geography, Environment and Sustainability, 7(2), 13–48.
- Lauri, K., Ruuskanen, T., Riuttanen, L., Kulmala, M., & Hari, P. (2020) Research-oriented intensive courses foster multidisciplinary atmospheric science, Global Campus Innovations, Volume I – New Pedagogical Approaches, WMO publications.
- Law, R. M., Ziehn, T., Matear, R. J., Lenton, A., Chamberlain, M. A., Stevens, L. E., Vohralik, P. F. (2017). The carbon cycle in the Australian Community Climate and Earth System Simulator (ACCESS-ESM1) – Part 1: Model description and pre-industrial simulation. Geoscientific Model Development, 10(7), 2567–2590.
- Lelieveld, J., Pozzer, A., Pöschl, U., Fnais, M., Haines, A., & Münzel, T. (2020). Loss of life expectancy from air pollution compared to other risk factors: A worldwide perspective. Cardiovascular Research, 116(11), 1910–1917.
- Lintunen, A., Paljakka, T., Salmon, Y., Dewar, R., Riikonen, A., & Hölttä, T. (2020). The influence of soil temperature and water content on belowground hydraulic conductance and leaf gas exchange in mature trees of three boreal species. Plant, Cell & Environment, 43(3), 532–547.
- Liu, Y., Yan, C., C., Feng, Z., Zheng, F., Fan, X., Zhang, Y., Bianchi, F. (2020). Continuous and Comprehensive Atmospheric Observations in Beijing: A Station to Understand the Complex Urban Atmospheric Environment. Big Earth Data, 4(3), 295–321.
- Murray, V., Maini, R., Clarke, L., & Eltinay, N. (2017) Coherence between the Sendai Framework, the SDGs, the Climate Agreement, New Urban Agenda and World Humanitarian Summit, and the role of science in their implementation. https://www.preventionweb.net/publications/view/53049, (accessed 22 March 2021).
- United Nations (2015) Transforming our world: The 2030 Agenda for Sustainable Development. Division for Sustainable Development Goals, New York, NY, USA. https://sustainabledevelopment.un.org/post2015/transformingourworld/publication, (accessed 22 March 2021).
- Nieminen, T., Yli-Juuti, T., Manninen, H. E., Petäjä, T., Kerminen, V.-M., & Kulmala, M. (2015). Technical note: New particle formation event forecasts during PEGASOS–Zeppelin Northern mission 2013 in Hyytiälä, Finland. Atmospheric Chemistry and Physics, 15, 12385–12396.
- Papale, D., Antoniella, G., Nicolini, G., Gioli, B., Zaldei, A., Vogt, R., Masson, V. (2020) Clear evidence of reduction in urban CO2emissions as a result of COVID-19 lockdown across Europe, ICOS Report. https://www.icos-cp.eu/event/933
- Petäjä, T., Ganzei, K. S., Lappalainen, H. K., Tabakova, K., Makkonen, R., Räisänen, J., Kondrat’ev, I. I. (2021). Research agenda for the Russian Far East and utilization of multi-platform comprehensive environmental observations. International Journal of Digital Earth, 14(3), 311–337.
- Petäjä, T., O’Connor, E., Moisseev, D., Sinclair, V., Manninen, A., Väänänen, R., … Hickmon, N. (2016) BAECC: A Field Campaign to Elucidate the Impact of Biogenic Aerosols on Clouds and Climate. Bulletin of the American Meteorological Society, 97, 1909–1928.
- Prime Minister’s Office Finland (2020) Voluntary National Review 2020 Finland – Report on the Implementation of the 2030 Agenda for Sustainable development. Helsinki, Finland. https://julkaisut.valtioneuvosto.fi/handle/10024/162268, (accessed 22 March 2021).
- Qi, X. M., Ding, A. J., Roldin, P., Xu, Z. N., Zhou, P. T., Sarnela, N., … Boy, M. (2018). Modelling studies of HOM and its contributions to growth of new particles: Comparison of boreal forest in Finland and polluted environment in China. Atmospheric Chemistry and Physics, 18, 11779–11791.
- Raivonen, M., Smolander, S., Backman, L., Susiluoto, J., Aalto, T., Markkanen, T., … Vesala, T. (2017). HIMMELI v1.0: HelsinkI Model of MEthane buiLd-up and emIssion for peatlands. Geoscientific Model Development, 10(12), 4665–4691.
- Rantala, P., Järvi, L., Taipale, R., Laurila, T. K., Patokoski, J., Kajos, M. K., Rinne, J. (2016). Anthropogenic and biogenic influence on VOC fluxes at an urban background site in Helsinki, Finland. Atmospheric Chemistry and Physics, 16, 7981–8007.
- Rinne, J., Tuittila, E. ‐. S., Peltola, O., Li, X., Raivonen, M., Alekseychik, P., Vesala, T. (2018). Temporal variation of ecosystem scale methane emission from a boreal fen in relation to temperature, water table position, and carbon dioxide fluxes. Global Biogeochemical Cycles, 32, 1087–1106.
- Rosenfeld, D., Andreae, M. O., Asmi, A., Chin, M., de Leeuw, G., Donovan, D. P., Quaas, J. (2014). Global observations of aerosol-cloud-precipitation-climate interactions. Reviews of Geophysics, 52, 750–808.
- Scharlemann, J. P. W., Brock, R. C., Balfour, N., Brown, C., Burgess, N. D., Guth, M. K., Kapos, V. (2020). Towards understanding interactions between Sustainable Development Goals: The role of environment–human linkages. Sustainability Science, 15(6), 1573–1584.
- Scharlemann, J. P. W., Tanner, E. V. J., Hiederer, R., & Kapos, V. (2014). Global soil carbon: Understanding and managing the largest terrestrial carbon pool. Carbon Management, 5(1), 81–91.
- Solomeshch, A., The West Siberian Lowland (2005) In L. Fraser & P. Keddy (Eds.), The World’s Largest Wetlands: Ecology and Conservation, 11-62. Cambridge: Cambridge University Press. doi:https://doi.org/10.1017/CBO9780511542091.003
- Syväsalo, E., Regina, K., Pihlatie, M., & Esala, M. (2004). Emissions of nitrous oxide from boreal agricultural clay and loamy sand soils. Nutrient Cycling in Agroecosystems, 69(2), 155–165.
- UN Habitat (2019). UN Habitat Strategic Plan 2020-2023, 7, 2019. https://unhabitat.org/sites/default/files/documents/2019-09/strategic_plan_2020-2023.pdf
- UNEP (2016) The Adaptation Finance Gap Report 2016. Author, Nairobi, Kenya.
- United Nations (2019) Independent Group of Scientists appointed by the Secretary-General, Global Sustainable Development Report 2019: The Future is Now – Science for Achieving Sustainable Development, Author, New York.
- Vihma, T., Uotila, P., Sandven, S., Pozdnyakov, D., Makshtas, A., Pelyasov, A., Kulmala, M. (2019). Towards an advanced observation system for the marine Arctic in the framework of the Pan-Eurasian Experiment (PEEX). Atmospheric Chemistry and Physics, 19, 1941–1970.
- Wang, Y., Yu, M., Wang, Y., Tang, G., Song, T., Zhou, P., Petäjä, T. (2020). Rapid formation of intense haze episodes via aerosol–boundary layer feedback in Beijing. Atmospheric Chemistry and Physics, 20, 45–53.
- Williams, J., Crowley, J., Fischer, H., Harder, H., Martinez, M., Petäjä, T., … Lelieveld, J. (2011). The summertime Boreal forest field measurement intensive (HUMPPA-COPEC-2010): An overview of meteorological and chemical influences. Atmospheric Chemistry and Physics, 11(20), 10599–10618.
- Yan, C., Yin, R., Lu, Y., Dada, L., Yang, D., Fu, Y., … Bianchi, F. (2021). The synergistic role of sulfuric acid, bases, and oxidized organics governing new-particle formation in Beijing. Geophysical Research Letters, 48, e2020GL091944. doi:https://doi.org/10.1029/2020GL091944
- Yao, L., Garmash, O., Bianchi, F., Zheng, J., Yan, C., Kontkanen, J., … Wang, L. (2018). Atmospheric new particle formation from sulfuric acid and amines in a Chinese megacity. Science, 361(6399), 278–281.
- Zenkovich V.P., Arctic USSR. (1985). In: Bird ECF, Schwartz ML (eds) The World’s Coastline. In Van Nostrand Reinhold, Stroudsburg, PA. 863–872.
- Zhou Y., L. Dada, Y. Liu, B. Chu, K.R. Daellenbach, F. Bianchi, M. Kulmala. (2020). Variation of size-segregated particle number concentrations in wintertime Beijing. Atmospheric Chemistry and Physics, 20, 1201–1216. doi:https://doi.org/10.5194/acp-20-1201-2020.