
ABSTRACT
China’s urbanization has attracted a lot of attention due to its unprecedented pace and intensity in terms of land, population, and economic impact. However, due to the lack of consistent and harmonized data, little is known about the patterns and dynamics of the interaction between these different aspects over the past few decades. Along with the implementation of the 2030 Agenda for Sustainable Development, a standardized dataset for assessing the sustainability of urbanization in China is needed. In this paper, we used remote sensing data from multiple sources (time-series of Landsat and Sentinel images) to map the impervious surface area (ISA) at five-year intervals from 1990 to 2015 and then converted the results into a standardized dataset of the built-up area for 433 Chinese cities with 300,000 inhabitants or more. This dataset was produced following the well-established rules adopted by the United Nations (UN). Validation of the ISA maps in urban areas based on the visual interpretation of Google Earth images showed that the average overall accuracy (OA), producer’s accuracy (PA) and user’s accuracy (UA) were 91.24%, 92.58% and 89.65%, respectively. Comparisons with other existing urban built-up area datasets derived from the National Bureau of Statistics of China, the World Bank and UN-habitat indicated that our dataset, namely the standardized urban built-up area dataset for China (SUBAD–China), provides an improved description of the spatiotemporal characteristics of the urbanization process and is especially applicable to a combined analysis of the spatial and socio-economic domains in urban areas. Potential applications of this dataset include combining the spatial expansion and demographic information provided by UN to calculate sustainable development indicators such as SDG 11.3.1. The dataset could also be used in other multidimensional syntheses related to the study of urbanization in China. The published dataset is available at http://www.doi.org/10.11922/sciencedb.j00076.00004.
1. Introduction
Urbanization is a complex socio-economic process that transforms the built environment and shifts the spatial distribution of a population from rural to urban areas. A major consequence is an increase in the land area and population of urban settlements, as well as in the proportion of urban residents compared to rural dwellers (Chen, Zhang, Wu, & Chen, Citation2010). According to the latest statistics from the United Nations (UN) Department of Economic and Social Affairs (DESA), in 2018, 55% of the world’s population (4.2 billion people) lived in urban settlements, compared with 3.4 billion in rural areas. Towards the end of the Agenda for Sustainable Development in 2030, the share of the world’s population living in urban areas is expected to reach 60% (UN DESA, Citation2018). Globally, Africa and Asia are urbanizing faster than other regions of the world. The urbanization level in China first exceeded 60% in 2019, suggesting that the process has now entered its middle and later stages. Excessive urbanization can lead to various urban problems, including air pollution, water shortages, traffic congestion and a worsening security situation, problems which definitely hinder the realization of urban sustainable development goals (UN, Citation2015).
Detailed contemporary datasets that accurately describe urban settlements can support the measurement of the impacts of the expansion of urban areas, the monitoring of environmental changes and the planning of interventions (Zhang et al., Citation2018). However, varying standards currently apply to datasets of urban areas (Zhou & Shi, Citation1995). The basic terminology used for urban planning standards in China defines urban built-up areas as connected areas that have been constructed within urban administrative regions and that have municipal and public facilities (Ministry of Housing and Urban-Rural Development of the People’s Republic of China, Citation1999). The United States Census Bureau considers population density as the main indicator for defining an urban area (Xu & Hua, Citation2005) while planners in Britain use satellite-derived geospatial data and the density of real estate to delineate urban agglomeration areas (Li, Sun, et al., Citation2012). At present, many cities at all levels in China adopt their own methods to identify the boundaries of urban built-up areas rather than follow a unified standard that has been lacking up to now (Li, Sun, et al., Citation2012).
With the development of Earth observation, satellite data from multiple sources that can provide spatially explicit measures for revealing the extent of urbanization and promoting sustainable development are becoming available (Bounoua, Nigro, Zhang, Thome, & Lachir, Citation2018; Gong, Li, & Zhang, Citation2019; Zhao et al., Citation2020). Researchers in this field use different types of remote sensing imagery and in some studies combine two or more types of data (Ma, Li, Tong, & Liu, Citation2019). These data may include, but are not limited to, data acquired by moderate-resolution sensors such as MODIS (Schneider, Friedl, & Potere, Citation2010), the Landsat series (Liu et al., Citation2018) and the Sentinel series (Pesaresi et al., Citation2016; Sun, Xu, Du, Wang, & Lu, Citation2019), data from high-resolution satellites (e.g. IKONOS-1/2, QuickBird-2, ZiYuan-3 (ZY3), SPOT-5/6/7 and WorldView-2/3) (Liu et al., Citation2019; Pesaresi, Ehrlich, Caravaggi, Kauffmann, & Louvrier, Citation2011), and nighttime light (NTL) observations from DMSP/OLS (Zhou, Li, Asrar, Smith, & Imhoff, Citation2018), VIIRS (Liu et al., Citation2019; Sharma, Tateishi, Hara, Gharechelou, & Iizuka, Citation2016), etc. These efforts are made collaboratively at local, national, regional and global scales in relation to thousands of applications (Ettehadi Osgouei, Kaya, Sertel, & Alganci, Citation2019; Gong et al., Citation2020; Li, Zhou, Zhu, & Cao, Citation2020; Schneider et al., Citation2015; Sun et al., Citation2020). Generally speaking, as the impervious surface area (ISA) is one of the most important features of urban land, many researchers across the world map this to generate a surrogate for built-up area maps (Kuang, Citation2020b). For large-area ISA mapping, spectral indices are widely used as they are easy to implement and highly efficient. The most commonly used of these indices include the impervious surface area index, normalized difference built-up index (NDBI), enhanced built-up and bareness index (EBBI) and modified normalized difference impervious surface index (MNDISI) (Carlson & Arthur, Citation2000; As-syakur, Adnyana, Arthana, & Nuarsa, Citation2012; Zha, Gao, & Ni, Citation2003).
Before the advent of freely accessible remotely sensed data, some research exploring the urbanization process in China relied on census data (Chen, Lu, & Zhang, Citation2009; Li, Chen, & Xu, Citation2009; Tan & Lv, Citation2003). However, the diverse methodologies used for measurements – in particular, inconsistencies in definitions – distorted any comprehensive comparison of the spatial and socio-economic aspects of urbanization in most cases (Mertes, Schneider, Sulla-Menashe, Tatem, & Tan, Citation2015; Seto, Fragkias, Güneralp, & Reilly, Citation2011). For example, there are relatively few research results on SDG11.3.1 – i.e. the ratio of the land consumption rate to the population growth rate (LCRPGR) – due to the lack of harmonized ISA and population distribution data in urban areas (UN, Citation2015). The main reason for this is that the preconditions for calculating SDG11.3.1 depend on the production of urban built-up area data and the spatial decomposition of corresponding demographic data (Buettner, Citation2015); however, the concept of built-up area lacks a well-recognized definition and there are still many uncertainties involved in the spatial disaggregation of socio-economic data whose overall accuracy is not high (Gallego, Batista, Rocha, & Mubareka, Citation2011). At present, there are not many international open data sources that can achieve the harmonized association and coupling between built-up area and population distribution in urban areas. Typically, the Global Human Settlement Layer (GHSL) product (Corbane et al., Citation2019) is intensively used in the calculation of this indicator at various scales (Melchiorri, Pesaresi, Florczyk, Corbane, & Kemper, Citation2019; Nicolau, David, Caetano, & Pereira, Citation2019; Schiavina et al., Citation2019).
Notwithstanding the huge challenges that stand in the way of translating Earth observation data into sustainable development indicators, multisource satellite data will continue to play an important role in the service of the 2030 Agenda for Sustainable Development (Anderson, Ryan, Sonntag, Kavvada, & Friedl, Citation2017; Andries et al., Citation2019). Furthermore, the emerging Big Earth Data technologies make it possible to achieve a scientific synthesis by combining Earth observation and census data (Guo, Citation2017; Guo et al., Citation2020). In this study, we used the UN World Urbanization Prospects (WUP) database that provides population counts for cities with 300,000 inhabitants or more as a reference (UN DESA, Citation2018). After generating large-area ISA maps of China’s major urban agglomerations, we converted the ISA results to urban built-up area data for 433 cities at five-year intervals for the period 1990 to 2015. This was done in order to minimize the discrepancy between the expansion of urban areas and population growth in these areas (Güneralp, Reba, Hales, Wentz, & Seto, Citation2020). In this paper, the data sources and methodology used to create large-area ISA maps and to generate built-up area products are described. We also describe how we compared our results with existing built-up area datasets and produced aggregated estimates and an analysis of trends from the perspective of urban agglomeration. Finally, we discuss the implications of these estimates and trends that we identified in terms of the link between land and population urbanization in the context of the assessment of urban sustainability in China.
2. Data sources and methodology
2.1. Data sources
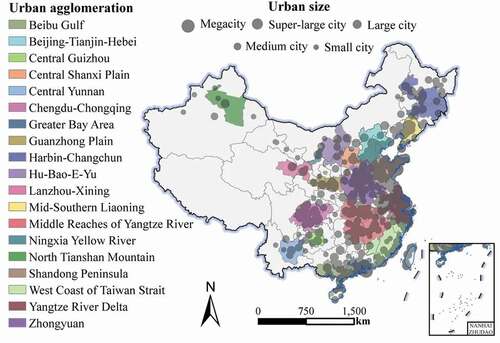
According to the WUP database (https://population.un.org/wup/), there were 433 county-level or higher cities with 300,000 inhabitants or more in China in 2018 (UN DESA, Citation2018), most of which fell within urban agglomerations. All of the cities identified as lying within these different urban agglomerations are shown in along with their populations. In order to map the ISA distribution for individual urban areas, we used Landsat 5/7 TM/ETM+ surface reflectance data (1990–2010), Sentinel-1 SAR backscatter data (2015) and Sentinel-2 surface reflectance (2015) time-series, as well as auxiliary data including Shuttle Radar Topography Mission (SRTM) digital elevation data, OpenStreetMap crowdsourced geospatial data, high-resolution Google Earth data, urban extent polygons and administrative areas.
Figure 1. Sample cities identified as lying within urban agglomerations along with their population sizes.
The remote sensing data included Landsat data (Landsat 5/7 TM/ETM+ surface reflectance images) with a spatial resolution of 30 × 30 meters covering the period 1 January 1990 to 31 December 2015 (https://earthexplorer.usgs.gov/) and data from the Sentinel series (Sentinel-1 SAR Ground Range Detected (GRD) scenes and Sentinel-2 surface reflectance images) with a spatial resolution of 10 × 10 meters covering the period 1 January 2015 to 30 June 2016 (https://scihub.copernicus.eu/). The SRTM digital elevation data provided by the National Aeronautics and Space Administration (NASA) were used to calculate slope images and generate mountain masks (https://www2.jpl.nasa.gov/srtm/). The OpenStreetMap crowdsourced geospatial data (https://www.openstreetmap.org/relation/270056) and high-resolution Google Earth images (https://earth.google.com/web/) were used to facilitate the segmentation of peri-urban and rural areas. The urban extent polygons and administrative areas were derived from the Global Rural-Urban Mapping Project, Version 1 (GRUMPv1) (http://sedac.ciesin.columbia.edu/) and the Database of Global Administrative Areas, version 3.6 (GADMv3.6) (http://www.gadm.org/), respectively, both of which were used to determine the boundaries of urban areas for the 433 Chinese cities. All of the data except for those obtained from OpenStreetMap and Google Earth were available and processed on the Google Earth Engine (GEE) platform. shows the different sources of remote sensing imagery, auxiliary data and demographic information used in this study.
Table 1. List of data sources with details of providers and how to access the data
In this study, we aimed to create a standardized urban built-up area dataset using the same definition of urban agglomeration area (UAA) adopted by the WUP database for cities in China (UN DESA, Citation2018). To this end, we produced large-area ISA maps in urban areas and then converted these into standardized built-up area products for these 433 cities. We employed a range of spectral indices to generate the 1990–2015 ISA maps based on remotely sensed data acquired from multiple sources. Subsequently, various types of auxiliary data were used to create the desired products for urban areas through manual segmentation of peri-urban and rural areas together with reference to several freely available products of urban extent derived from ISA data using automated urban–rural segmentation methods. Following the well-established rules adopted by the UN, we carried out the conversion to the standardized built-up area products from the 1990–2015 ISA maps in urban areas, which conformed to the definition of UAAs. Finally, we implemented data postprocessing to guarantee the spatial accuracy and temporal consistency of the final product.
2.2. Extraction of large-area ISA maps of urban areas
We used the same approach as in our previous studies to create large-area ISA maps based on multisource remotely sensed data that included Landsat and Sentinel time-series and developed an automatic mapping procedure on the GEE platform to support SDG11.3.1 monitoring and assessment (Jiang et al., Citation2021; Sun et al., Citation2019). Due to the availability of the different types of remote sensing imagery, we used different data sources and extraction methods to conduct ISA maps for the two periods of 1990–2010 and 2015. To produce the 1990–2010 ISA maps, we generated time series of the Normalized Difference Building Index (NDBI) (Zhang, Odeh, & Han, Citation2009), Perpendicular Impervious Index (PII) (Tian, Xu, & Yang, Citation2017), Modified Normalized Difference Water Index (MNDWI) (Xu & Hua, Citation2005), Normalized Difference Vegetation Index (NDVI) (Chen et al., Citation2004) and slope images from the Landsat 5/7 and SRTM DEM data. Based on these intermediate products, we adopted a range of thresholding strategies to derive the potential impervious surface area (PISA) and the PISA in arid and semi-arid regions (PISA_bare) as well as a water mask, vegetation mask and mountain mask. After masking the water, vegetation and mountain regions, the PISA and PISA_bare information were then utilized to produce a target impervious surface area (TISA) map. For the 2015 ISA map, we also applied customized thresholds to generate water, vegetation and mountain masks based on the MNDWI and NDVI time-series derived from the Sentinel-2 and SRTM DEM data. At the same time, we employed a stepwise logical operator to create high-brightness impervious surface area (HISA) and PISA maps using the Sentinel-1 data. In a similar way as for the 1990–2010 ISA maps, the HISA data were then utilized to produce the TISA map after masking the water, vegetation and mountain regions.
For the urban areas, we used OpenStreetMap crowdsourced geospatial data and Google Earth high-resolution images in combination with GRUMP urban extent polygons and GADM administrative areas to determine the urban impervious surface area (UISA) based on the TISA data through manual segmentation of the peri-urban and rural areas. We also referred to several freely available urban extent products derived from the ISA using automated urban–rural segmentation methods (Li, Gong, et al., Citation2020; Kuang et al., Citation2021; Zhou et al., Citation2018). It should be noted that we slightly extended the extent of the mapping to ensure full coverage of urban areas; some rural settlements that were incorrectly included as a result of this were excluded during the conversion from the ISA to built-up area maps. The final UISA maps (1990–2015) were obtained by applying a 3 × 3 majority filter to the UISA time-series. The proposed methodological framework for ISA mapping (1990–2010), ISA mapping (2015) and UISA extraction (1990–2015) is shown in . Further details of the workflows and parameter configurations used for the production of the 1990–2010 UISA map and 2015 UISA map can be found in Jiang et al. (Citation2021) and Sun et al. (Citation2019), respectively.
Figure 2. The proposed methodological framework for the extraction of large-area impervious surface area (ISA) products in urban areas using different data sources and mapping methods. PISA: potential impervious surface area; PISA_bare: potential impervious surface area in arid and semi-arid regions; HISA: high-brightness impervious surface area; TISA: target impervious surface area; UISA: urban impervious surface area.
Significantly, bare land belongs to neither the UISA nor the built-up area, whereas areas of open public space are considered not to belong to the UISA but are usually considered to be part of the built-up area. In addition, it is quite difficult to judge whether a peri-urban settlement should be aggregated into the built-up area of a multi-city agglomeration. Hence, attention should be paid to the conversion from UISA to built-up area rather than simply generating the former as a surrogate of the latter. Further investigation of the conversion from UISA to built-up area is clearly warranted, especially when conducting a combined analysis for use in urbanization studies.
2.3. Conversion from UISA to built-up area
According to the 2018 revision of the WUP, the term “urban agglomeration” is defined by “the de facto population contained within the contours of a contiguous territory inhabited at urban density levels without regard to administrative boundaries” and it usually incorporates “the population in a city or town plus that in the suburban areas lying outside of, but being adjacent to, the city boundaries” (UN DESA, Citation2018). Although the concept of “urban agglomeration” might seem a little abstract, the UN has provided several practical criteria for carrying out spatial data processing to ensure that any product of built-up area using other concepts can be adjusted to conform to the definition of UAA (UN-Habitat, Citation2019).
Following the rules recommended by the UN, we conducted a conversion from UISA to built-up area for the 433 cities in our study so as to produce a combined analysis based on Earth observation and census information and avoiding the spatial disaggregation of population data. First, we linked areas of urban patches that had an area of 200,000 square meters or more and that were less than 200 meters apart to form a continuous main urban area. Any polygons with an area of less than 57,600 square meters were eliminated from the vector products derived from the UISA map; “holes” with areas of less than 200,000 square meters lying inside the main urban area were filled to preserve the continuous distribution pattern. We also preserved the peri-urban patches that had close functional relations with the main urban area to improve the accuracy of the extent of built-up area. Then, aided by the high-resolution Google Earth images, we chose to locate manually the park and greenbelt patches that contained visible artificial structures and merged these newly added polygons into the main urban area to generate a built-up area that satisfied certain criteria. As the ISA product contained no pervious surface areas such as public open spaces (e.g. park and greenbelt patches), this last processing step was essential for the generation of built-up area from the ISA map. According to the minimum mapping unit for urban land adopted by the National Geomatics Center of China (Chen et al., Citation2015), artificial surfaces should occupy an area of at least 8 × 8 pixels in satellite images with a spatial resolution of 30 × 30 meters. This is why we eliminated polygons with an area of less than 57,600 square meters before the preservation and supplementation steps. A flowchart describing the conversion of the UISA map to the built-up area product for cities in China is shown in .
Figure 3. Flowchart showing the process of converting the urban impervious surface area (UISA) map to the built-up area product for cities in China.
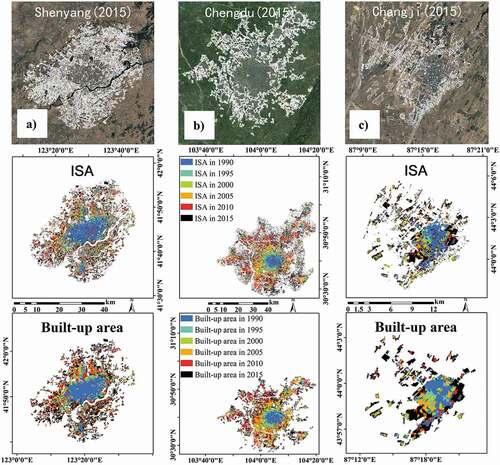
Furthermore, we conducted the postprocessing of layer overlap to ensure that any urban land identified as built-up area at a particular time would subsequently remain unchanged along with that any non-urban land excluded from the built-up area would also be counted out at earlier times. In this paper, we gave the final product the name “standardized urban built-up area dataset for China” (SUBAD–China). The extraction results included a high-resolution boundary of the UISA, and SUBAD–China retained the continuous patterns of urban built-up area that were consistent with the visual interpretation based on Google Earth images. As an example, the spatial expansion of the UISA and built-up area compared with Google Earth images in 2015 for Shenyang City (Liaoning Province), Chengdu City (Sichuan Province) and Changji City (Xinjiang Uygur Autonomous Region) are shown in .
Figure 4. Spatial expansion in the impervious surface area (ISA) and urban built-up area compared with google earth images in 2015 for three representative cities: a) Shenyang City (Liaoning Province); b) Chengdu City (Sichuan Province); c) Changji City (Xinjiang Uygur Autonomous Region). the white boundaries superimposed on the Google Earth images are from the dataset that we generated for 2015.
3. Validation and comparison
3.1. Validation of UISA products
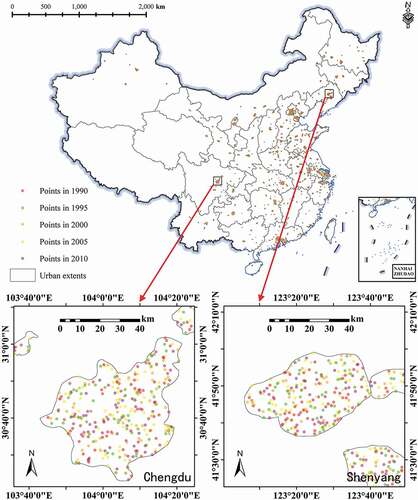
As far as we know, a large majority of the validation efforts made at different scales are based on reference point datasets collected through visual interpretation of high- and very high‐resolution satellite imagery (Sabo et al., Citation2018). Since we used different remote sensing data sets and processing steps to create the UISA maps for different time periods, there were slight differences in the validation processes that were used although randomly sampled points were used for the validation of both the 1990–2010 and 2015 UISA products. In the case of the 1990–2010 UISA products, 4000 validation points, each with a size of 30 m by 30 m, were randomly generated for each year to achieve a dense and even distribution. It should be mentioned that we generated the random validation points based on the areal extent of each urban agglomeration, which means that a larger city has proportionally more validation points than a smaller one with the total number being constrained. The distribution of validation points for the 1990–2010 UISA product is shown in and, as examples, we also show the validation points for Chengdu City (Sichuan Province) and Shenyang City (Liaoning Province) for five-year intervals during the period 1990–2010 within the corresponding urban extent polygons. For the 2015 UISA product, 224,000 validation points, each with a size of 10 m by 10 m, were generated to ensure full coverage of China’s major socio-economic zones and details of the selecting and labeling of these validation points can be found in Sun et al. (Citation2019).
Figure 5. Distribution of validation points for the 1990–2010 urban impervious surface area (UISA) products of 433 chinese cities with populations over 300,000. The black rectangles mark the location of the urban extent polygons of Chengdu City (Sichuan Province) and Shenyang City (Liaoning Province).
In the next step, we formulated a unified interpretation standard with reference to the visual interpretation of Google Earth images to determine how to judge whether a certain surface in an urban area was impervious or pervious (Sun et al., Citation2019). Each random point – whether it was a 30 m by 30 m point in the 1990–2010 UISA product or a 10 m by 10 m point in the 2015 UISA product – was coarser than a single pixel in the high-resolution Google Earth images (which have a size of 0.6 m by 0.6 m). Each validation pixel in UISA maps belonged to only one type (either urban or non-urban); however, when we superimposed one of these pixels on the Google Earth imagery, it was possible that there was some overlap with other land-cover types. If the amount of urban land in the area of overlap occupied more than a predefined threshold of 50%, we considered this area to be urban; if it did not, it was considered to be non-urban. During the validation process, image interpreters recorded a value of ‘1ʹ when the visual interpretation results were consistent with the extraction results and a value of ‘0ʹ when they were inconsistent. Using this as a basis, we generated confusion matrices between the classified data and reference data and then calculated the OA, PA and UA to validate the UISA maps for different time periods.
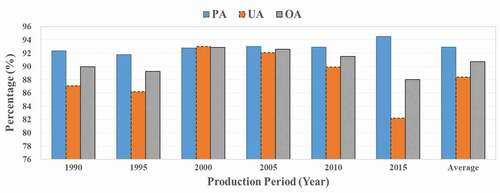
The OA, PA and UA results for the 1990–2015 UISA products for every five years during this period are shown in . The overall averages for the OA, PA and UA are 91.24%, 92.58% and 89.65%, respectively. In the case of the 1990–2010 UISA product, the average OA was 89.65% with a peak of 92.88% in 2000 and a lowest value of 89.25% in 1995. For the 2015 UISA product, the average OA was 88.03% with the lowest accuracies occurring in semi-arid and arid regions (Sun et al., Citation2019). It can be seen that the accuracy indicators were slightly lower for the 2015 UISA product than for the 1990–2010 UISA maps as a whole. This difference probably occurred because we used different sample sizes and numbers of validation points for the two products. In this study, we generated larger sample sizes and fewer validation points for the 1990–2010 UISA product than for the 2015 UISA product. Typically, a random point in the 1990–2010 UISA product included more land-cover types than a point in the 2015 UISA product when it was superimposed on the high-resolution Google Earth imagery. In addition, the accuracy indicators for 2000, 2005 and 2010 UISA products were relatively higher than for the 1990 and 1995 UISA products because high-resolution Google Earth imagery are not available for the period before 2000 – for this period, visual interpretation had to be carried out using Landsat imagery itself as a reference. The validation results for different periods showed a considerable difference due to the impacts of different reference data, sample sizes and numbers of validation points used during the validation process. Notwithstanding all of this, in most cases, the UISA products were validated as having an accuracy of over 85% or close to 90%, which meets the accuracy requirements of conversion from UISA maps to built-up area products.
Figure 6. The average overall accuracy (OA), producer’s accuracy (PA) and user’s accuracy (UA) of the urban impervious surface area (UISA) product for each period.
3.2. Comparison with other built-up area datasets
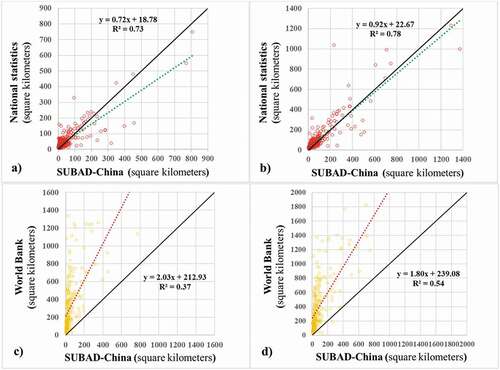
The existing built-up area datasets come from two main sources: the China Urban and Rural Construction Statistical Yearbook published by the National Bureau of Statistics of China since the 1980s and the online geospatial software tool “Platform for Urban Management and Analysis (PUMA)” sponsored by the World Bank (Dong, Wang, & Zhao, Citation2017). PUMA produces built-up area datasets for China as well as for other Asian countries (https://puma.worldbank.org/). However, the online tool only allows downloads of built-up area datasets in 2000 and 2010 currently, and the datasets also do not cover all cities in China. To make it easy to conduct a comparison between different built-up area datasets, we chose the 433 Chinese cities with 300,000 or more inhabitants listed in the WUP database as a reference and carried out a regression between SUBAD–China and datasets from the National Bureau of Statistics and World Bank. Because of the mismatches in the lists of urban areas and temporal inconsistencies, there were 413 matching cities in our dataset and that from the National Bureau of Statistics while there were 254 matching cities in our dataset and that from the World Bank. Scatter plots for these matching cities showing the built-up area estimates derived from the different datasets plotted on the x- and y-axes are shown in . For both 2000 and 2010, there is a good fit between the built-up area estimates derived from our dataset and those derived from the national statistics; however, overall, SUBAD–China gives lower estimates than the national statistics, particularly for 2000. We also compared the estimates using our dataset and that from the World Bank. It should be mentioned that using the World Bank dataset as a substitute for the national statistics clearly produces an overestimate. Despite the temporal inconsistency caused by adjustments to administrative divisions and changes in the statistical methods used, the built-up area dataset produced by the National Bureau of Statistics of China can be considered as a reliable reference for certain time periods. Fortunately, such built-up area datasets derived from remote sensing data (e.g. SUBAD–China and the World Bank dataset) can be used to characterize the long-term trends based on time-series as long as the standardization and automation of the data processing can be guaranteed.
Figure 7. Scatter plots for matched cities with each point representing an estimate of a built-up area derived from SUBAD-China and datasets produced by the National Bureau of Statistics of China and the World Bank: a) National Bureau of Statistics of China against SUBAD–China for 2000; b) National Bureau of Statistics of China against SUBAD–China for 2010; c) World Bank against SUBAD–China for 2000; d) World Bank against SUBAD–China for 2010.
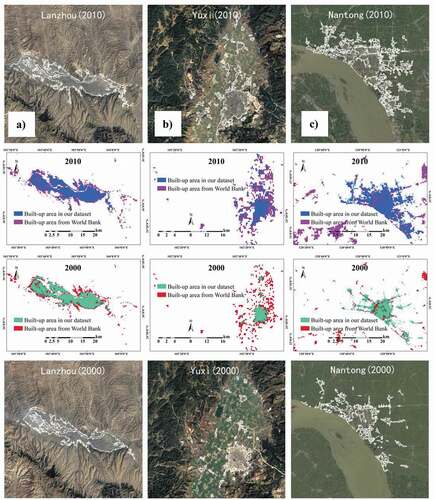
The comparison results between the estimated built-up area derived from our dataset and the World Bank for Lanzhou City (Gansu Province), Yuxi City (Yunnan Province) and Nantong City (Jiangsu Province) are shown in in a spatially explicit manner. It is clear that both the 2000 and 2010 results from the World Bank give a larger built-up area than SUBAD–China and that, for 2010, the boundary of the built-up area in our dataset nearly matches that in the referenced Google Earth images. These results indicate that, because of this overestimation problem, the built-up area dataset downloaded from PUMA is not suitable for quantifying the built-up area for cities in China. In the case of Lanzhou, PUMA classified many patches of bare land as being built-up area and some free-standing rural settlements were identified as built-up area in the case of Yuxi. In addition, a large water body was improperly included in the built-up area in Nantong. It could be concluded that SUBAD–China provides an alternative means of accurately delineating the spatial expansion of built-up areas by solving the problems encountered with the national statistics and the World Bank dataset that were described above. Combined with the WUP database, we can use the built-up area dataset that produced in this study to explore China’s urbanization process in terms of LCRPGR.
Figure 8. Spatially detailed results of a comparison between the estimated built-up area derived from our dataset and the world bank dataset for three representative cities: a) Lanzhou City (Gansu Province), b) Yuxi City (Yunnan Province) and c) Nantong City (Jiangsu Province). The white boundaries superimposed on the Google Earth images are the boundaries for the corresponding years generated using our dataset.
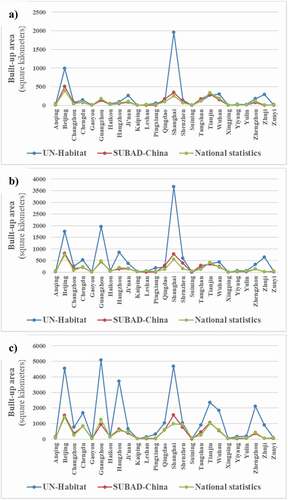
As well as, UN-Habitat, the Lincoln Institute and New York University have also recently prepared a harmonized dataset giving the built-up area and population for 200 cities worldwide; this has been published in the Atlas of Urban Expansion. The Atlas of Urban Expansion collects and analyzes data on the quantity and quality of urban expansion for a stratified global sample of 200 cities (including 34 cities in China) for the three different dates of 1990, 2000 and 2015 (http://www.atlasofurbanexpansion.org/). Because of the incompleteness of the relevant time-series and other limitations of data availability, there are only 25 Chinese cities for which matching data in SUBAD–China, the UN-Habitat database and the national statistics are available. Line graphs showing estimates of the built-up area derived from these different datasets for these 25 cities are shown in . It can easily be seen that the SUBAD–China estimates fit the national statistics well in 1990, 2000 and 2015 whereas the UN-Habitat dataset gives significant overestimates, especially for the megacities of Beijing, Shanghai and Guangzhou. In the absence of local knowledge, relying on the geographical proximity and ISA density to delineate the urban extent would tend to produce overestimates of the built-up area with a large proportion of rural settlements being incorrectly included. In conclusion, the above comparisons with existing built-up area datasets provided by the National Bureau of Statistics of China, World Bank and UN-habitat show that SUBAD–China can be used as a reliable data source to determine urban expansion in China associated with population growth.
Figure 9. Line charts of matched cities with built-up area estimates derived from the UN-Habitat, SUBAD-China and National Bureau of Statistics of China datasets for a) 1990; b) 2000 and c) 2015.
4. Case analysis
4.1. Calculation of SDG 11.3.1 for 433 Chinese cities
As we stated earlier, SDG 11.3.1, LCRPGR, which denotes the ratio of the land consumption rate to the population growth rate, can be used to quantify the relation between expansion and population growth in urban areas. Here, we combined the built-up area product with the WUP database to calculate this indicator for 433 Chinese cities. To simplify the analysis, we clustered the 433 sample cities into four classes based on the LCRPGR distribution to quantitatively identify the relation between land consumption and population growth, as shown in .
Table 2. Classification of cities in China based on the ratio of land consumption rate to population growth rate (LCRPGR) distribution
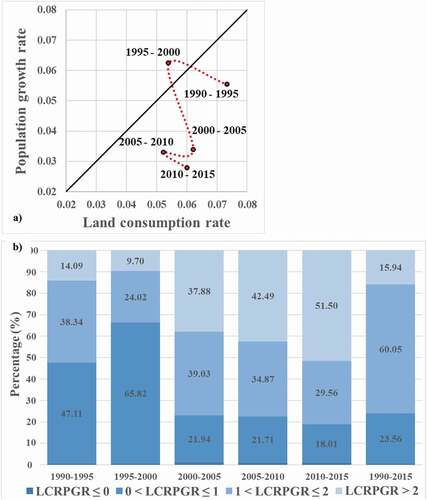
The urbanization process in China measured in terms of changes in LCRPGR for 433 county-level or higher cities is shown in . Overall, it can be seen that the value of LCRPGR rose from 1.34 during the period 1990–1995 to 2.15 during the period 2010–2015, and the land consumption rate exceeded the population growth rate throughout the whole period 1990–2015 except for the period 1995–2000, indicating that, for many Chinese cities, there are no restraints on the consumption of land and that this should be the focus of strengthened regulations. In detail, the proportions of cities with 0 < LCRPGR ≤ 1 (47.11%), 1 < LCRPGR ≤ 2 (38.34%) and LCRPGR > 2 (14.09%) occupied the top three places for the period 1990–1995, whereas for 2010–2015 these places were taken by LCRPGR > 2 (51.50%), 1 < LCRPGR ≤ 2 (29.56%) and 0 < LCRPGR ≤ 1 (18.01%). It is notable that the proportion cities with LCRPGR > 2 experienced a significant upward trend but the proportion with LCRPGR ≤ 0 remained below 1% throughout the whole time. Moreover, during period 1990–2015, the proportions of numbers of cities with LCRPGR > 2, 1 < EGRLCR ≤ 2 and 0 < LCRPGR ≤ 1 were 15.94%, 60.05% and 23.56%, respectively. Based on the estimates and analyses for 2015, it seems that some limits should be put on the expansion of urban built-up areas and that the coordinated development of urbanization in China faces huge challenges (Kuang, Citation2020b).
Figure 10. Spatiotemporal evolution of the ratio of the land consumption rate to the population growth rate (LCRPGR) in China from 1990 to 2015: a) plot of the LCRPGR and b) proportions of the number of cities in different LCRPGR classes.
4.2. Spatiotemporal evolution of cities in different urban agglomerations
We also considered the patterns and dynamics of the LCRPGR from the perspective of urban agglomerations at national, regional and local levels (Fang, Ma, & Wang, Citation2015). lists 19 urban agglomerations that correspond to each of these three levels.
Table 3. List of 19 urban agglomerations in China
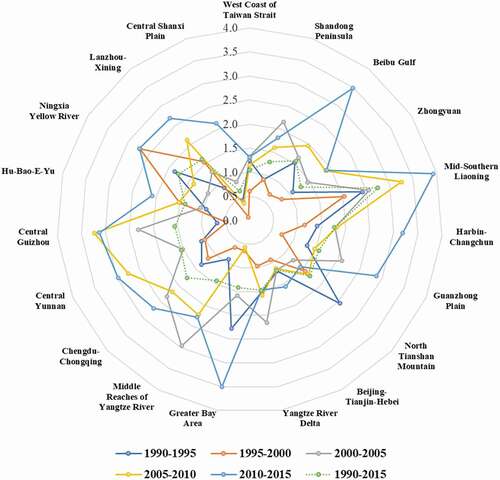
shows the LCRPGR distribution for different urban agglomerations in China from 1990 to 2015. During the period 1990–1995, the urban agglomerations with 0 < LCRPGR < 1 were Hu–Bao–E–Yu (0.93), the Middle Reaches of the Yangtze River (0.92), the Shandong Peninsula (0.90), Lanzhou–Xining (0.86), Central Guizhou (0.67) and the Central Shanxi Plain (0.45); the average values of the LCRPGR in the other urban agglomerations ranged from 1 to 3. During the period 2010–2015, the urban agglomerations with LCRPGR > 3 were Central-Southern Liaoning (3.93), the Greater Bay Area (3.51), the Beibu Gulf (3.48), Harbin–Changchun (3.19) and Central Guizhou (3.13); the average values of the LCRPGR in the other urban agglomerations still ranged from 1 to 3. It is also obvious that the LCRPGR of cities in different urban agglomerations was higher after 2000 relative to the corresponding average values for 1990–2015. It can be concluded that the relation between land urbanization and population urbanization was significantly weakened due to rapid urban expansion combined with a lasting slowdown in population growth, especially in the cases of Central-Southern Liaoning and Harbin–Changchun. The LCRPGR for the cities in Beijing–Tianjin–Hebei, the Yangtze River Delta and the West Coast of Taiwan was relatively stable and remained close to 1, indicating that the cities in these urban agglomerations had achieved a better coordination between land urbanization and population urbanization.
Figure 11. Distribution of the ratio of the land consumption rate to the population growth rate (LCRPGR) for different urban agglomerations grouped by time period.
5. Usage notes
To our knowledge, the standardized urban built-up area dataset introduced in this study is the first product using the same definition of UAA adopted by the WUP database for 433 cities in China (UN DESA, Citation2018). In addition, the comparisons made with contemporary data produced by the National Bureau of Statistics of China, the World Bank and UN-habitat indicate that our results have a high spatial accuracy and good temporal consistency and thus can be used to characterize the process of urban expansion in China. Users can directly combine the information on spatial expansion derived from this dataset with the population counts provided by the UN to conduct comprehensive studies of urbanization in China without resorting to other global high-resolution gridded population distribution datasets (Freire et al., Citation2020; Lloyd et al., Citation2019). SUBAD–China contains 2,598 vector files in shapefile format, which include data for all of the 433 Chinese cities listed in the WUP database that have different urban sizes and income levels with populations over 300,000. We also extended the time-period covered by the dataset from 1990 to 2015, with data provided at five-year intervals, in order to depict the spatiotemporal evolution of urbanization in China over recent decades. Furthermore, the UISA maps and the corresponding built-up area products for these cities will be consistently updated and refined to ensure the quality of their spatiotemporal coverage and accuracy. The production of this dataset will close some of the data gaps in the calculation of SDG11.3.1 and benefit other downstream applications relevant to the multidimensional analysis of the coordination of land consumption, population growth and economic development in urban areas.
Open Scholarship

This article has earned the Center for Open Science badge for Open Data. The data are openly accessible at http://www.doi.org/10.11922/sciencedb.j00076.00004.
Disclosure statement
No potential conflict of interest was reported by the author(s).
Data availability statement
The data described in this article are openly available in the Open Science Framework at http://www.doi.org/10.11922/sciencedb.j00076.00004.
Additional information
Funding
Notes on contributors

Huiping Jiang
Huiping Jiang received a B.Sc. degree in environmental resources and the management of urban and rural planning from Yunnan University, Kunming, China in 2012, an M.Sc. degree in cartography and geographic information systems from Wuhan University, Wuhan, China in 2015, and a Ph.D. degree in cartography and geographic information systems from the University of Chinese Academy of Sciences, Beijing, China in 2019. Since then, he has been a Postdoctoral Fellow at the Key Laboratory of Digital Earth Science, Aerospace Information Research Institute, Chinese Academy of Sciences, Beijing, China. His research interests include urban remote sensing, urban sustainability, human dimensions of global environmental change, and the monitoring, assessment and projection of the SDG goal 11 indicators.

Zhongchang Sun
Zhongchang Sun received a B.Eng. degree in surveying engineering from Shandong University of Science and Technology, Qingdao, China in 2005, an M.Eng. degree in geodesy and surveying engineering from Shandong University of Science and Technology, Qingdao, China in 2008, and a Ph.D. degree in cartography and geographic information systems from the Center for Earth Observation and Digital Earth, Chinese Academy of Sciences, Beijing, China in 2011. From 2011 to 2019, he was a Research Assistant, Postdoctoral Fellow, Visiting Scholar and Associate Professor in Germany, the U.S. and China. He is currently an Associate Professor with the Aerospace Information Research Institute, Chinese Academy of Sciences. His research interests include urban environmental remote sensing, land surface dynamics remote sensing and radar remote sensing.
References
- Anderson, K., Ryan, B., Sonntag, W., Kavvada, A., & Friedl, L. (2017). Earth observation in service of the 2030 agenda for sustainable development. Geo-spatial Information Science, 20(2), 77–96.
- Andries, A., Morse, S., Murphy, R., Lynch, J., Woolliams, E., & Fonweban, J. (2019). Translation of Earth observation data into sustainable development indicators: An analytical framework. Sustainable Development, 27(3), 366–376.
- As-syakur, A., Adnyana, I., Arthana, I. W., & Nuarsa, I. W. (2012). Enhanced built-up and bareness index (EBBI) for mapping built-up and bare land in an urban area. Remote Sensing, 4(10), 2957–2970.
- Bounoua, L., Nigro, J., Zhang, P., Thome, K., & Lachir, A. (2018). Mapping urbanization in the United States from 2001 to 2011. Applied Geography, 90, 123–133.
- Buettner, T. (2015). Urban estimates and projections at the United Nations: The strengths, weaknesses, and underpinnings of the world urbanization prospects. Spatial Demography, 3(2), 91–108.
- Carlson, T. N., & Arthur, S. T. (2000). The impact of land use-land cover changes due to urbanization on surface microclimate and hydrology: A satellite perspective. Global and Planetary Change, 25(1–2), 49–65.
- Chen, F., Zhang, H., Wu, Q., & Chen, W. (2010). A study on coordinate development between population urbanization and land urbanization in China. Human Geography, 25(5), 53–58.
- Chen, J., Chen, J., Liao, A., Cao, X., Chen, L., Chen, X., & Lu, M. (2015). Global land cover mapping at 30 m resolution: A POK-based operational approach. ISPRS Journal of Photogrammetry and Remote Sensing, 103, 7–27.
- Chen, J., Jönsson, P., Tamura, M., Gu, Z., Matsushita, B., & Eklundh, L. (2004). A simple method for reconstructing a high-quality NDVI time-series data set based on the savitzky–golay filter. Remote Sensing of Environment, 91(3–4), 332–344.
- Chen, M., Lu, D., & Zhang, H. (2009). Comprehensive evaluation and the driving factors of China’s urbanization. Acta Geographica Sinica, 64(4), 387–398.
- Corbane, C., Pesaresi, M., Kemper, T., Politis, P., Florczyk, A. J., Syrris, V., & Soille, P. (2019). Automated global delineation of human settlements from 40 years of Landsat satellite data archives. Big Earth Data, 3(2), 140–169.
- DESA, U. N. (2018). World Urbanization Prospects 2018. Available at: https://population.un.org/wup/
- Dong, L., Wang, H., & Zhao, H. (2017). The definition of city boundary and scaling law. Acta Geographica Sinica, 72(2), 213–223.
- Ettehadi Osgouei, P., Kaya, S., Sertel, E., & Alganci, U. (2019). Separating built-up areas from bare land in mediterranean cities using sentinel-2a imagery. Remote Sensing, 11(3), 345.
- Fang, C., Ma, H., & Wang, J. (2015). A regional categorization for “New-Type Urbanization” in China. Plos One, 10(8), e0134253.
- Freire, S., Schiavina, M., Florczyk, A. J., MacManus, K., Pesaresi, M., Corbane, C., & Sliuzas, R. (2020). Enhanced data and methods for improving open and free global population grids: Putting ‘leaving no one behind’into practice. International Journal of Digital Earth, 13(1), 61–77.
- Gallego, F., Batista, F., Rocha, C., & Mubareka, S. (2011). Disaggregating population density of the European Union with CORINE land cover. International Journal of Geographical Information Science, 25(12), 2051–2069.
- Gong, P., Li, X., Wang, J., Bai, Y., Chen, B., Hu, T., & Zhou, Y. (2020). Annual maps of global artificial impervious area (GAIA) between 1985 and 2018. Remote Sensing of Environment, 236, 111510.
- Gong, P., Li, X., & Zhang, W. (2019). 40-Year (1978–2017) human settlement changes in China reflected by impervious surfaces from satellite remote sensing. Science Bulletin, 64(11), 756–763.
- Güneralp, B., Reba, M., Hales, B. U., Wentz, E. A., & Seto, K. C. (2020). Trends in urban land expansion, density, and land transitions from 1970 to 2010: A global synthesis. Environmental Research Letters, 15(4), 044015.
- Guo, H. (2017). Big Earth Data: A new frontier in Earth and information sciences. Big Earth Data, 1(1–2), 4–20.
- Guo, H., Nativi, S., Liang, D., Craglia, M., Wang, L., Schade, S., & Shirazi, Z. (2020). Big Earth Data science: An information framework for a sustainable planet. International Journal of Digital Earth, 13(1), 1–25.
- Jiang, H., Sun, Z., Guo, H., Weng, Q., Du, W., Xing, Q., & Cai, G. (2021). An assessment of urbanization sustainability in China between 1990 and 2015 using land use efficiency indicators. Npj Urban Sustainability. doi:https://doi.org/10.1038/s42949-021-00032-y
- Kuang, W. (2020a). National urban land-use/cover change since the beginning of the 21st century and its policy implications in China. Land Use Policy, 97, 104747.
- Kuang, W. (2020b). 70 years of urban expansion across China: Trajectory, pattern, and national policies. Science Bulletin, 65(23), 1970–1974.
- Kuang, W., Du, G., Lu, D., Dou, Y., Li, X., Zhang, S., & Miao, C. (2021). Global observation of urban expansion and land-cover dynamics using satellite big-data. Science Bulletin, 66(4), 297–300.
- Li, X., Chen, G., & Xu, X. (2009). Urban allometric growth in China: Theory and facts. Acta Geographica Sinica, 64(4), 399–407.
- Li, X., Gong, P., Zhou, Y., Wang, J., Bai, Y., Chen, B., & Zhu, Z. (2020). Mapping global urban boundaries from the global artificial impervious area (GAIA) data. Environmental Research Letters, 15(9), 094044.
- Li, X., Zhou, Y., Zhu, Z., & Cao, W. (2020). A national dataset of 30 m annual urban extent dynamics (1985–2015) in the conterminous United States. Earth System Science Data, 12(1), 357.
- Li, Y., Sun, Q., Ji, X., Xu, L., Lu, C., & Zhao, Y. (2020). Defining the boundaries of urban built-up area based on taxi trajectories: A case study of Beijing. Journal of Geovisualization and Spatial Analysis, 4(1), 1–12.
- Liu, C., Huang, X., Zhu, Z., Chen, H., Tang, X., & Gong, J. (2019). Automatic extraction of built-up area from ZY3 multi-view satellite imagery: Analysis of 45 global cities. Remote Sensing of Environment, 226, 51–73.
- Liu, C., Yang, K., Bennett, M. M., Guo, Z., Cheng, L., & Li, M. (2019). Automated extraction of built-up areas by fusing VIIRS nighttime lights and Landsat-8 data. Remote Sensing, 11(13), 1571.
- Liu, X., Hu, G., Chen, Y., Li, X., Xu, X., Li, S., & Wang, S. (2018). High-resolution multi-temporal mapping of global urban land using landsat images based on the google earth engine platform. Remote Sensing of Environment, 209, 227–239.
- Lloyd, C. T., Chamberlain, H., Kerr, D., Yetman, G., Pistolesi, L., Stevens, F. R., & Sinha, P. (2019). Global spatio-temporally harmonised datasets for producing high-resolution gridded population distribution datasets. Big Earth Data, 3(2), 108–139.
- Ma, X., Li, C., Tong, X., & Liu, S. (2019). A new fusion approach for extracting urban built-up areas from multisource remotely sensed data. Remote Sensing, 11(21), 2516.
- Melchiorri, M., Pesaresi, M., Florczyk, A. J., Corbane, C., & Kemper, T. (2019). Principles and applications of the global human settlement layer as baseline for the land use efficiency indicator—SDG 11.3. 1. ISPRS International Journal of Geo-Information, 8(2), 96.
- Mertes, C. M., Schneider, A., Sulla-Menashe, D., Tatem, A. J., & Tan, B. (2015). Detecting change in urban areas at continental scales with MODIS data. Remote Sensing of Environment, 158, 331–347.
- Ministry of Housing and Urban-Rural Development of the People’s Republic of China. (1999). Basic terminology of urban planning standards. Beijing: China Construction Industry Press.
- Nicolau, R., David, J., Caetano, M., & Pereira, J. (2019). Ratio of land consumption rate to population growth rate—Analysis of different formulations applied to mainland Portugal. ISPRS International Journal of Geo-Information, 8(1), 10.
- Pesaresi, M., Corbane, C., Julea, A., Florczyk, A. J., Syrris, V., & Soille, P. (2016). Assessment of the added-value of Sentinel-2 for detecting built-up areas. Remote Sensing, 8(4), 299.
- Pesaresi, M., Ehrlich, D., Caravaggi, I., Kauffmann, M., & Louvrier, C. (2011). Toward global automatic built-up area recognition using optical VHR imagery. IEEE Journal of Selected Topics in Applied Earth Observations and Remote Sensing, 4(4), 923–934.
- Sabo, F., Corbane, C., Florczyk, A. J., Ferri, S., Pesaresi, M., & Kemper, T. (2018). Comparison of built‐up area maps produced within the global human settlement framework. Transactions in GIS, 22(6), 1406–1436.
- Schiavina, M., Melchiorri, M., Corbane, C., Florczyk, A. J., Freire, S., Pesaresi, M., & Kemper, T. (2019). Multi-scale estimation of land use efficiency (SDG 11.3. 1) across 25 years using global open and free data. Sustainability, 11(20), 5674.
- Schneider, A., Friedl, M. A., & Potere, D. (2010). Mapping global urban areas using MODIS 500-m data: New methods and datasets based on ‘urban ecoregions’. Remote Sensing of Environment, 114(8), 1733–1746.
- Schneider, A., Mertes, C. M., Tatem, A. J., Tan, B., Sulla-Menashe, D., Graves, S. J., & Schelly, I. H. (2015). A new urban landscape in East–Southeast Asia, 2000–2010. Environmental Research Letters, 10(3), 034002.
- Seto, K. C., Fragkias, M., Güneralp, B., & Reilly, M. K. (2011). A meta-analysis of global urban land expansion. PloS One, 6(8), e23777.
- Sharma, R. C., Tateishi, R., Hara, K., Gharechelou, S., & Iizuka, K. (2016). Global mapping of urban built-up areas of year 2014 by combining MODIS multispectral data with VIIRS nighttime light data. International Journal of Digital Earth, 9(10), 1004–1020.
- Sun, Z., Xu, R., Du, W., Wang, L., & Lu, D. (2019). High-resolution urban land mapping in China from sentinel 1A/2 imagery based on Google Earth Engine. Remote Sensing, 11(7), 752.
- Sun, Z., Yu, S., Guo, H., Wang, C., Zhang, Z., & Xu, R. (2020). Assessing 40 years of spatial dynamics and patterns in megacities along the belt and road region using satellite imagery. International Journal of Digital Earth. doi:https://doi.org/10.1080/17538947.2020.1747560
- Tan, M., & Lv, C. (2003). Distribution of China city size expressed by urban built-up area. Acta Geographica Sinica, 58(2), 285–293.
- Tian, Y., Xu, Y., & Yang, X. (2017). Perpendicular Impervious Index for remote sensing of multiple impervious surface extraction in cities. Acta Geodaetica et Cartographica Sinica, 46(4), 71–80.
- UN. (2015). Transforming our world: The 2030 Agenda for sustainable development. Resolution adopted by the General Assembly on 25 September 2015. New York: Author.
- UN-Habitat. (2019). SDG Goal 11 Monitoring Framework: A guide to assist national and local governments to monitor and report on SDG Goal 11 indicators. Available at https://unhabitat.org/sdg-goal-11-monitoring-framework
- Wang, L., Li, C., Ying, Q., Cheng, X., Wang, X., Li, X., & Gong, P. (2012). China’s urban expansion from 1990 to 2010 determined with satellite remote sensing. Chinese Science Bulletin, 57(22), 2802–2812.
- Xu, H. (2006). Modification of normalised difference water index (NDWI) to enhance open water features in remotely sensed imagery. International Journal of Remote Sensing, 27(14), 3025–3033.
- Xu, Q., & Hua, C. (2005). Establishing a uniform standard for calculation of urban built-up area with Hangzhou central city zone as an example. Planners, 21(4), 88–91.
- Zha, Y., Gao, J., & Ni, S. (2003). Use of normalized difference built-up index in automatically mapping urban areas from TM imagery. International Journal of Remote Sensing, 24(3), 583–594.
- Zhang, Y., Odeh, I. O. A., & Han, C. (2009). Bi-temporal characterization of land surface temperature in relation to impervious surface area, NDVI and NDBI, using a sub-pixel image analysis. International Journal of Applied Earth Observation and Geoinformation, 11(4), 256–264.
- Zhang, Z., Liu, F., Zhao, X., Wang, X., Shi, L., Xu, J., & Hu, S. (2018). Urban expansion in China based on remote sensing technology: A review. Chinese Geographical Science, 28(5), 727–743.
- Zhao, M., Zhou, Y., Li, X., Cheng, W., Zhou, C., Ma, T., & Huang, K. (2020). Mapping urban dynamics (1992–2018) in Southeast Asia using consistent nighttime light data from DMSP and VIIRS. Remote Sensing of Environment, 248, 111980.
- Zhou, Y., Li, X., Asrar, G. R., Smith, S. J., & Imhoff, M. (2018). A global record of annual urban dynamics (1992–2013) from nighttime lights. Remote Sensing of Environment, 219, 206–220.
- Zhou, Y., & Shi, Y. (1995). Toward establishing the concept of physical urban area in China. Acta Geographica Sinica, 62(4), 289–301.