
 ?Mathematical formulae have been encoded as MathML and are displayed in this HTML version using MathJax in order to improve their display. Uncheck the box to turn MathJax off. This feature requires Javascript. Click on a formula to zoom.
ABSTRACT
Exacerbated by climate change, Europe has experienced series of hot and dry summer since the beginning of the 21st century. The importance of land conditions became an international concern with a dedicated sustainable development goal (SDG), the SDG 15. It calls for developing and finding innovative solutions to follow and evaluate impacts of changing land conditions induced by various driving forces. In Switzerland, drought risk will significantly increase in the coming decades with severe consequences on agriculture, energy production and vegetation. In this paper, we used a 35-year satellite-derived annual and seasonal times-series of normalized difference water index (NDWI) to follow vegetation water content evolution at different spatial and temporal scales across Switzerland and related them to temperature and precipitation to investigate possible responses of changing climatic conditions. Results indicate that there is a small and slow drying tendency at the country scale with a NDWI mean decreasing slope of −0.22%/year for the 23% significant pixels across Switzerland. This tendency is mostly visible below 2000 m above sea level (m.a.s.l.) and in all biogeographical regions. The Southern Alps regions appear to be more responsive to changing drying conditions with a significant and slight negative NDWI trend (−0.39%/year) over the last 35 years. Moreover, NDWI values are mostly a function of temperature at elevations below the tree line rather than precipitation. Findings suggest that multi-annual and seasonal NDWI can be a valuable indicator to monitor vegetation water content at different scales, but other components such as land cover type and evapotranspiration should be considered to better characterize NDWI variability. Satellite Earth Observations data can provide valuable complementary observations for national statistics on the ecological state of vegetation to support SDG 15 to monitor land affected by drying conditions.
1. Introduction
Climate change is globally altering our environment with noticeable rising of temperatures, variations of precipitation regimes, and increasing frequency and intensity of extreme weather events (Gobiet et al., Citation2014; United Nations Environment Programme, Citation2021; Yoccoz, Delestrade, & Loison, Citation2010). These changes have significant impacts on the physical environment exemplified by reduction of snow cover (Schmucki, Marty, Fierz, Weingartner, & Lehning, Citation2017; Giuliani, et al. Citation2020; Poussin et al., Citation2019), glaciers receding (Fischer, Fickert, Schwaizer, Patzelt, & Groß, Citation2019; Zemp, Paul, Hoelzle, Haeberli, & Orlove et al., Citation2008), soil drying or increased drought frequency (Jiao, Wang, & McCabe, Citation2021; Magno et al., Citation2018). Switzerland with its mid-latitude position, continental climatic conditions and diversity of landscapes is particularly sensitive to climate change and has been strongly affected by the rise of temperatures (Beniston, Rebetez, Giorgi, & Marinucci, Citation1994; FOEN, Citation2021; Vittoz et al., Citation2013). Even if precipitation patterns have not changed significantly, considerable regional and seasonal changes have been observed. Average precipitations tend to decrease in summer and increase in winter. However, they are subject to large natural fluctuations, making the climate change impacts less evident than with the temperature trends (CH2014-Impacts, Citation2014; CH2018, Citation2018). Combined with summer high temperatures, dryness conditions can lead to drought that can have negative impacts on water resources, vegetation or agriculture affecting many water- and land-related ecosystem services (Brun et al., Citation2020; Mooney et al., Citation2009; Nolan et al., Citation2018; Zhou et al., Citation2017).
According to the CH2018 Climate Change Scenarios, vegetation in Switzerland is expected to suffer from changing climatic conditions especially with dryer summers (CH2018, Citation2018), such as experienced in 2003, 2010, 2013, 2015 and 2018 (Brunner et al. Citation2019). Using MODIS-derived normalized difference vegetation index (NDVI) dataset, Schuldt et al. (Citation2020) highlighted important drought stress on ecologically and economically important trees species in temperate forest of Switzerland accompanied by unprecedented tree mortality in many species in response to the 2018 drought event. Such episodes have marked a change in forest dynamics (Schuldt et al., Citation2020) and will become more frequent in the near future. Consequently, monitoring drying conditions is of high importance to mitigate and adapt to new conditions and pressures on land and ecosystems and reduce natural degradation.
The importance of drying conditions is emphasized in the United Nations 2030 Agenda for Sustainable Development (United Nations, Citation2015) contributing to various Sustainable Development Goals (SDGs) such as SDG 2 (“Zero Hunger”), SDG 3 (“Good Health and Well-Being), SDG 6 (“Clean Water and Sanitation), SDG 13 (“Climate Action”) and SDG 15 (“Life on Land”). This last goal aims to “protect, restore and promote sustainable use of terrestrial ecosystems, sustainably manage forests, combat desertification, and halt and reverse land degradation and halt biodiversity loss”. With less than 10 years to realize SDGs, it is becoming urgent to develop and implement innovative and scientifically based methods and indicators for monitoring and assessing vegetation health status caused by different driving forces such as changing weather conditions or human activities (Cherlet et al., Citation2018; Marusig et al., Citation2020).
Earth observation technologies can contribute to enhance quality, coverage and availability of information required to support the SDGs and can complement traditional national data collections (Fraisl et al., Citation2020; Fritz et al., Citation2019; Metternicht, Mueller, & Lucas, Citation2020). Since 1972, EO data provide the long baseline required to assess present conditions, determine trends and inform future evolution (i.e. as model inputs for forecasts) through detailed, synoptic, regular, consistent, spatially explicit, multi-spectral observations of the planet to identify impacts and monitor environmental changes (Andries, Morse, Murphy, Lynch, & Woolliams, Citation2019; Dhu et al., Citation2019; Whitcraft et al., Citation2019). Governments and spaces agencies are increasingly making EO data freely and openly accessible enabling scientists to generate time-series analysis enhancing understanding and knowledge on environmental changes from local to global scales (Dhu et al., Citation2017; Zhu et al., Citation2019).
Remote-sensing-based index have already been successfully used to measure and monitor drying conditions and the impact of drought events on vegetation (Brun et al., Citation2020; Javed et al., Citation2021; Oveisgharan, Haddad, Turk, Rodriguez, & Li, Citation2018; Peng, Wu, Zhang, Wang, & Gonsamo, Citation2019; Sun, Zhao, Chen, Gong, & Yang, Citation2013). In this regard, the accurate assessment of annual and seasonal changes is essential to determine the constraints on land ecosystem in changing climatic conditions (Chang, Wu, Yan, Davdai, & Nasanbat, Citation2017; Gu et al., Citation2008; Serrano, Shahidian, & Marques Da Silva, Citation2019; Svoboda & Fuchs, Citation2016). The evolution of vegetation water content can be followed using indices such as the normalized difference water index (NDWI) (Gao, Citation1996). Its usefulness has been demonstrated for drought monitoring, early warnings, agriculture and other domains (Bajgain et al., Citation2017; Ceccato, Flasse, & Grégoire, Citation2002; Ceccato, Flasse, Tarantola, Jacquemoud, & Grégoire, Citation2001; Gu, Brown, Verdin, & Wardlow, Citation2007; Gu et al., Citation2008; Jackson et al., Citation2004; Zhou et al., Citation2017). NDWI is a satellite-derived index conceived to quantify soil moisture and vegetation canopy water content (Gao, Citation1996; Jackson et al., Citation2004; Sánchez-Ruiz et al., Citation2014) responsive to local climatic conditions and soil properties controlling water availability (Serrano et al., Citation2019). It allows estimating changes in vegetation water content as it accounts for water absorption effects, which is captured in the short-wave infrared portion of the spectra (Wang, Fuller, da Silveira, O’Reilly Sternberg, & Miralles-Wilhelm, Citation2011).
Based on the previous considerations, with this paper, we present a first vegetation water content evolution at national and biogeographical scales, over the last three decades in Switzerland using satellite-derived annual and seasonal time-series of NDWI estimates. They are then related to two important weather parameters (temperature and precipitation) to evaluate the possible responses with changing climatic conditions. Finally, this work aims at contributing to provide spatially explicit information on the ecological state of vegetation to support SDG 15 on land.
2. Study area and climatic conditions
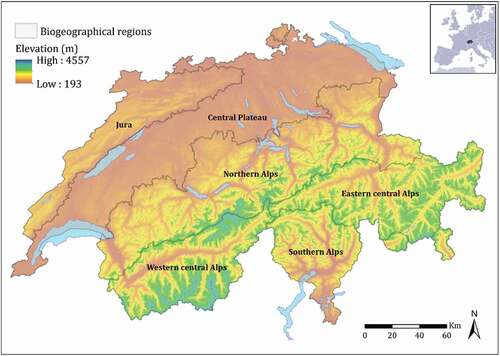
In this study, we have focused on the Swiss territory to benefit from the Swiss Data Cube (SDC) infrastructure designed to cover the whole Switzerland. Switzerland (41,285 km2) is covered by eight Landsat tiles and can be subdivided into six biogeographical regions () based on patterns of distribution of flora and fauna and adapted to the homogeneous surfaces of the river basins (FOEN, Citation2004). These six biogeographical regions exemplify a variety of landscapes and ecological features characterized by different climatic, geological and vegetation conditions. We can group these biogeographical regions into three main areas: the Alps covering around 60% of the total country (Northern Alps, Central Alps, Southern Alps) characterized by high elevations; the Swiss Plateau (30% of the total country) and the Jura (10% of the total country) characterized by low elevation. The Swiss climate is characterized as moderately continental in the plateau, alpine in the mountain regions and more temperate in the Southern Alps. Temperature distribution follows an altitudinal gradient with lower temperature in the Alps and higher temperature in the remaining regions. The precipitation is also affected by altitude with large amount of precipitation and high discharge in the Alps regions, while precipitation regime and discharge are lower in the Swiss Plateau region (Brunner et al., Citation2019). Alpine regions have melt-dominated regime with low-flow regime in winter and high-flow regime in summer (Brunner et al., Citation2019). Inversely, the Swiss Plateau, the Jura, and the southern Switzerland have rainfall-dominated regimes with high flow in winter and low flow in summer (Brunner et al., Citation2019). These diverse hydro-meteorological conditions imply that Alpine regions are mainly affected by winter droughts, while low land regions are mostly affected by summer droughts (Brunner et al., Citation2019).
Figure 1. Location and elevation of Switzerland and its six biogeographical regions
3. Methodology and implementation
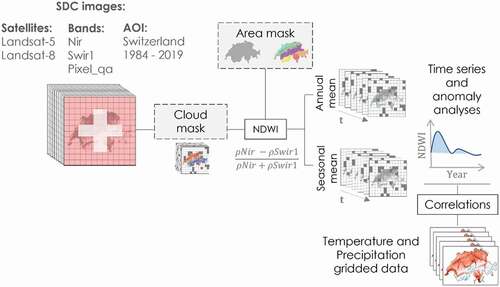
To generate vegetation water content time-series, NDWI was computed using satellite EO data from the Landsat program. NDWI values are calculated as the difference between near-infrared (NIR) and short-wave Infrared (SWIR) bands using the generic formula (1):
NDWI values range from −1 to +1, depending on the vegetation and land cover type and its condition. Negative values indicate areas with low vegetation content or dead vegetation, while positive values correspond to green vegetation, high plant water content, as well as possibly water and snow (Gao, Citation1996). NIR reflectance is not affected by water content changes but is modified by leaf internal structure and dry matter content, whereas SWIR reflectance indicates changes in vegetation water content and spongy mesophyll structure in vegetation canopies. The combination of these two bands improves the accuracy of vegetation water content estimates by removing variations caused by leaf internal structure and dry matter content (Ceccato et al., Citation2001). SWIR reflectance is controlled by the amount of water available in the internal leaf structure and negatively correlates with leaf water content (Tucker, Citation1980). Thus, NDWI is a suitable indicator to monitor plant water content conditions and to detect water stress and drought-related impacts on vegetation (Marusig et al., Citation2020).
NDWI computation and subsequent time-series analysis are summarized in . The SDC infrastructure was used to access and process Landsat data and generate annual and seasonal time-series, which were further used to detect anomalies and investigate possible correlations with national temperature and precipitation datasets.
Figure 2. Analytical framework of the study
3.1. Satellite EO data access and processing
Switzerland has an EO Analysis Ready Data archive over the entire national territory (Chatenoux et al., Citationin press). The Swiss Data Cube (SDC – http://www.swissdatacube.ch) is a tera-scale analytical cloud-computing platform allowing users the access, analysis and visualization up to 37 years of optical (e.g. Sentinel-2; Landsat-5, -7, -8) and radar (e.g. Sentinel-1) satellite EO data (Giuliani et al., Citation2017; Giuliani, Chatenoux, Honeck, & Richard, Citation2018; Small, Rohner, Miranda, Rüetschi, & Schaepman, Citation2021; Truckenbrodt et al., Citation2019). The SDC facilitates national-scale analyses of large volume of spatially aligned and consistently calibrated satellite EO data. The SDC is an initiative supported by the Federal Office for the Environment (FOEN) and developed, implemented and operated by the United Environment Program (UNEP)/GRID-Geneva in partnership with the University of Geneva (UNIGE), the University of Zurich (UZH), and the Swiss Federal Institute for Forest, Snow and Landscape Research (WSL). It is intended to contribute to the environmental and reporting mandate of the government while at the same time enabling any Swiss institutions to benefit from the wealth of information accessible from satellite EO data. The archive is updated daily and accounts approximately 13,500 scenes corresponding to a total volume of 6 TB and more than 1,000 billion observations/pixels. The SDC is based on the Open Data Cube (ODC) software stack, an open-source geospatial data management and analysis software project providing a common analytical framework for processing satellite data (Killough, Citation2018; Lewis et al., Citation2017). To facilitate the processing and analysis of these large volumes of data available in the SDC and develop methods, algorithms, tools and applications, users have access to a Python Application Programming Interface (API). This API is accessible through Jupyter Notebooks, an interactive web-based programming interface that can be used for combining software code, algorithm output and explanatory text.
NDWI mean annual and seasonal time-series have been computed for each 30 m pixel over the full geographic coverage of Switzerland for the period 1984 to 2019 and made available as a Python script in Jupyter Notebooks (Giuliani et al., Citation2020) and made freely and openly available in the SwissEnvEO data repository (Giuliani et al., Citation2021). It uses Level 2/Collection 1 Landsat-5 and -8 data as summarized in .
Table 1. Characteristics of Landsat data used to compute NDWI
Seasonal composites were produced for four periods: (1) December to February (DJF); (2) March to May (MAM); (3) June to August (JJA); and (4) September to November (SON). It should be noted that Landsat-7 has not been used because since 2003 it has data gaps induced by a Scan Line Corrector failure (Wulder, Ortlepp, White, & Maxwell, Citation2008). Consequently, no data were available for the year 2012. Unfortunately, with Landsat data, it is impossible to obtain monthly composites (e.g. maximum 2 images per month available), which would have been more beneficial to monitor NDWI variations. Nevertheless, with the synergetic use of Landsat-8 and Sentinel-2, which significantly increase the number of images available per month, it could be potentially feasible to generate meaningful monthly composites. According to Li and Roy (Citation2017) under mid-latitude regions, we can have approximately an image available every 3 days. Moreover, optical satellite images are known to be strongly affected by cloud contamination (Ibrahim et al., Citation2021; Nazarova, Martin, & Giuliani, Citation2020). In the SDC, clouds were filtered out using the cloud cover information included in the Landsat Collection 1 Level-1 Quality Assessment (QA) Band (Dwyer et al., Citation2018; Ernst, Lymburner, & Sixsmith, Citation2018). In this analysis, only clear observation pixels labeled as “clear”, “water” or “snow” were used. All other QA assessment band attributes were considered as “cloud-covered” pixels. The percentage of clear observations per pixel can be determined using the following Equationequation (2)(2)
(2) :
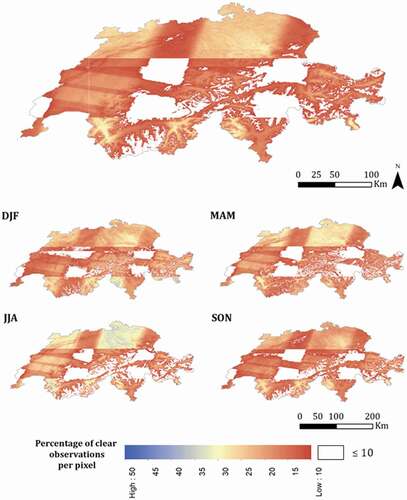
The depicts the percentage of clear observations per pixel across Switzerland for the 1984–2019 period. The percentage of cloud-free observations per pixel and for the entire period reached up to 35% in some areas in the north of the country and in some valleys (yellow to light blue areas). However, most of all pixels (59%) are only cloud-free in 10% to 20% of all observations. Consequently, only pixels with more than 10% of clear observations have been considered and 23% of all pixels (i.e. white areas in ) had to be excluded for the analysis. Most of these areas are located in the Alps that are particularly prone to cloud cover. For the winter season (DJF) around 10% of pixels are excluded, 15% of pixels for the spring season (MAM), 22% of pixels for the summer season (JJA) and 17% of pixels for the autumn season (SON). Likewise, some seasonal periods had to be excluded from the analyses because of cloud cover conditions such as the winter seasons for the year 2003, 2008 and 2013, the 2003 spring season and the 1986 and 2002 autumn seasons.
Figure 3. Percentage of clear observations per pixel across Switzerland for the 1984–2019 period for the annual (top) and seasonal mean (DJF, MAM, JJA, SON). White areas indicate pixels with less than 10% of clear observations over the study period
3.2. Time-series analysis and statistics
Using the annual and seasonal NDWI time-series, trends can be determined by computing zonal statistics (i.e. mean, max, min and std by region) on pixel values of raster within zones defined by another dataset. In that case, national border and biogeographical regions are used to calculate these zonal statistics. These datasets are available on the Swiss geographic catalog (https://www.geocat.ch) and downloaded as shapefiles.
Linear regression analysis was conducted to determine temporal NDWI trends (slope), r2 coefficient and p-values. To complete the statistical analysis, we calculated the Mann-Kendall trend test to determine whether significant trend exists in time-series data (Mann, Citation1945). This statistical test does not require a particular distribution of the data and is robust with non-uniform sampling (Hirsch & Slack, Citation1984). Also, for each remote-sensing-based time series, the autocorrelation (ACF) and partial autocorrelation (PACF) were conducted (Javed et al., Citation2021; Javed, Yao, Chen, Suon, & Li, Citation2020). The ACF observes the correlation of the variable with itself at different time lags. PACF, on the other hand, summarizes the correlation between observations of time series with observations at previous time-lapse, but with the relationships of intervening observations removed.
Further, NDWI anomalies have been calculated to assess the deviation from the long-term average at a given time. NDWI anomalies were computed for every year, season and decade period based on the standard score (z-score) as followed (3):
where Xt is the pixel NDWI value of the current year (season or decade) and Xmean and Xstd are the long-term mean and standard deviation NDWI over the period 1984–1994. The baseline statistical period covers 1984 to 2019. The anomalies are “normalized” using the standard deviation to consider NDWI variability between years.
Anomalies can take negative or positive values depending on whether the data are lower or higher than the long-term average of its whole series. Negative (positive) values can be a good indicator of episodes of low (high) vegetation water content due to a variety of environmental conditions such as drought. To facilitate the interpretation of the anomalies, values have been reclassified into seven classes ranging from extremely bad (strongly reduced NDWI) to extremely good (strongly enhanced NDWI) conditions following the classification of the World Meteorological Organization for the standardized Precipitation (WMO, Citation2012) proposed by Meroni, Fasbender, Rembold, Atzberger, and Klisch (Citation2019) ().
Table 2. Classification of NDWI z-score anomaly values based on the methodology of Meroni et al. (Citation2019)
3.3. Correlation analysis
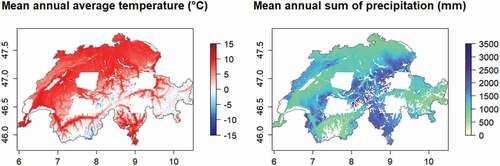
As the NDWI is a measure of liquid water molecules in vegetation, this index is closely related to local climate such as temperature and precipitation controlling water availability (Gao, Citation1996). Therefore, correlations between NDWI and weather variables have been computed to study possible relations with changing climatic conditions. For the temperature data, MeteoSwiss Grid-Data Product mean surface temperature has been used (MeteoSwiss, Citation2016a). Temperatures are calculated at 2 m above surface in degrees Celsius and averaged using daily mean values. Regarding precipitation, a dataset of accumulated precipitation in millimeters including rainfall and snowfall water equivalent processed by MeteoSwiss has been used (MeteoSwiss, Citation2016b). These datasets represent spatial distribution, at 1 km spatial resolution, of seasonally and yearly mean temperature and precipitation covering the entire territory of Switzerland for the period of 1984 to 2018 ().
Figure 4. Spatial distribution of mean annual average temperature and mean annual sum of precipitation for the period 1984–2018 across Switzerland. White areas indicate pixels with less than 10% of clear observations over the study area
To set the remote-sensing dataset and the climatic variables at the same spatial resolution, all the NDWI data were spatially resampled with the nearest neighbor method to 1 km and aligned to the climatic variables coordinate. Areas with less than 10% of clear remote-sensing observations over the study have also been removed from the climatic dataset.
To evaluate the linear relationship of temperature and precipitation with the INDWI, correlation coefficients (r and p_value) have been computed using Pearson’s correlation method over 1984 to 2018 for the annual and seasonal means for Switzerland and for the six biogeographic regions. Additionally, a pixelwise Spearman correlation analyses between the annual and seasonal time series were generated to look spatial repartition of the relationship across time and between different variables (Zhao et al., Citation2020).
4. Results
4.1. National and biogeographical NDWI time-series evolution
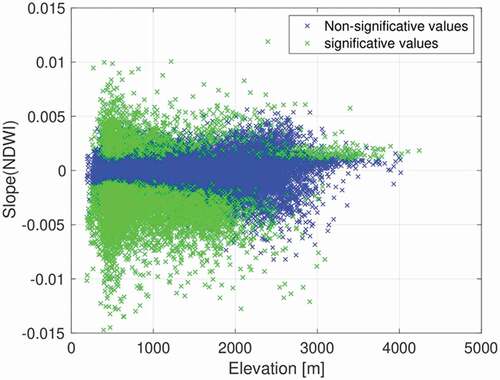
High mean NDWI values for the whole time period were concentrated in the Alps and in the Jura Mountains (). Inversely, low NDWI values were located on the plain and in the Swiss valleys. From the linear regression computed for 77,761,233 pixels across Switzerland over the 35 years, more than 23% of the NDWI pixels have a significant trend at the 95% confidence level (). Within these pixels, more than 72% has a negative trend indicating a small decrease in the NDWI values over time on the Swiss territory. However, significant values in the NDWI trend map are relatively small (i.e. significant trend mean = −0.0022) indicating a limited NDWI change over the period 1984–2019. However, spatial and elevation analyses reveal that regions below 2000 meters above sea level (m.a.s.l.) show a stronger trend and the southern alps seems to be more affected ().
Figure 5. (A) Overall mean annual NDWI, and (B) Annual NDWI significant slope at the 95% significance level over the period 1984–2019 across Switzerland
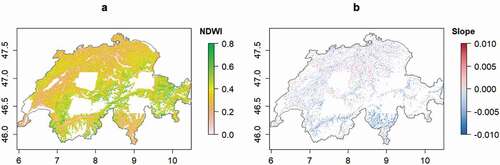
Figure 6. Relation between NDWI change and elevation across Switzerland over the period 1984–2018
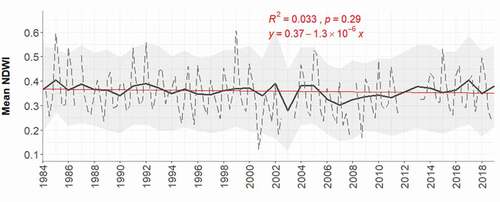
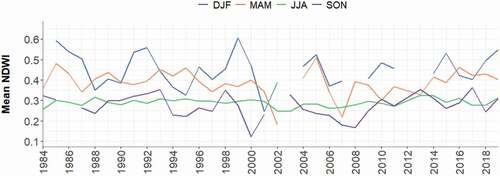
At national scale no significant trend in annual NDWI estimates was found (R2 = 0.033 and p_value = 0.29) ( solid line). Mean annual NDWI time series show no autocorrelation and Mann-Kendall test confirms that no significant trend is visible through time (tau = −0.109 and p_value = 0.36). Mean annual NDWI values showed variations ranging from 0.28 in 2003 to 0.40 in 2017. The mean standard deviation per year (light grey area in ) measuring the amount of variation of the NDWI values per year suggest a relatively high NDWI variability within a year, which is further investigated with the subsequent seasonal time series analysis. Mean seasonal time series ( dashed line) described well the seasonal pattern with high NDWI values in winter (mean NDWI of 0.45) and spring (mean NDWI of 0.39), and low NDWI values in summer (mean NDWI of 0.29) and autumn (mean NDWI of 0.27). ACF and PACF analyses pointed out seasonal patterns.
Figure 7. Mean Annual NDWI (solid line) and Mean Seasonal NDWI (dashed line) trend for Switzerland for the period 1984–2019. The light grey area represents the mean standard deviation per year. The regression line is illustrated in red
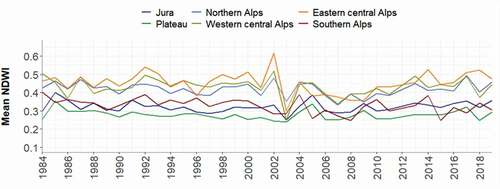
The regional analyses reveal no significant trend over time for all biogeographical regions ) except for the Southern Alps showing a slight decline of NDWI values over time with a decreasing rate of −0.39%/year (). No autocorrelation and partial autocorrelations were found in time series. As observed in the pixel wise analyses, low altitude regions such as the Jura and the Plateau have NDWI values lower than alpine regions. Averages of the first 10 years (1984–1994) versus averages of the last 10 years (2009–2019) indicate a relatively high variability depending on the region with a weak increase of 0.06% in the Jura and a decrease in NDWI of −3.26% in the Southern Alps, which is the most affected region of Switzerland.
Table 3. Linear regression coefficient and Mann Kendall coefficient for the mean annual NDWI time series for the six biogeographical regions. The (*) indicate statistically significant tau correlation at 95% confidence level (p-value < 0.05)
Figure 8. Mean Annual NDWI trend for the six biogeographical regions for the period 1984–2019
To apprehend these variations in more details and to better understand mean annual NDWI trends and the effects of inner-annual variation of meteorological conditions, the use of the seasonal time-series was investigated (). The shows annual fluctuations with no significant trend over the 35 years (). The winter season shows large variability from year to year and was strongly affected by cloud cover not allowing NDWI calculations for the years 2003, 2008 and 2013. In Spring, NDWI values vary around 0.39 with low values between years 2000 and 2013. Variation in summer was much lower than for other seasons with NDWI values less impacted by seasonality and external factors such as cloud and snow cover. From the linear regression analysis, the pixel time-series analysis for the summer months suggests that 45% of the 24% significant pixels possess a weak significant negative trend and particularly below 1000 m.a.s.l.
Table 4. Linear regression coefficient and Mann Kendall coefficient for the mean seasonal NDWI time series for Switzerland
Figure 9. Mean Seasonal NDWI trend for Switzerland for the period 1984–2019
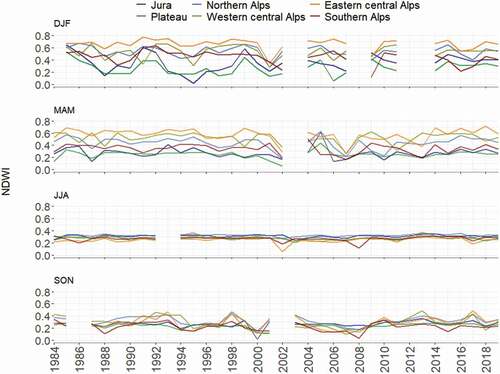
To observe general spatial and temporal patterns of NDWI, shows mean NDWI values from 1984 to 2019 per biogeographical regions and for each season. The Mann-Kendall trend test for the seasonal and regional analysis reveals no significative trend in the time series except for the Southern Alps during the winter season. Indeed, for this region, the Mann-Kendall correlation coefficient (tau = −0.301 and p_value = 0.02) shows a negative trend. According to the autocorrelation analyses, time series are white noise without autocorrelation. However, the seasonal analysis revealed that winter and spring seasons have relatively the same pattern with some NDWI values higher (varying from 0.02 to 0.78 for DJF and from 0.06 to 0.71 for MAM) than for the summer months (varying from 0.05 to 0.37) and for the autumn season (varying from 0.02 to 0.49). Similarly, winter and spring seasons present considerable annual and spatial variability, in contrast to summer and autumn seasons. Since the 2000s, we can observe more events with low NDWI values in all seasons and for all biogeographical regions. The Southern Alps stand out from the rest of the Alps, with a lower NDWI overall than the North, East and West Alps. Indeed, it is often the most affected region with, for example, in Spring 2013 and 2015 NDWI values reached values of the Plateau and the Jura (NDWI value of 0.20 and 0.24), while the other Alps regions have an NDWI between 0.41 and 0.58.
Figure 10. Mean Seasonal NDWI trends by biogeographical regions for the period 1984–2019
4.2. NDWI z-score anomalies
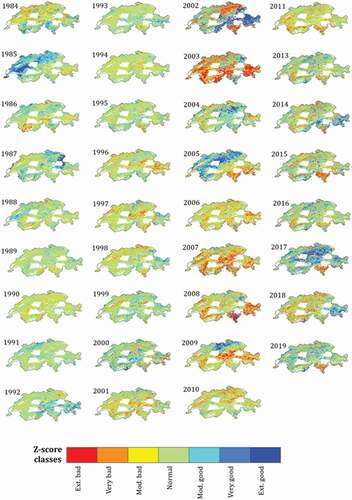
NDWI anomalies are used to identify particular drying conditions for the 1984 to 2019 period. shows annual NDWI z-scores for the 1984–1994 reference period. Some years such as 1985 (i.e. NDWI mean z-score of 0.66 for Switzerland) and 2017 (i.e. NDWI mean z-score of 0.42 for Switzerland) have particularly high and positive NDWI z-score anomalies across the Swiss territory (i.e. dark blue in the ). Inversely, years 2003 and 2007 show unusual low NDWI z-score anomaly values (NDWI mean z-score of −1.20 and −1.07, respectively) illustrated by red pixels throughout the country classified as extremely bad conditions. Since the 2000s, we can observe more events with high NDWI z-score anomalies across Switzerland.
Figure 11. Mean Annual NDWI z-score anomalies for Switzerland for the period 1984–2019. Pixel classes are based on the classification of .Meroni et al. (Citation2019)
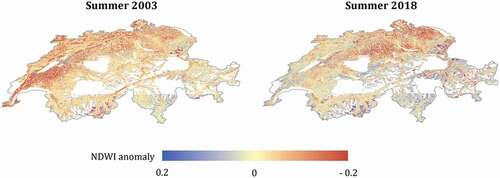
Moreover, illustrates absolute anomalies (i.e. difference between the current summer and a long-term average) for the summers 2003 and 2018 compared to the mean of the entire period studied (summers from 1984 to 2019). We focus on the summer 2003 and 2018 because these summers were characterized as the first and the third warmest summer since records began in 1864 in Switzerland. Precipitation levels were also lower than the seasonal average. Summer 2003 and 2018 show strong anomalies in low elevation regions, particularly in the Plateau region and in the Jura. The situation in high altitude, particularly in 2018, seems to be less impacted with positive anomalies.
Figure 12. Mean Seasonal NDWI absolute anomalies for the years 2003 and 2018 compared to the entire summer studied (1984–2019) across Switzerland
Similarly, z-score anomalies were computed at the biogeographical scale and for different decades, showing slightly negative anomalies in most regions (). As observed at the national scale, the period 2000–2009 shows particularly low z-score values for all Swiss regions, which might be related to drying conditions.
Table 5. Mean NDWI values and anomalies for Switzerland and the six biogeographical regions by decades. The baseline period is 1984–1994. Shaded boxes show negative NDWI z-scores, while whited boxes indicate positive NDWI z-scores
4.3. Correlations between NDWI and temperature/precipitation
Annual and seasonal NDWI estimates at pixel, biogeographical and national scales have been correlated to temperature and precipitation datasets provided by MeteoSwiss using Pearson’s correlation method.
On the national-scale, a negative but non-significative correlation (r = −0.33 and p-value = 0.055) between NDWI values and annual mean temperature was found (). Most biogeographical regions also show a negative correlation, which were significant for the Central Plateau and the Southern Alps. The negative correlation suggests that NDWI values are lower with higher temperatures. For the seasonal analyses, the role of the temperature is more complex. The correlations are principally negative and statistically significant for some biogeographical region. In summer, the correlation between the two variables is particularly strong (r = −0.52 and p-value = 0.002) in the Central plateau. The correlations of NDWI and precipitation () are mostly positive indicating that precipitation relates to an increase in the vegetation water content index measured by NDWI particularly for the Eastern and Southern Alps. For the seasonal analyses, the correlation is more contrasted with non-significant and small r coefficient values (lower than 0.27) for all regions.
Table 6. Correlation results between annual and seasonal NDWI and weather variables ((A) temperature and (B) precipitation) at national and biogeographical scale for the period 1984–2018. The (*) indicate statistically significant correlation at 95% confidence level (p-value < 0.05).
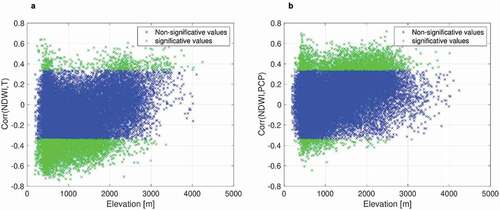
For the temperature (), 23% of all pixels are significant with mainly negative correlations (79% of the significative pixels) across the country (mean correlation of −0.37). As exemplified in , the correlation is stronger at low elevation indicating a most important relation between temperature and the NDWI in the plain and the valleys. The more one moves in altitude, the more correlations are week and positive. Annual evolution for precipitations is contrasting with temperatures, presenting positive correlations for most biogeographical regions and a mean correlation of 0.29 (). Nevertheless, only 9% of the pixels across Switzerland are significative with mostly positive correlations (85% of the significative pixels are positives). As illustrated in , elevation does not influence the spatial correlation between precipitation and NDWI. The seasonal situation is almost the same, for all seasons revealing a weak influence of precipitations on the NDWI values.
Figure 13. Pixel-wise correlation between annual mean NDWI, annual mean temperature (A) and annual precipitation (B) over the period 1984–2018. Only significant pixel (correlation at 95% confidence level (p-value < 0.05)) are shown in the image
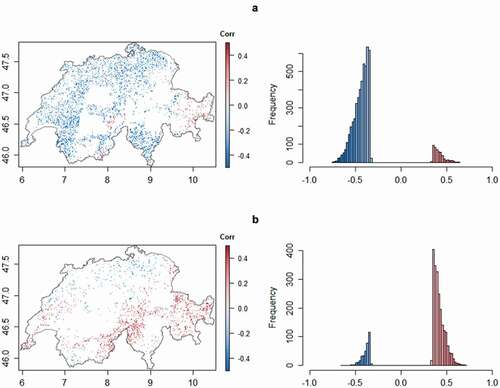
Figure 14. Relation between correlations of annual mean NDWI and weather variables ((A) annual mean temperature and (B) annual precipitation) and elevation across Switzerland over the period 1984–2018
Concerning seasonal correlations, winter months show a strong significative and negative correlation (r = −0.40 and p-value = 0.027) between the NDWI and the temperature for the national scale with 25% of the pixel significatively correlated and 91% of the 25% negatively. This is probably related to snow cover that may influence the NDWI values. Pixel-wise analysis highlights that the precipitation influence more strongly low elevation regions such as the Jura Mountains and the Central Plateau than the Alpines regions. The effect of temperature in summer is more nuanced with positive correlations in the Alps regions and negative correlations in the lowlands. More than 22% of the pixels present a significative correlation but 59% of the 22% are negatives and 41% of the 22% are positives. Concerning precipitations, for all seasons a weak influence of precipitations on the NDWI values can be observed.
5. Discussion
5.1. NDWI spatiotemporal patterns across Switzerland
The results obtained in this paper show that NDWI time-series can provide insightful information on vegetation condition at different spatial and temporal scales. It provides systematic and continuous information of vegetation water content at moderate spatial resolutions (i.e. 30 m) on the entire Swiss territory.
The computed statistics at different spatial and temporal scales present contrasted results, but still indicate an NDWI decrease in many cases and especially at the pixel level for the annual mean. The mean annual NDWI change over the three decades is relatively small with a mean change of −0.22%/year and most pronounced at low-to-mid elevations (between 0 and 2000 m above sea level). At higher altitude, the NDWI situation is more complex, partly because less useful EO data are available (snow cover, cloud cover and shadows) and other natural entities can influence NDWI values. As mentioned by Allgaier Leuch, Streit, and Brang (Citation2017), the relationship between evapotranspiration real and potential (ETr/ETp relation) measuring water availability in the field is above a critical threshold in most Swiss regions. This tendency, however, is on the decline and will deteriorate depending on the regions and the climate future. Moreover, in situ measurements along an elevation transect in the southern Sierra Nevada mountains regions highlight that vegetation environments at the lower-to-middle elevations are water limited, while environments at higher altitudes are energy limited (Trujillo, Molotch, Goulden, Kelly, & Bales, Citation2012). Southern Alps hosting 50% of the Swiss forest cover seem to be more responsive to these increasing drying conditions showing a stronger and significant decline compared to the other regions. However, the presence of snow and glaciers in certain regions makes it more difficult to interpret annual averages as well as comparisons between different biogeographic regions. Similarly, the NDWI variability between biogeographic region depends mostly on the type of vegetation as well as the geographical location (Kueppers et al., Citation2017). Vegetation located in regions of high precipitation and cooler weather such as the northern edge of the Alps is, for example, less impacted by water stress (Scherler, Remund, & Walthert, Citation2016). Seasonal NDWI analyses reveal a strong year-to-year variability for the winter and autumn months compared to the summer season and particularly at high altitudes. These variations can be explained by the seasonality and external factors such as snow and cloud cover dynamics and conditions. However, since the 2000s, more events with low NDWI values are visible in all biogeographical regions. With the climate change, this tendency will increase by the end of the century because less water will be available and particularly during vegetation period (from April to August) (Allgaier Leuch et al., Citation2017).
Annual NDWI z-score anomalies show particular drying conditions between the years 2000 and 2010 across Switzerland. Summer NDWI absolute anomalies for the year 2003 and 2018 clearly illustrate the impact of heatwave conditions on vegetation water content, which shows that NDWI nicely responds to climatic conditions and is very sensitive to drought. The 2003 heatwave affecting Europe during summer has considerable impacts such as losses in crop yield (Fink et al., Citation2004). After the drought of summer 2018, where temperatures rose by 3.3°C, many trees died, especially in the mountainous regions (Schuldt et al., Citation2020). These two particular drought events have been observed elsewhere in Europe and highlighted differing sensitivity of land cover classes to drought (Buras, Rammig, & Zang, Citation2020). Finally, anomalies can provide valuable information but are dependent on the length of the time-series. This period should be long enough to get a relevant characterization of the studied area (Jiao et al., Citation2021; Svoboda & Fuchs, Citation2016).
The 35 years’ time-series is both a relatively long and relatively short period. Indeed, the effects visible over a time series would be more impressive with a longer dataset, and therefore, over a longer period. As global warming is not a recent phenomenon, it is perceptible in the long term, as evidenced by the study by Rebetez (Citation1999). Its analysis showed that already throughout the 20th century, Switzerland experienced episodes of drought, particularly in the 1940s and after 1981, and that these episodes of droughts increased in intensity and frequency. We should keep in mind that NDWI is an indicator of leaf water content in vegetation, and not an indicator of drought. A possibility to have a better view on droughts is combining NDWI with NDVI in a Normalized Difference Drought Index (NDDI) (Bushra et al., Citation2019; Gulácsi & Kovács, Citation2015; Lee et al., Citation2016) and validate it with in situ measurements and help to define thresholds and train models. However, this indicator does not have a global drought threshold and, moreover, is not recorded within the IDMP (Jayawardhana & Chathurange, Citation2020).
5.2. Response of the NDWI to climatic variables
In this study, the NDWI time-series analyses showed relatively good relationship with the meteorological variables, particularly with temperature. At pixel level, NDWI responds slightly to temperature and precipitation conditions across Switzerland over the years studied. NDWI seems to be more influenced by temperature at elevation below 2000 m.a.s.l. (below the upper tree line), while the role of the precipitation is fairly similar at all heights. Changes in NDWI are elevation-dependent, therefore trends in precipitation and temperature with elevation play different roles depending on the altitudinal gradient. Similarly, Peng et al. (Citation2012), who explored the response of NDVI to drought in different biomes in Northeast China, show that the response of vegetation environments to temperature and precipitation changes varies according to the vegetation type. The sensitivity of NDWI to temperature and precipitation emphasizes the usefulness of the remote-sensing-based index to assess water stress. This result is in agreement with Sánchez-Ruiz et al. (Citation2014) saying that the spectral signature of vegetation in NIR and SWIR bands can be related with plant water content.
The summer period and the autumn period seem to be the most affected by low NDWI conditions. However, with temperatures warming in winter, the season sees heavy precipitation rather than the snowfall characteristic of this season, which particularly affects the alpine economy. On the other hand, we have seen that the humidity of the vegetation seems to be more affected by an increase in temperatures than by a decrease in precipitation. To better understand this relation, it would be interesting to correlate NDWI values with other dataset data such as the Water availability for plant datasets (https://www.geocat.ch/geonetwork/srv/eng/md.viewer#/full_view/668e4c81-5926-4457-9097-b362244b2660/tab/complete) to clearly determine if the signal is linked with drought events (Jiao et al., Citation2021). Moreover, drying conditions and water stress are not the only factors that influence NDWI values and anomalies over time. Changes in land cover or vegetation diseases can cause significant variations of estimates (Oveisgharan et al., Citation2018).
It would be interesting to predict NDWI scenarios based on the temperature increase scenarios of the IPCC. These forecasts would, for example, be useful for agricultural development, the development of ski resorts in Alpine regions, and more generally, tourism. According to the Swiss Climate Change Scenarios 2018 (CH2018, Citation2018) rainfall will not be reduced, but the seasonal distribution will vary.
Such approach can be useful not only to assess the Drivers, Pressures and State of land but can be further enhanced to understand what Impacts from drying conditions on specific land classes are. Consequently, intersecting the obtained results with land cover data can allow identifying the most sensible land classes and how they affect NDWI responses to changing conditions. Moreover, as drying conditions are both affecting land productivity and land cover, it can be interesting to understand their impacts on land degradation.
5.3. From NDWI to Sustainable Development Goals
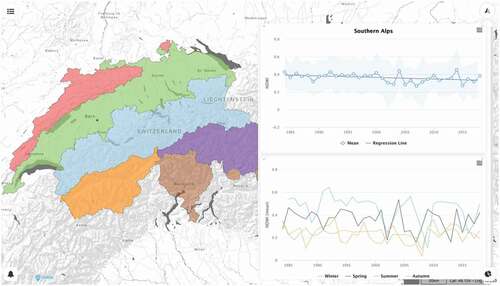
Drying conditions information can contribute to different SDGs such as SDGs 2, 3, 6, 10, 13, and 15. Among other it can affect land productivity and land cover change and in turn can therefore influence land degradation, food security, well-being, water availability and quality, and inequalities (Cowie et al., Citation2018; Cherlet et al., Citation2018; Gregory Giuliani et al., Citation2020). Drought monitoring refers to the continuous collection and analysis of drought indicators based firstly on in situ measurements of environmental variables (Crocetti et al., Citation2020). With its long history and continuous observations, remote sensing technologies revolutionized the field of drought monitoring over different spatial and temporal scale (West, Quinn, & Horswell, Citation2019). EO have improved knowledge of drought monitoring and the ability to assess drought condition and evolution providing near-real time information (Crocetti et al., Citation2020). This study demonstrates that NDWI could be valuable as additional indicator for drought monitoring at different spatial and temporal scale. Early recognition of plant water stress and the understanding of the dynamics over different regions can be critical to prevent some consequences. To support decision-makers and practitioners to gain knowledge on a specific issue, all the generated information can be organized and made available using dashboards and data stories (Fegraus et al., Citation2012; Van Ginkel, Hoekstra, Buurman, & Hogeboom, Citation2018). It allows users to visualize and explore relevant information in a concise and comprehensible way (Giuliani et al., Citation2020). All information studied in this article are integrated into the MapX platform (Lacroix et al., Citation2019) providing a consistent and comprehensible access to explore and understand the issue at stake (). The dashboard enables users to dynamically explore maps and statistics at different spatial and temporal scale across Switzerland to provide information on the plant water stress. In addition, some text is also provided to explain the issue and provided detailed information. Such capabilities can pose the basis for a monitoring service than can ultimately integrate and aggregate other data/information provided by national entities to better understand and monitor land affected by drying conditions and to support SDGs.
Figure 15. NDWI information dashboard showing NDWI annual and seasonal time-series at biogeographical scale in the MapX platform
6. Conclusions and perspectives
Switzerland with its mid-latitude position, continental climatic conditions and diversity of landscapes is really sensitive to climate change. In particular, drying conditions are expected to intensify, creating important pressures on land ecosystems. Early identification of vegetation water drying conditions is, therefore, essential to prevent major consequences. This importance is recognized by the United Nations 2030 Agenda for Sustainable Development in particular in the SDG15. It calls to provide near-real-time information on vegetation water content to decision-makers to monitor, assess adapt and mitigate impacts of land degradation caused by different driving forces such as changing weather conditions or human activity.
We showed that NDWI time-series extracted from 35 years of Landsat data can be used to monitor vegetation canopy water content at different spatial and temporal scales. Even if the national annual mean is useful to obtain an overview of the general condition, disaggregation at lower spatial and temporal scales is needed to gain knowledge on conditions in specific land portions (e.g. biogeographical regions) and to distinguish the contrasting effects at different spatial and temporal scales. Our results suggest that there is a small and slow drying tendency at the country scale, mostly at low- and mid-altitudes and especially in the Southern Alpine region. Across Switzerland, the NDWI appears to be mostly controlled by temperature at elevations below the tree line. The relationship of NDWI with precipitation was less clear, maybe because precipitation has only an indirect effect on plant-available water (depending on the soil type etc.). Weather variables are not the only factors that we have to take in consideration to explain NDWI evolution. Other components such as land cover change, evapotranspiration or diseases can also play a role on NDWI variability. The use of large volume of satellite EO data to generate the necessary measurements to retrieve adequate information on trends is a prerequisite to efficiently monitor environmental variables. To that end, the use of an EO Data Cube (EODC) has been pivotal to effectively manage and process terabytes of ready to analyse data or provide information on land conditions and therefore essential to contribute to measure progresses towards SDG15 and others. Ultimately, this work can be seen as an exploratory contribution providing nationwide spatially explicit information on the ecological state of vegetation to support SDG15 to monitor land affected by drying conditions using satellite Earth Observations.
Acknowledgments
The views expressed in the paper are those of the authors and do not necessarily reflect the views of the institutions they belong to.
This research was funded by European Commission “Horizon 2020 Program” ERA-PLANET/GEOEssential project, grant number 689443.
Results of this publication are partly or fully relying on the Swiss Data Cube (http://www.swissdatacube.org), operated and maintained by UN Environment/GRID-Geneva, the University of Geneva, the University of Zurich and the Swiss Federal Institute for Forest, Snow and Landscape Research WSL.
Disclosure statement
No potential conflict of interest was reported by the author(s).
Data availability statement
The NDWI time-series data that support the findings of this study are openly available at https://doi.org/10.26037/yareta:xzczpcai2nbp5l4na7rx2oelse and https://doi.org/10.26037/yareta:bwtgg2z5cbhf3e47rugqhmhgui. Temperature (TabsM and TabsY) and precipitation (RhiresM and RhiresY) dataset from the MeteoSwiss platform – Spatial Climate Analysis data are available for registered users at: https://www.meteoswiss.admin.ch/home/climate/swiss-climate-in-detail/raeumliche-klimaanalysen.html.
Additional information
Notes on contributors

Charlotte Poussin
Charlotte Poussin is a PhD student at the University of Geneva/Institute for Environmental Sciences & GRID-Geneva. Her research topic is on assessing and monitoring the impacts of climate change in Switzerland using time series analyses in the Swiss Data Cube.

Alexandrine Massot
Alexandrine Massot is an MSc student at the University of Geneva/Institute for Environmental Sciences on Biodiversity and Climate Change.

Christian Ginzler
Dr. Christian Ginzler is a senior scientist and team leader of the Land Change Science Remote Sensing group at Swiss Federal Institute for Forest, Snow and Landscape Research (WSL). He manages projects of remote sensing tasks of nation-wide monitoring programms (e.g., Swiss National Forest Inventory, Biotopmonitoring Switzerland). His research interests include digital photogrammetry, digital surface models and applied remote sensing.

Dominique Weber
Dominique Weber is a technical staff member of the Land Change Science Remote Sensing group at Swiss Federal Institute for Forest, Snow and Landscape Research (WSL). He is an environmental scientist with special interest in remote sensing, ecology and conservation.

Bruno Chatenoux
Bruno Chatenoux is the Swiss Data Cube project scientists and analyst. Mr. Chatenoux is a civil-engineer and geologist specialized in GIS in environmental sciences. He joined UNEP/GRID-Geneva in 2005 to model the impact of the South-East Asia Tsunami according to environmental features. He has been involved on various projects such as the water quality and quantity modelling of lake Balaton (Hungary) with SWAT software, maintenance of the PREVIEW web application, natural hazard events and exposure modelling for the main one. He also worked as a consultant for the Small Arms Survey (SHBA project), and as a GIS advisor for the French Red Cross.

Pierre Lacroix
Dr. Pierre Lacroix is a senior scientist working at University of Geneva+ in the enviroSPACE laboratory (Institute for Environmental Sciences). He is also specialist in Spatial Data Infrastructure (SDI) at the United Nations Environment Science Division. He has worked in the private and public sectors, in France and in Switzerland, and has participated in various research projects at different geographical scales, from local to international, and in different domains such as water resource management, humanitarian demining and transparency in the extractives sector. He has been work package leader in FP7 IASON (iason-fp7.eu/) and is currently the technology manager of MAPX (mapping and assessing the performance of extractive industries:mapx.org). He holds a PhD in environmental sciences and is also civil engineer (French ‘Ecole+des+Mines’).

Thomas Piller
Thomas Piller has an MSc in geology and a GIS expert at UNEP/GRID-Geneva where he is involved in the MapX project.

Liliane Nguyen
Liliane Nguyen is a PhD student at the University of Geneva/Institute for Environmental Sciences in the Nonlinerarity and Climate group.

Gregory Giuliani
Dr. Gregory Giuliani is the Head of the Digital Earth Unit and Swiss Data Cube Project Leader at GRID-Geneva of the United Nations Environment Programme (UNEP) and a Senior Lecturer at the University of Geneva’s Institute for Environmental Sciences. He is a geologist and environmental scientist who specializes in Remote Sensing, Geographical Information Systems (GIS) and Spatial Data Infrastructures (SDI). He also works at GRID-Geneva of the United Nations Environment Programme (UNEP) since 2001, where he was previously the focal point for Spatial Data Infrastructure (SDI) and is currently the Head of the Digital Earth Unit. Dr. Giuliani's research focuses on Land Change Science and how Earth observations can be used to monitor and assess environmental changes and support sustainable development.
References
- Allgaier Leuch, B., Streit, K., & Brang, P. (2017). La Forêt Suisse Face Aux Changements Climatiques: Quelles Évolutions Attendre? https://www.dora.lib4ri.ch/wsl/islandora/object/wsl%3A13288/.
- Andries, A., Morse, S., Murphy, R. J., Lynch, J., & Woolliams, E. R. (2019). Seeing sustainability from space: using earth observation data to populate the un sustainable development goal indicators. Sustainability, 11(18), 5062.
- Bajgain, R., Xiao, X., Basara, J., Wagle, P., Zhou, Y., Zhang, Y., & Mahan, H. (2017). Assessing Agricultural Drought in Summer over Oklahoma Mesonet Sites Using the Water-Related Vegetation Index from MODIS. International Journal of Biometeorology, 61(2), 377–390.
- Beniston, M., Rebetez, M., Giorgi, F., & Marinucci, M. R. (1994). An analysis of regional climate change in Switzerland. Theoretical and Applied Climatolog,y, 49(3), 135–159.
- Brun, P., Psomas, A., Ginzler, C., Thuiller, W., Zappa, M., & Zimmermann, N. E. (2020). Large-Scale Early-Wilting Response of Central European Forests to the 2018 Extreme Drought. Global Change Biology, 26(12), 7021–7035.
- Brunner, M., Liechti, K., & Zappa, M. (2019). Extremeness of recent drought events in Switzerland: Dependence on variable and return period choice. Natural Hazards and Earth System Sciences, 19, 2311–2323.
- Buras, A., Rammig, A., & Zang, C. S. (2020). Quantifying Impacts of the 2018 Drought on European Ecosystems in Comparison to 2003. Biogeosciences, 17(6), 1655–1672.
- Bushra, N., Rohli, R. V., Lam, N. S. N., Zou, L., Bin Mostafiz, R., & Mihunov, V. (2019). The Relationship between the Normalized Difference Vegetation Index and Drought Indices in the South Central United States. Natural Hazards, 96(2), 791–808.
- Ceccato, P., Flasse, S., & Grégoire, J. M. (2002). Designing a Spectral Index to Estimate Vegetation Water Content from Remote Sensing Data: Part 2. Validation and Applications. Remote Sensing of Environment, 82(2), 198–207.
- Ceccato, P., Flasse, S., Tarantola, S., Jacquemoud, S., & Grégoire, J. M. (2001). Detecting Vegetation Leaf Water Content Using Reflectance in the Optical Domain. Remote Sensing of Environment, 77(1), 22–33.
- CH2014-Impacts. (2014). Toward Quantitative Scenarios of Climate Change Impacts in Switzerland. Switzerland: Bern.
- CH2018 (2018). CH2018 – Climate Scenarios for Switzerland, Technical Report. Zurich, Switzerland.
- Chang, S., Wu, B., Yan, N., Davdai, B., & Nasanbat, E. (2017). Suitability Assessment of Satellite-Derived Drought Indices for Mongolian Grassland. Remote Sensing, 9(7), 650.
- Chatenoux, B., .Richard J. -P. Small D., Roeoesli C., Wingate V., Poussin C., Rodila D., Peduzzi P., Steinmeier C., Ginzler C., Psomas A., Schaepman M., Giuliani G (in press). The Swiss Data Cube: Analysis Ready Data Archive Using Earth Observations of Switzerland, Scientific Data.
- Cherlet, M., Hutchinson, C., Reynolds, J., Hill, J., Sommer, S., & von Maltitz, G. (Eds.). (2018). World Atlas of Desertification. Luxembourg: Publication Office of the European Union.
- Cowie, A. L., Orr, B. J., Castillo Sanchez, V. M., Chasek, P., Crossman, N. D., Erlewein, A., Louwagie, G., Maron, M., Metternicht, G. I., Minelli, S., Tengberg, A. E., Walter, S., & Welton, S (2018). Land in Balance: The Scientific Conceptual Framework for Land Degradation Neutrality. Environmental Science & Policy, 79(January), 25–35.
- Crocetti, L., Forkel, M., Fischer, M., Jurečka, F., Grlj, A., Salentinig, A., Trnka, M., Anderson, M., Ng, W. -T., Kokalj, Z., Bucur, A., & Dorigo, W. (2020). Earth Observation for Agricultural Drought Monitoring in the Pannonian Basin (Southeastern Europe): Current State and Future Directions. Regional Environmental Change, 20(4), 123.
- Dhu, T., Dunn, B., Lewis, B., Lymburner, L., Mueller, N., Telfer, E., … Phillips, C. (2017). Digital Earth Australia – Unlocking New Value from Earth Observation Data. Big Earth Data, 1(1–2), 64–74.
- Dhu, T., Giuliani, J., Kavvada, J., Killough, A., Merodio, B., Minchin, P., & Ramage, S. (2019). National Open Data Cubes and Their Contribution to Country-Level Development Policies and Practices. Data, 4(4), 144.
- Dwyer, J., Roy, D., Sauer, B., Jenkerson, C., Zhang, H., & Lymburner, L. (2018). Analysis Ready Data: Enabling Analysis of the Landsat Archive, August. https://doi.org/https://doi.org/10.20944/preprints201808.0029.v1
- Ernst, S., Lymburner, L., & Sixsmith, J. (2018). Implications of Pixel Quality Flags on the Observation Density of a Continental Landsat Archive. Remote Sensing, 10(10), 1570.
- Federal Office for the Environment FOEN. (2004). Biogeographical regions of Switzerland (CH). Retrieved from 07 July 2021. https://opendata.swiss/en/dataset/biogeographische-regionen-der-schweiz-ch
- Fegraus, E. H., Zaslavsky, I., Whitenack, T., Dempewolf, J., Ahumada, J. A., Lin, K., & Andelman, S. J. (2012). Interdisciplinary Decision Support Dashboard: A New Framework for a Tanzanian Agricultural and Ecosystem Service Monitoring System Pilot. IEEE Journal of Selected Topics in Applied Earth Observations and Remote Sensing, 5(6), 1700–1708.
- Fink, A. H., Brücher, T., Krüger, A., Leckebusch, G. C., Pinto, J. G., & Ulbrich, U. (2004). The 2003 European Summer Heatwaves and Drought –Synoptic Diagnosis and Impacts. Weather, 59(8), 209–216.
- Fischer, A., Fickert, T., Schwaizer, G., Patzelt, G., & Groß, G. (2019). Vegetation Dynamics in Alpine Glacier Forelands Tackled from Space. Scientific Reports, 9(1), 1–13.
- FOEN. (2021). Effects of Climate Change on Swiss Water Bodies. Bern, Switzerland: Author.
- Fraisl, D., Campbell, J., See, L., Wehn, U., Wardlaw, J., Gold, M., Moorthy, I., Arias, R., Piera, J., Oliver, J. L., Maso, J., Penker, M., & Fritz, S. (2020, July). Mapping Citizen Science Contributions to the UN Sustainable Development Goals. Sustainability Science, https://doi.org/10.1007/s11625-020-00833-7
- Fritz, S., See, L., Carlson, T., Haklay, M., Oliver, J. L., Fraisl, D., Mondardini, R., Brocklehurst, M., Shanley, L. A., Schade, S., Wehn, U., Abrate, T., Anstee, J., Arnold, S., Billot, M., Campbell, J., Espey, J., Gold, M., Hager, G., He, S., Hepburn, L., Hsu, A., Long, D., Masó, J., McCallum, I., Muniafu, M., Moorthy, I., Obersteiner, M., Parker, A. J., Weisspflug, M., & West, S. (2019). Citizen Science and the United Nations Sustainable Development Goals. Nature Sustainability, 2(10), 922–930.
- Gao, B. (1996). NDWI—A Normalized Difference Water Index for Remote Sensing of Vegetation Liquid Water from Space. Remote Sensing of Environment, 58(3), 257–266.
- Giuliani, G., Cazeaux, H., Burgi, P.-Y., Poussin, C., Richard, J.-P., & Chatenoux, B. (2021). SwissEnvEO: A FAIR National Environmental Data Repository for Earth Observation Open Science. Data Science Journal, 20(1), 22.
- Giuliani, G., Chatenoux, B., Benvenuti, A., Lacroix, P., Santoro, M., & Mazzetti, P. (2020). Monitoring Land Degradation at National Level Using Satellite Earth Observation Time-Series Data to Support SDG15 – Exploring the Potential of Data Cube. Big Earth Data, 4(1), 1–20.
- Giuliani, G., Chatenoux, B., De Bono, A., Rodila, D., Richard, J.-P., Allenbach, K., … Peduzzi, P. (2017). Building an Earth Observations Data Cube: Lessons Learned from the Swiss Data Cube (SDC) on Generating Analysis Ready Data (ARD). Big Earth Data, 1(1), 1–18.
- Giuliani, G., Chatenoux, B., Honeck, E., & Richard, J.-P. (2018). Towards Sentinel-2 Analysis Ready Data: A Swiss Data Cube Perspective. In IGARSS 2018-2018 IEEE International Geoscience and Remote Sensing Symposium, 8659–8662. Valencia, Spain. https://doi.org/https://doi.org/10.1109/IGARSS.2018.8517954.
- Giuliani, G., Egger, E., Italiano, J., Poussin, C., Richard, J.-P., & Chatenoux, B. (2020). Essential Variables for Environmental Monitoring: What Are the Possible Contributions of Earth Observation Data Cubes? Data, 5(4), 100.
- Giuliani, G., Mazzetti, P., Santoro, M., Nativi, S., Van Bemmelen, J., Colangeli, G., & Lehmann, A. (2020). Knowledge Generation Using Satellite Earth Observations to Support Sustainable Development Goals (SDG): A Use Case on Land Degradation. International Journal of Applied Earth Observation and Geoinformation, 88(June), 102068.
- Gobiet, A., Kotlarski, S., Beniston, M., Heinrich, G., Rajczak, J., & Stoffel, M. (2014). 21st Century Climate Change in the European Alps—A Review. Science of the Total Environment, 493(September), 1138–1151.
- Gu, Y., Brown, J. F., Verdin, J. P., & Wardlow, B. (2007). A Five-Year Analysis of MODIS NDVI and NDWI for Grassland Drought Assessment over the Central Great Plains of the United States. Geophysical Research Letters, 34, 6.
- Gu, Y., Hunt, E., Wardlow, B., Basara, J. B., Brown, J. F., & Verdin, J. (2008). Evaluation of MODIS NDVI and NDWI for Vegetation Drought Monitoring Using Oklahoma Mesonet Soil Moisture Data. Drought Mitigation Center Faculty Publications, January. https://digitalcommons.unl.edu/droughtfacpub/116.
- Gulácsi, A., & Kovács, F. (2015). Drought Monitoring With Spectral Indices Calculated From Modis Satellite Images In Hungary. Journal of Environmental Geography, 8(3–4), 11–20.
- Hirsch, R. M., & Slack, J. R. (1984). A Nonparametric Trend Test for Seasonal Data With Serial Dependence. Water Resources Research, 20(6), 727–732.
- Ibrahim, E., Jiang, J., Lema, L., Barnabé, P., Giuliani, G., Lacroix, P., & Pirard, E. (2021). Cloud and Cloud-Shadow Detection for Applications in Mapping Small-Scale Mining in Colombia Using Sentinel-2 Imagery. Remote Sensing, 13(4), 736.
- Jackson, T. J., Chen, D., Cosh, M., Li, F., Anderson, M., Walthall, C., … Hunt, E. R. (2004). Vegetation Water Content Mapping Using Landsat Data Derived Normalized Difference Water Index for Corn and Soybeans. Remote Sensing of Environment, 2002 Soil Moisture Experiment (SMEX02), 92(4), 475–482.
- Javed, T., Li, Y., Rashid, S., Li, F., Hu, Q., Feng, H., … Pulatov, B. (2021). Performance and Relationship of Four Different Agricultural Drought Indices for Drought Monitoring in China’s Mainland Using Remote Sensing Data. Science of the Total Environment, 759(March), 143530.
- Javed, T., Yao, N., Chen, X., Suon, S., & Li, Y. (2020). Drought Evolution Indicated by Meteorological and Remote-Sensing Drought Indices under Different Land Cover Types in China. Environmental Science and Pollution Research, 27(4), 4258–4274.
- Javed, T., Zhang, J., Bhattarai, N., Sha, Z., Rashid, S., Yun, B., … Kamran, M. (2021). Drought Characterization across Agricultural Regions of China Using Standardized Precipitation and Vegetation Water Supply Indices. Journal of Cleaner Production, 313(September), 127866.
- Jayawardhana, W. G., & Chathurange, V. M. (2020). Investigate the Sensitivity of the Satellite-Based Agricultural Drought Indices to Monitor the Drought Condition of Paddy and Introduction to Enhanced Multi-Temporal Drought Indices. Journal of Remote Sensing & GIS, 2(9), 1–11.
- Jiao, W., Wang, L., & McCabe, M. F. (2021). Multi-Sensor Remote Sensing for Drought Characterization: Current Status, Opportunities and a Roadmap for the Future. Remote Sensing of Environment, 256(April), 112313.
- Killough, B. (2018). Overview of the Open Data Cube Initiative. IGARSS 2018-2018 IEEE International Geoscience and Remote Sensing Symposium, 8629–8632. https://doi.org/https://doi.org/10.1109/IGARSS.2018.8517694.
- Kueppers, L. M., Conlisk, E., Castanha, C., Moyes, A. B., Germino, M. J., de Valpine, P., … Mitton, J. B. (2017). Warming and Provenance Limit Tree Recruitment across and beyond the Elevation Range of Subalpine Forest. Global Change Biology, 23(6), 2383–2395.
- Lacroix, P., Moser, F., Benvenuti, A., Piller, T., Jensen, D., Petersen, I., … Ray, N. (2019). MapX: An Open Geospatial Platform to Manage, Analyze and Visualize Data on Natural Resources and the Environment. SoftwareX, 9(January), 77–84.
- Lee, S.-J., Cho, J., Hong, S., Ha, K.-J., Lee, H., & Lee, Y.-W. (2016). On the Relationships between Satellite-Based Drought Index and Gross Primary Production in the North Korean Croplands, 2000–2012. Remote Sensing Letters, 7(8), 790–799.
- Lewis, A., Oliver, S., Lymburner, L., Evans, B., Wyborn, L., Mueller, N., Raevksi, G., Hooke, J., Woodcock, R., Sixsmith, J., Wu, W., Tan, P., Li, F., Killough, B., Minchin, S., Roberts, D., Ayers, D., Bala, B., Dwyer, J., Dekker, A., Dhu, T., Hicks, A., Ip, A., Purss, M., Richards, C., Sagar, S., Trenham, C., Wang, P., & Wang, L.-W. 2017. The Australian Geoscience Data Cube — Foundations and Lessons Learned. Remote Sensing of Environment. doi:https://doi.org/10.1016/j.rse.2017.03.015
- Li, J., & Roy, D. P. (2017). A Global Analysis of Sentinel-2A, Sentinel-2B and Landsat-8 Data Revisit Intervals and Implications for Terrestrial Monitoring. Remote Sensing, 9(9), 902.
- Magno, R., De Filippis, T., Di Giuseppe, D., Pasqui, M., Rocchi, L., & Gozzini, B. (2018). Semi-Automatic Operational Service for Drought Monitoring and Forecasting in the Tuscany Region. Geosciences, 8(2), 49.
- Mann, H. B. (1945). Nonparametric Tests Against Trend. Econometrica, 13(3), 245–259.
- Marusig, D., Petruzzellis, F., Tomasella, M., Napolitano, R., Altobelli, A., & Nardini, A. (2020). Correlation of Field-Measured and Remotely Sensed Plant Water Status as a Tool to Monitor the Risk of Drought-Induced Forest Decline. Forests, 11(1), 77.
- Meroni, M., Fasbender, D., Rembold, F., Atzberger, C., & Klisch, A. (2019). Near Real-Time Vegetation Anomaly Detection with MODIS NDVI: Timeliness vs. Accuracy and Effect of Anomaly Computation Options. Remote Sensing of Environment, 221(February), 508–521.
- MeteoSwiss. (2016a). Monthly and Yearly Mean Temperature: TabsM and TabsY. Author. https://www.meteoswiss.admin.ch/content/dam/meteoswiss/de/service-und-publikationen/produkt/raeumliche-daten-temperatur/doc/ProdDoc_TabsM.pdf
- MeteoSwiss. (2016b). Monthly and Yearly Precipitation: RhiresM and RhiresY. Author. https://www.meteoswiss.admin.ch/home/climate/swiss-climate-in-detail/extreme-value-analyses/high-impact-precipitation-events/14-15-november-2002/precipitation-and-temperature.html?query=rhires
- Metternicht, G., Mueller, N., & Lucas, R. (2020). Digital Earth for Sustainable Development Goals. In G. Huadong, M. F. Goodchild, & A. Annoni (Eds.), Manual of Digital Earth (pp. 443–471). Singapore: Springer. doi:https://doi.org/10.1007/978-981-32-9915-3_13
- Mooney, H., Larigauderie, A., Cesario, M., Elmquist, T., Hoegh-Guldberg, O., Lavorel, S., … Yahara, T. (2009). Biodiversity, Climate Change, and Ecosystem Services. Current Opinion in Environmental Sustainability, 1(1), 46–54.
- Nazarova, T., Martin, P., & Giuliani, G. (2020). Monitoring Vegetation Change in the Presence of High Cloud Cover with Sentinel-2 in a Lowland Tropical Forest Region in Brazil. Remote Sensing, 12(11), 1829.
- Nolan, C., Overpeck, J. T., Allen, J. R. M., Anderson, P. M., Betancourt, J. L., Binney, H. A., Brewer, S., Bush, M. B., Chase, B. M., Cheddadi, R., Djamali M., Dodson, J., Edwards M. E., Gosling W. D., Haberle S., Hotchkiss, S. C., Huntley, B., Ivory, S. J., Kershaw, A. P., Kim, S. -H., Latorre, C., Leydet, M., Lézine, A. -M., Liu, K. -B., Liu, Y., Lozhkin, A. V., McGlone, M. S., Marchant, R. A., Momohara, A., Moreno, P. I., Müller, S., Otto-Bliesner, B. L., Shen, C., Stevenson, J., Takahara, H., Tarasov, P. E., Tipton, J., Vincens, A., Weng, C., Xu, Q., Zheng, Z., & Jackson, S. T. (2018). Past and Future Global Transformation of Terrestrial Ecosystems under Climate Change. Science, 361(6405), 920–923.
- Oveisgharan, S., Haddad, Z., Turk, J., Rodriguez, E., & Li, L. (2018). Soil Moisture and Vegetation Water Content Retrieval Using QuikSCAT Data. Remote Sensing, 10(4), 636.
- Peng, D., Zhang, B., Liu, L., Fang, H., Chen, D., Hu, Y., & Liu, L. (2012). Characteristics and drivers of global NDVI-based FPAR from 1982 to 2006. Global Biogeochemical Cycles, 26(3).
- Peng, J., Wu, C., Zhang, X., Wang, X., & Gonsamo, A. (2019). Satellite Detection of Cumulative and Lagged Effects of Drought on Autumn Leaf Senescence over the Northern Hemisphere. Global Change Biology, 25(6), 2174–2188.
- Poussin, C., Guigoz, Y., Palazzi, E., Terzago, S., Chatenoux, B., & Giuliani, G. (2019). Snow Cover Evolution in the Gran Paradiso National Park, Italian Alps, Using the Earth Observation Data Cube. Data, 4(4), 138.
- Rebetez, M. (1999). Twentieth Century Trends in Droughts in Southern Switzerland. Geophysical Research Letters, 26(6), 755–758.
- Sánchez-Ruiz, S., Piles, M., Sánchez, N., Martínez-Fernández, J., Vall-llossera, M., & Camps, A. (2014). Combining SMOS with Visible and near/Shortwave/Thermal Infrared Satellite Data for High Resolution Soil Moisture Estimates. Journal of Hydrology, Determination of Soil Moisture: Measurements and Theoretical Approaches, 516(August), 273–283.
- Scherler, M., Remund, J., & Walthert, L. (2016). Régime Hydrique Des Forêts et Accroissement de La Sécheresse. https://www.dora.lib4ri.ch/wsl/islandora/object/wsl%3A10629/.
- Schmucki, E., Marty, C., Fierz, C., Weingartner, R., & Lehning, M. (2017). Impact of Climate Change in Switzerland on Socioeconomic Snow Indices. Theoretical and Applied Climatology, 127(3–4), 875–889.
- Schuldt, B., Buras, A., Arend, M., Vitasse, Y., Beierkuhnlein, C., Damm, A., Gharun, M., Grams, T. E. E., Hauck, M., Hajek, P., Hartmann, H., Hiltbrunner, E., Hoch, G., Holloway-Phillips, M., Körner, C., Larysch, E., Lübbe, T., Nelson, D. B., Rammig, A., Rigling, A., Rose, L., Ruehr, N. K., Schumann, K., Weiser, F., Werner, C., Wohlgemuth, T., Zang, C. S., Kahmen, A. (2020). A First Assessment of the Impact of the Extreme 2018 Summer Drought on Central European Forests. Basic and Applied Ecology, 45(June), 86–103.
- Serrano, J., Shahidian, S., & Marques Da Silva, J. (2019). Evaluation of Normalized Difference Water Index as a Tool for Monitoring Pasture Seasonal and Inter-Annual Variability in a Mediterranean Agro-Silvo-Pastoral System. Water, 11(1), 62.
- Small, D., Rohner, C., Miranda, N., Rüetschi, M., & Schaepman, M. E. (2021). Wide-Area Analysis-Ready Radar Backscatter Composites. IEEE Transactions on Geoscience and Remote Sensing, 1–14. doi:https://doi.org/10.1109/TGRS.2021.3055562
- Sun, H., Zhao, X., Chen, Y., Gong, A., & Yang, J. (2013). A New Agricultural Drought Monitoring Index Combining MODIS NDWI and Day–Night Land Surface Temperatures: A Case Study in China. International Journal of Remote Sensing, 34(24), 8986–9001.
- Svoboda, M., & Fuchs, B. (2016). Handbook of Drought Indicators and Indices. Integrated Drought Management Tools and Guidelines Series 2. Geneva: World Meteorological Organization. https://www.droughtmanagement.info/literature/GWP_Handbook_of_Drought_Indicators_and_Indices_2016.pdf.
- Truckenbrodt, J., Freemantle, T., Williams, C., Jones, T., Small, D., Dubois, C., … Giuliani, G. (2019). Towards Sentinel-1 SAR Analysis-Ready Data: A Best Practices Assessment on Preparing Backscatter Data for the Cube. Data, 4(3), 93.
- Trujillo, E., Molotch, N. P., Goulden, M. L., Kelly, A. E., & Bales, R. C. (2012). Elevation-Dependent Influence of Snow Accumulation on Forest Greening. Nature Geoscience, 5(10), 705–709.
- Tucker, C. J. (1980). Remote Sensing of Leaf Water Content in the near Infrared. Remote Sensing of Environment, 10(1), 23–32.
- United Nations. (2015). Transforming Our World: The 2030 Agenda for Sustainable Development. New York. https://sustainabledevelopment.un.org/post2015/transformingourworld/publication
- United Nations Environment Programme. (2021). Making Peace with Nature: A Scientific Blueprint to Tackle the Climate, Biodiversity and Pollution Emergencies. Nairobi: UNEP.
- Van Ginkel, K. C. H., Hoekstra, A. Y., Buurman, J., & Hogeboom, R. J. (2018). Urban Water Security Dashboard: Systems Approach to Characterizing the Water Security of Cities. Journal of Water Resources Planning and Management, 144(12), 04018075.
- Vicente-Serrano, S. M., Begueria, S., Gimeno, L., Eklundh, L., Giuliani, G., Weston, D., El Kenawy, A., et al. (2012). Challenges for drought mitigation in africa: the potential use of geospatial data and drought information systems. Applied Geography, 34, 471–486.
- Vittoz, P., Cherix, D., Gonseth, Y., Lubini, V., Maggini, R., Zbinden, N., & Zumbach, S. (2013). Climate Change Impacts on Biodiversity in Switzerland: A Review. Journal for Nature Conservation, 21(3), 154–162.
- Wang, X., Fuller, D. O., da Silveira, L., O’Reilly Sternberg, L., & Miralles-Wilhelm, F. (2011). Foliar Nutrient and Water Content in Subtropical Tree Islands: A New Chemohydrodynamic Link between Satellite Vegetation Indices and Foliar Δ15N Values. Remote Sensing of Environment, 115(3), 923–930.
- West, H., Quinn, N., & Horswell, M. (2019). Remote Sensing for Drought Monitoring & Impact Assessment: Progress, Past Challenges and Future Opportunities. Remote Sensing of Environment, 232(October), 111291.
- Whitcraft, A. K., Becker-Reshef, I., Justice, C. O., Gifford, L., Kavvada, A., & Jarvis, I. (2019). No Pixel Left behind: Toward Integrating Earth Observations for Agriculture into the United Nations Sustainable Development Goals Framework. Remote Sensing of Environment, 235(December), 111470.
- WMO. (2012). Standardized Precipitation Index User Guide. Geneva, Switzerland: Author. https://public.wmo.int/en/resources/library/standardized-precipitation-index-user-guide
- Wulder, M. A., Ortlepp, S. M., White, J. C., & Maxwell, S. (2008). Evaluation of Landsat-7 SLC-off Image Products for Forest Change Detection. Canadian Journal of Remote Sensing, 34(2), 93–99.
- Yoccoz, N. G., Delestrade, A., & Loison, A. (2010). Impact of Climatic Change on Alpine Ecosystems: Inference and Prediction. Journal of Alpine Research | Revue De Géographie Alpine, 98–4(December). doi:https://doi.org/10.4000/rga.1293
- Zemp, M., Paul, F., Hoelzle, M., Haeberli, W. (2008). Glacier Fluctuations in the European Alps, 1850–2000: An Overview and Spatio-Temporal Analysis of Available Data. In Orlove, B. et al. (Eds.), Darkening Peaks: Glacier Retreat, Science, and Society (pp. 152–167). Berkeley, US: University of California Press. doi:https://doi.org/10.5167/uzh-9024
- Zhao, J., Huang, S., Huang, Q., Wang, H., Leng, G., & Fang, W. (2020). Time-Lagged Response of Vegetation Dynamics to Climatic and Teleconnection Factors. CATENA, 189(June), 104474.
- Zhou, Y., Xiao, X., Zhang, G., Wagle, P., Bajgain, R., Dong, J., Jin, C., Basara, J. B., Anderson, M. C., Hain, C., Otkin, J. A. (2017). Quantifying Agricultural Drought in Tallgrass Prairie Region in the U.S. Southern Great Plains through Analysis of a Water-Related Vegetation Index from MODIS Images. Agricultural and Forest Meteorology, 246(November), 111–122.
- Zhu, Z., Wulder, M. A., Roy, D. P., Woodcock, C. E., Hansen, M. C., Radeloff, V. C., Healey, S. P., Schaaf, C., Hostert, P., Strobl, P., Pekel, J. -F., Lymburner, L., Pahlevan, N., Scambos, T. A. (2019). Benefits of the Free and Open Landsat Data Policy. Remote Sensing of Environment, 224(April), 382–385.