
ABSTRACT
Antarctica plays an important role in research on global change, and its unique geography, ocean, climate, and environment provide an ideal place for humankind to understand Earth’s evolution. Remote sensing provides an effective means to monitor and observe large-scale processes on the continent. Synthetic aperture radar (SAR) in particular provides the capability for all-weather Earth observation. The Sentinel-1A and Sentinel-1B SAR satellites have ideal ground coverage and imaging frequency for observing Antarctica. This study developed a dataset of 69,586 Sentinel-1 EW mode satellite images of the Antarctic ice sheet from October 2014 to December 2020. The dataset was processed with the European Space Agency Sentinel Application Platform (SNAP) and a Python batch scheduling tool on the Big Earth Data Cloud Service Platform of the Chinese Academy of Sciences Big Earth Data Science Engineering Program (CASEarth). Several data processing operations were implemented to process the raw dataset, including radiometric calibration, invalid edge removal, geocoding, data re-projection to an Antarctic projection, data compression to TIFF format, and construction of image pyramids. The dataset is available at http://www.doi.org/10.11922/sciencedb.j00076.00085.
1. Introduction
Antarctica is a frozen continent with roughly 89% of all ice on Earth and less than 1% of land area not covered with ice. Antarctica is also the coldest place on Earth, with temperatures as low as −89.2°C. It is extremely dry, with wind speeds up to 248 kilometers per hour. There are also sudden drops in temperature of as much as 36°C in 12 minutes recorded on the continent. Antarctica’s center experiences 6 months of sunshine and 6 months of darkness. All these factors make it the most challenging place on Earth for field data collection and experiments (U.S. Antarctic Program Blue Ribbon Panel, Citation2012). The Antarctic region has also become prominent due to its sensitivity to global climate change, the impacts of which have been particularly evident in Antarctica, serving as important indicators for global climate change research (Guo et al., Citation2014).
Understanding global change is essential to recognize the consequences of our past actions, to design measures to mitigate previous mistakes, and to take considerate steps towards future development. These overarching policy decisions regarding global change mitigation also feed into other relevant and important contemporary issues such as sustainable development. Antarctica provides evidence and quantifiable effects of global warming, making it an important indicator to trace changes in Earth systems. The consequences of changes in Antarctica might be prolonged and detrimental as melting ice sheets in the region will result in rising sea levels. The complete disintegration of the Antarctic ice sheet would raise sea level by 58 m and inundate many of the world’s major human settlements (Fretwell et al., Citation2013), which host considerably large populations in coastal countries. The ongoing continual rise in sea water from melting Antarctic ice, apart from creating problems for coastal settlements, also results in sharp variations in sea ice affecting logistical shipping routes, and ocean and land ibiodiversity.
The natural environment of Antarctica is harsh, and climate observation data and on-site snow observation data are very scarce. Remote sensing has become an effective means of monitoring the melting of ice sheets on a large scale. Earth observation data and related innovative technologies have proven to be highly effective tools in support of scientific research in Antarctica and have been widely utilized over the past few decades, facilitating the development of global change research (Guo, Fu, & Liu, Citation2019). These technologies provide valuable large-scale, long-term, frequent, and quasi-real-time offsite data acquisition capabilities. In particular, microwave remote sensing has been in wide use in Antarctica for monitoring and other research applications. Microwave radiometers such as SMMR, SSM/I, AMSR-E, AMSR2, and FY3-WMRI all measure multi-frequency bipolar surface radiation, acquire high temporal resolution data, and obtain long-term time-series monitoring data worldwide. Microwave scatterometers such as SAAS, ESCAT, NCSAT, ASCAT, and QuickSCAT also have the capability to acquire high temporal resolution data (Liang, Guo, Zhang, Wang, et al., Citation2021; Liang, Li, & Zheng, Citation2019). The microwave spectrum is known to be sensitive to large changes in the dielectric constant resulting from melting snow and ice, and microwave remote sensing therefore provides an obvious advantage in detecting and monitoring this phenomenon over the vast cold surfaces of Antarctica. Mostly, data from microwave radiometers and scatterometers are used to derive snowmelt information over the surface of ice sheets. However, both sources have a low spatial resolution (25 km and 4.45 km, respectively) and lack the detail required for determining ice sheet surface parameters. Synthetic aperture radar (SAR), on the other hand, provides the necessary all-day, all-weather, meter-resolution observations to study surface melt over ice sheets. Compared with optical sensors, SAR is more suitable for the weather conditions of Antarctica, and compared with microwave radiation and scatterometers, it has an advantage in spatial resolution.
However, there are few studies using synthetic aperture radar (SAR) for Antarctica, and only some have focused on monitoring large areas. The Sentinel-1 SAR satellites are a key advancement in SAR technology and provide invaluable high-quality data relevant for Antarctic research. Sentinel-1 consists of the Sentinel-1A and Sentinel-1B polar-orbiting satellites, which provide all-weather, day-and-night C-band radar imagery for both land and ocean. Both satellites provide good coverage of the Antarctic continent with a swath width of 410 km and a spatial resolution of 20 m × 40 m in Extra Wide (EW) swath mode. Single polarization and dual polarization products feature an incidence angle of 18.9° to 47.0° and are commonly used in marine, ice, and polar applications (details in ). The two-satellite constellation has an effective return period of six days at the equator but a higher image acquisition frequency for Antarctica due to their polar orbits. All these features make Sentinel-1 SAR data ideal for observing Antarctica (Liang, Guo, Zhang, Cheng, et al., Citation2021).
Table 1. Attributes for EW mode on Sentinel-1.
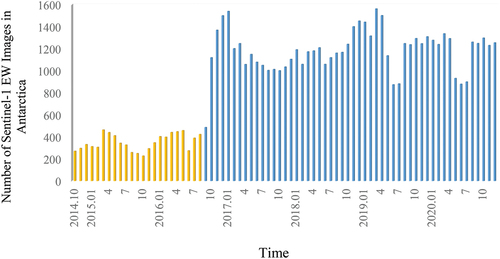
A rich volume of Sentinel-1 data is now available for the Antarctic ice sheet going back to October 2014 when it began its operational mission. The two satellites had obtained 69,586 images as of December 2020, with EW mode for the Antarctic ice sheet accumulating 12.95 TB of data. provides data acquisition totals for different months for this period. For large-scale climate change research, analysis of this long-term time series of images presents unique challenges. However, rapidly developing concepts within the domain of big data science provide new opportunities to translate complex, large datasets to information. The emerging concept of Big Earth Data provides opportunities for achieving large-scale, long-term, massive data organization and data processing (Guo, Citation2017). Big Earth Data is generally defined as big data associated with Earth science, dealing with analysis of heterogeneous, unstructured, multidimensional, and highly complex datasets as a result of the integration of multi-source, non-stationary, geo-referenced data at multiple temporal and spatial scales (Guo et al., Citation2020). Therefore, Big Earth Data concepts were found to be highly relevant to processing the huge volume of data available from the Sentinel-1 mission.
Figure 1. Monthly Sentinel-1 EW image acquisition totals for the Antarctic ice sheet.
However, there are several unique challenges in data processing and management when dealing with SAR data. First, original SAR images require several preprocessing steps such as radiation calibration, border noise removal, and geometric correction. Furthermore, SAR images are generally large and require construction of image pyramids to improve display speeds. Secondly, preprocessing and other operations on original SAR images require auxiliary information such as incidence angle and acquisition time, which are available in associated auxiliary files, therefore introducing additional data operations to manage and ensure proper access to the corresponding auxiliary file. When processing a large number of SAR images, large-scale multi-node data processing techniques require additional operations such as scheduling, which further complicates the data processing workflow. The output file needs auxiliary information, and faster data manipulation and display requires building pyramids and scheduling and checking large-scale multi-node data processing. Focusing on these challenges, this paper introduces a method for utilizing the Sentinel Application Platform (SNAP) to process Sentinel SAR images in a parallel computing environment on the Chinese Academy of Sciences Big Earth Data Science Engineering Program (CASEarth) Big Earth Data Cloud Service Platform, producing a processed dataset of Sentinel-1 EW mode images over Antarctica. The dataset includes 69,586 images, covering a period from October 2014 to December 2020. The dataset has wide applicability in climate change research, including ice sheet mass balance, ice sheet freeze-thaw analysis, ice shelf stability, basal melting driving factors, sea ice variability and trends, and applications in biodiversity, such as penguin habitats, vegetation cover, and other topics that contribute to environmental change research. The dataset is available at http://www.doi.org/10.11922/sciencedb.j00076.00085 and will be accessible in the Big Earth Data Cloud Service Platform. This will allow the dataset to be further utilized in other research and integrated with multiple datasets, data analysis, and mining services. Its potential applications and enhanced accessibility both add to the value of this dataset.
2. Methods
2.1. Data and data processing platform
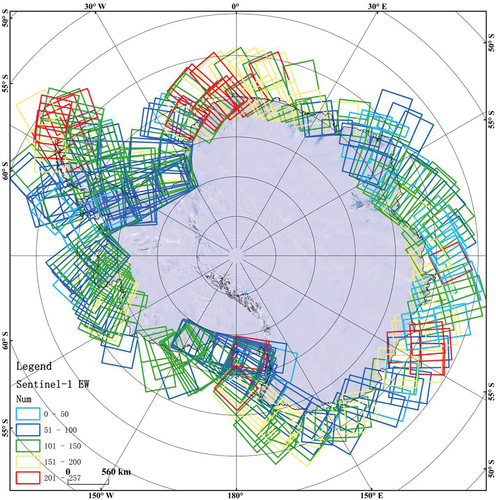
The extent of this dataset is limited to Antarctica’s coastline bounded by −56.78° North and −90° South latitude and −180° West and 180° East longitude (Gerrish et al., Citation2020). The boundaries of the continent were derived from a shapefile downloaded from the National Snow and Ice Data Center (https://cmr.earthdata.nasa.gov/search/concepts/C1219899514-SCIOPS.html), which was extracted from ortho-rectified Radarsat SAR Imagery (Liu & Jezek, Citation2004). The dataset covers an area of the continent that experiences a large number of surface melting events annually. The Ground Range Detected (GRD) original data is open-access and available to be downloaded from the European Space Agency (ESA) (https://scihub.copernicus.eu/dhus/#/home). shows the data coverage of the area by EW mode, and the polarizations include HH and HH+HV. The different color rectangles represent the different amounts of images in the dataset. According to , Sentinel-1 EW mode images basically cover the Antarctic circle, which is the most sensitive area for ice sheet surface melting and disintegration. Notably, there are more frequent data for the Antarctic Peninsula, Victoria Land, Wilkes Land, and Dronning Maud Land.
Figure 2. Coverage of Sentinel-1 data in Antarctica, revised based on Google earth.
For data analysis, the Big Earth Data Cloud Service Platform (http://portal.casearth.cn/en/index.html) was used. The platform provides comprehensive computing and analysis services, scientific data publishing and sharing, a customizable application environment, and online data analysis and mining services.
2.2. Data processing methodology
The Big Earth Data Cloud Service Platform provides two types of batch data parallel processing: cloud computing and supercomputing. Both can complete the tasks carried out in this article, but cloud computing has the advantage of giving more authority to each virtual machine, while supercomputing has more computing resources. The processing flows and methods adopted by the two types are basically the same. This article takes virtual machines as an example to introduce its cloud platform deployment, configuration, and batch data processing flow.
2.2.1. Cloud computing platform deployment and configuration
The original dataset was first downloaded and uploaded to the Big Earth Data Cloud Service Platform. The study applied 24 virtual machines to process the entire original dataset.
Each virtual machine in the distributed cloud network had a CentOS 7.0 environment installed. The SNAP toolbox was configured to preprocess Sentinel-1 data, GDAL was configured to convert image formats and construct image pyramids, and a Python scheduler was configured to automatically check that batch data processing was scheduled, monitored, and recorded, and to ensure that files were being created to facilitate big data processing and scheduling in later steps (S1: Batching algorithm). The detailed configuration of the virtual machines is shown in .
Table 2. Configuration of virtual machines.
The scheduler can be run in both the Python 2.X compilation environment and the Python 3.X compilation environment. Both have good compatibility with SNAP, GDAL, and other modules needed in this data processing. The current versions used are Python 2.7.5 and Python 3.9.0.
SNAP, which was developed jointly by the Brockmann Consult, SkyWatch, and C-S, was used for individual image processing tasks. It provides a common architecture for all Sentinel data processing toolboxes. Within SNAP, the “Sentinel-1 Toolbox” provides a wide range of tools designed for processing data, providing several functions for calibration, speckle filtering, co-registration, orthorectification, mosaicking, data conversion, polarimetry, and interferometry (https://step.esa.int/main/). SNAP is used to preprocess Sentinel-1 data.
The Geospatial Data Abstraction Library (GDAL) is an open-source raster spatial data conversion library under the X/MIT license agreement (https://gdal.org/). It uses an abstract data model to express the various file formats supported. It also has a series of command line tools for data conversion and processing. Among them, OpenGIS Simple Features Reference Implementation (OGR) is a branch of the GDAL project, and its function is similar to GDAL, except that it provides support for vector data. Many well-known Geographic Information System (GIS) products including Esri ArcGIS 9.3, Google Earth, and the cross-platform GRASS GIS use the GDAL/OGR library. The Linux-based geospatial data management system can provide support for vector and raster file data using the GDAL/OGR library. GDAL provides support for a variety of raster data, including Arc/Info ASCII Grid (asc), GeoTIFF (tiff), Erdas Imagine (img), and ASCII DEM (dem). In this research, GDAL was used to compress the GeoTIFF file after SNAP processing and generate a pyramid layer.
2.2.2. Processing flow
Parallel task scheduling software batched 24 virtual machines to process the SAR images. The data processing flow of each virtual machine is shown in .
Figure 3. Main data processing flow chart for each virtual machine.
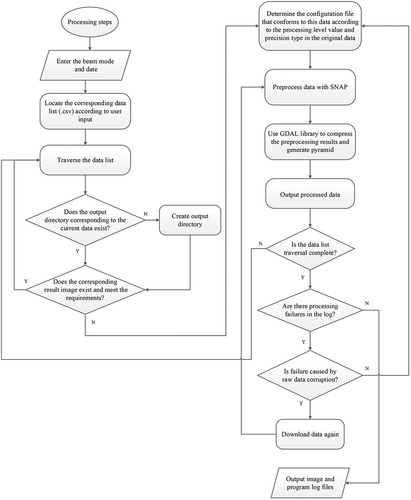
As shown in , a batch workflow was established to select relevant Sentinel-1 SAR data using the input Beam Mode (e.g. EW) and data collection period (e.g. 202,001 is January 2020). The script then navigated to the corresponding list of data (.csv) based on input and traversed the list for each of the original images. Following the discovery of relevant images, the script carried out the following sets of instructions for each of the individual images. (1) Determine the existence of a corresponding output directory and create a new directory if none previously existed. (2) Determine if the corresponding result image exists and meets the established processing requirements; if either of the two requirements are not met then the workflow continues. (3) Determine if the values of the processing level and type of precision in the original data meet this data configuration file (.xml). (4) Execute the handler and record the time and output status (processed means success, error means fail), the results of which are saved to a log and output. (5) The traversal is complete, the program is finished, and the log is checked to process the failure data. If corruption of the original data causes failure, then re-download the original data. If memory overflow or other reasons caused the failure, re-execute from the preprocessing step.
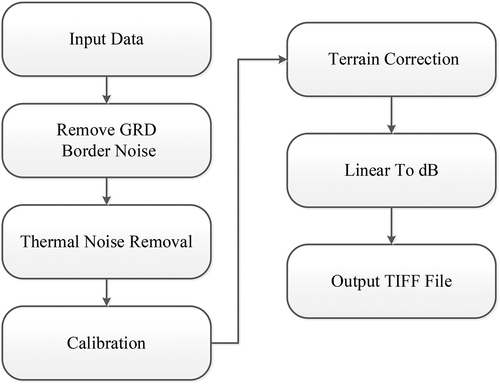
In the above process, preprocessing and pyramid building are two important steps. The preprocessing steps are shown in (S2: Data processing algorithm under SNAP). Using this workflow, each individual input image was processed as follows.
Remove GRD border noise. S1 GRD mode images have border noise usually. These “no-value” pixels are not null but contain very low values, which complicates the masking based on thresholding. This operator implements an algorithm proposed in allowing masking of the “no-value” samples efficiently with the thresholding method (Collecte Localisation Satellites, Citation2015). The threshold was set to 0.5 and the border margin limit was set to 500 pixels in this study.
Remove thermal noise. The operator will remove the thermal noise correction based on a noise look up table (LUT) for each measurement dataset.
Calibration. The objective of SAR calibration is to provide imagery in which the pixel values can be directly related to the radar backscatter of the scene. Calibrated SAR images are essential to quantitative use of SAR data. The sigma naught calibration LUT was used in this study.
Apply terrain correction. Due to topographical variations of a scene and the tilt of the satellite sensor, distances can be distorted in the SAR images. Terrain corrections are intended to compensate for these distortions. A digital elevation model (DEM) is required in this correction. SRTM images with 30 m resolution were automatically downloaded and applied here.
Convert sigma naught from linear to dB.
Save the processed image to GeoTIFF format.
Figure 4. Reprocessing flow chart for Sentinel-1 EW GRD SAR data.
The process of GDAL-based GeoTIFF image compression and pyramid construction is shown in , including compressing the image and generating a pyramid using Lempel–Ziv–Welch (LZW) compression in the GDAL library if they were not constructed during the GeoTIFF image format conversion (S3: Data processing with pyramids).
Figure 5. Flow chart of image compression and pyramid generation.
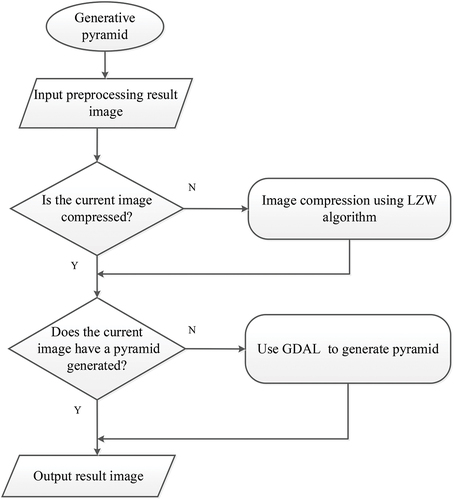
The LZW compression used in this research is a method proposed by Abraham Lempel, Jacob Ziv, and Terry Welch based on a lookup table algorithm to compress files into small files (Aldwairi, Hamzah, & Jarrah, Citation2019). LZW compression is suitable for images in TIFF, GIF, and other formats. It can effectively reduce the data size (by 60% in this article) while not reducing the quality of the images after compression. It can preserve all the information contained in the image before compression.
The statistical results after processing are shown in .
Table 3. Processing results.
3. Data records
The Sentinel-1 dataset for Antarctica produced in this study is publicly available via the website: http://www.doi.org/10.11922/sciencedb.j00076.00085. The dataset is based on Sentinel-1 HH and HH+HV SAR data during the period October 2014 to December 2020, and it can be updated in the future when new data become available.
The processed data of each scene corresponds to a record. The record parameters are shown in . In addition to the unexpected information carried by the original data, the subsequent processing stage, time, and volume are added to help later queries and updates.
Table 4. Parameter list of the processed SAR imagery.
4. Technical validation
Google Earth Engine provides relevant data for this application. To conduct the validation, this study selected several typical areas from the Antarctic Peninsula, East Antarctica, and West Antarctica to validate with Google Earth Engine products.
The comparison with Google Earth Engine is shown in , where (a) shows the selected geographic distribution for comparison, (b), (d), and (f) are the result of processing using the Big Earth Data Cloud Service Platform, and (c), (e), and (g) were obtained from Google Earth Engine. A color scale bar with the same minimum and maximum values [−25 dB, 5 dB] is used in these figures. In , the data produced by the Big Earth Data Cloud Service Platform and Google Earth Engine have the same geometric information, and their data distribution is consistent.
Figure 6. Validation of the data products.
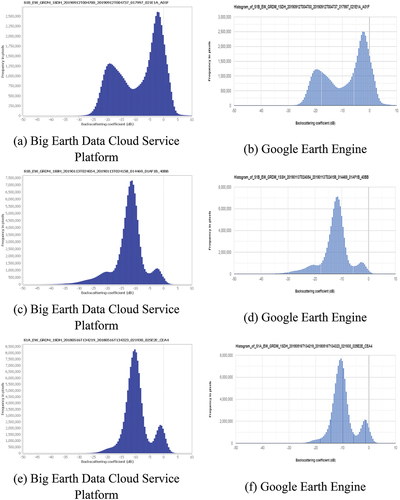
In order to quantitatively compare the data processed by the Big Earth Data Cloud Service Platform and Google Earth Engine, the histograms of three sets of images were counted. In , (a), (c), and (e) are histograms corresponding to (b), (d), and (f). (b), (d), and (f) are the histograms corresponding to (c), (e), and (g). The histogram curves of the data processed by the Big Earth Data Cloud Service Platform and Google Earth Engine are consistent, indicating that the two have the same statistical results. The difference in frequency is caused by differences in sampling intervals used by the software. The Google Earth Engine value is defined as 0.5 dB for statistics, and the ENVI value is dynamically calculated by floating parameters. Even using different software with different sampling intervals, the dB value is the same; only the frequency different.
Figure 7. Histogram comparison for the data products.
5. Usage notes
The dataset is open for all users for the purpose of research on Antarctica and can be utilized for studies of on-land snowmelt, mass balance, and ice shelf stability, among others. This dataset can be used to assess the characteristics and various impacts of global climate change at local to continental scales in Antarctica. Users can select their study area, and carry out high-resolution time-series analysis. For example, they can use the data in the high-performance cloud computing platform to extract ice sheet freeze-thaw information. It is, however, recommended to validate the dataset with the available station observations when using it for studies at a local scale. A recent study demonstrated that the dataset has the best performance in snowmelt detection over Antarctica (Liang, Guo, Zhang, Cheng, et al., Citation2021). This dataset can also be updated frequently with new Sentinel-1 data following new image acquisitions and their accessibility and availability.
Open Scholarship

This article has earned the Center for Open Science badge for Open Data. The data are openly accessible at http://www.doi.org/10.11922/sciencedb.j00076.00085.
Supplemental Material
Download MS Word (18 KB)Acknowledgments
The authors are grateful for helpful comments from many researchers and colleagues. Thanks go to Jianhui Li, Tie Niu, and Yiming Liu for feedback, as well as the editor and anonymous referees.
Disclosure statement
No potential conflict of interest was reported by the authors.
Data Availability Statement
The data that support the findings of this study are openly available in ScienceDB at http://www.doi.org/10.11922/sciencedb.j00076.00085.
Supplemental data
Supplemental data for this article can be accessed here.
Additional information
Funding
Notes on contributors
Dong Liang
Dong Liang received B.Sc. and M.Sc. degrees in applied mathematics from the University of Hull, U.K. (2006), and Mälardalen University, Sweden (2009). He is pursuing a Ph.D. in cartography and GIS at the University of Chinese Academy of Sciences, with a focus on Big Earth Data and polar remote sensing.

Huadong Guo
Huadong Guo is a Professor of the Chinese Academy of Sciences (CAS) Aerospace Information Research Institute. He specializes in remote sensing, radar for Earth observation, and Digital Earth science. Currently he is the Chief Scientist of the International Research Center of Big Data for Sustainable Development Goals and CAS Big Earth Data Science Engineering Program. He has published more than 510 papers and 24 books, and is the awardee of 18 domestic and international prizes.
Lu Zhang
Lu Zhang received a Ph.D. degree in synthetic aperture radar (SAR) remote sensing from the Chinese Academy of Sciences (CAS) Institute of Remote Sensing Application in 2008. He is an Associate Professor of the Key Laboratory of Digital Earth Science at the CAS Aerospace Information Research Institute. He was a visiting scholar at the Institute of Electronics and Telecommunications of Rennes, University of Rennes 1, France, in 2013. His research interests include SAR image processing, information extraction, physical parameter estimation models, Big Earth Data, moon-based Earth observation methods, and polar remote sensing. He is the author of more than 80 journal articles and 9 patents in these fields.

Haipeng Li
Haipeng Li received a B.Sc. degree in software engineering from Liaoning Petrochemical University in 2017. He is a software engineer, mainly engaged in software development and testing, and data and image acquisition and processing

Xuezhi Wang
Xuezhi Wang received a B.Sc. degree from Hunan Agricultural University, an M.Sc. degree from the Institute of Zoology of the Chinese Academy of Sciences, and a Ph.D. degree from the Research Center for Eco-Environmental Sciences of the Chinese Academy of Sciences in 2001, 2005, and 2009 respectively. In March 2009, he started working at the Computer Network Information Center of the Chinese Academy of Sciences. His research interests are big data analysis techniques, remote sensing processing, and big data platform development.
References
- Aldwairi, M., Hamzah, A. Y., & Jarrah, M. (2019). MultiPLZW: A novel multiple pattern matching search in LZW-compressed data. Computer Communications, 145, 126–136.
- Fretwell, P., Pritchard, H. D., Vaughan, D. G., Bamber, J. L., Barrand, N. E., Bell, R., … Zirizzotti, A. (2013). Bedmap2: Improved ice bed, surface and thickness datasets for Antarctica. The Cryosphere, 7(1), 375–393.
- Gerrish, L., Fretwell, P., & Cooper, P. (2020). Medium resolution vector polygons of the Antarctic coastline (7.3) [Data set]. UK Polar Data Centre, Natural Environment Research Council, UK Research & Innovation. https://doi.org/10.5285/ed0a7b70-5adc-4c1e-8d8a-0bb5ee659d18
- Guo, H. (2017). Big Earth data: A new frontier in Earth and information sciences. Big Earth Data, 1(1–2), 4–20.
- Guo, H., Fu, W., Li, X., Chen, P., Liu, G., Li, Z., … Liu, Q. (2014). Research on global change scientific satellites. Science China Earth Sciences, 57(2), 204–215.
- Guo, H., Fu, W., & Liu, G. (2019). Scientific satellite and moon-based earth observation for global change. Singapore: Springer. https://doi.org/10.1007/978-981-13-8031-0
- Guo, H., Nativi, S., Liang, D., Craglia, M., Wang, L., Schade, S., … Annoni, A. (2020). Big earth data science: An information framework for a sustainable planet. International Journal of Digital Earth, 13(7), 743–767.
- Liang, D., Guo, H., Zhang, L., Cheng, Y., Zhu, Q., & Liu, X. (2021). Time-series snowmelt detection over the Antarctic using Sentinel-1 SAR images on Google earth engine. Remote Sensing of Environment, 256, 112318.
- Liang, D., Guo, H., Zhang, L., Wang, M., Wang, L., Liang, L., & Shirazi, Z. (2021). Analyzing Antarctic ice sheet snowmelt with dynamic Big earth data. International Journal of Digital Earth, 14(1), 88–105.
- Liang, L., Li, X., & Zheng, F. (2019). Spatio-temporal analysis of ice sheet snowmelt in Antarctica and greenland using microwave radiometer data. Remote Sensing, 11(16), 16.
- Liu, H., & Jezek, K. C. (2004). A complete high-resolution coastline of Antarctica extracted from orthorectified radarsat SAR imagery. Photogrammetric Engineering and Remote Sensing, 70(5), 605–616.
- Satellites, C. L. (2015). Masking “No-value” pixels on GRD products generated by the Sentinel-1 ESA IPF. https://sentinel.esa.int/documents/247904/2142675/Sentinel-1-masking-no-value-pixels-grd-products-note.pdf/32f11e6f-68b1-4f0a-869b-8d09f80e6788?t=1518545526000
- U.S. Antarctic Program Blue Ribbon Panel. (2012). More and better science in Antarctica through increased logistical effectiveness. National Science Foundation. https://www.nsf.gov/geo/opp/usap_special_review/usap_brp/rpt/antarctica_07232012.pdf