
ABSTRACT
With the continuous development of various types of fixed marine observation equipment, satellite remote sensing technology and computer simulation technology, modern marine scientific research has entered the era of big data. Interactive ocean visualization has become ubiquitous owing to the use of ocean data in studies of marine disasters, global climate change and fisheries. However, the primary challenge in analyzing large amounts of ocean data originates from the complexity of the data themselves. Therefore, an interactive multi-scale, multivariate visualization system with dynamic expansion potential is needed for analyzing larger volumes of ocean data. In this study, a unified visual data service was constructed, and a component-based interactive visualization structure for multi-dimensional, spatiotemporal ocean data is presented in this paper. Based on this structure, users can easily customize the system to visualize other types of scientific data.
1. Introduction
Ocean big data are complex and diverse. The integrated analysis of these multiple types of data can be used to describe various dynamic physical, chemical, biological and other processes that take place in the ocean. As a result of advances in various observation technologies, the era of big data has arrived, and extensive, continuous, multi-source, three-dimensional observations have led to the amount of ocean data reaching the Exabyte (EB) level (Guidi et al., Citation2020). In addition, the rapid development of computer simulation technology has led to enormous growth in various ocean data types that are highly accurate and exhibit dynamic changes in time and space. However, the highly heterogeneous nature of ocean data together with the huge data volume and strong spatiotemporal correlations that are present pose challenges for the automated mining and analysis of these data as well as for traditional visual representation methods. Interactive visual analysis can effectively integrate user knowledge with computer algorithms and allow users to explore, analyze and evaluate different types of ocean data in multiple ways. As a result, users gain insight into the inner workings of the data (Thomas & Cook, Citation2006), thus contributing to a better understanding of complex ocean dynamic processes (Andrienko & Andrienko, Citation2013). In addition, the construction of interactive visualization and analysis methods based on ocean big data and the development of oceanography-specific visualization and analysis models are conducive to the rapid identification of ocean phenomena and problem-solving.
Marine data analysis is typically performed using the following four main methods (Xie, Li, Wang, & Dong, Citation2019): 1) data representation and visual analysis of multi-element marine environments (Liu, Chen, Yao, Tian, & Liu, Citation2017), 2) identification and tracking of ocean phenomena (Franz, Roscher, Milioto, Wenzel, & Kusche, Citation2018), 3) pattern or feature discovery (Sacha et al., Citation2017) and 4) uncertainty exploration and cognition (Kappe, Böttinger, & Leitte, Citation2019). Unfortunately, most types of visual analytics software or systems encounter difficulties when attempting to visualize the fusion of data from multiple sources because of the specific demands of different oceanographic domains.
Marine interactive analysis has become a powerful tool for analyzing and modeling marine data and has produced satisfactory results (Li, Jaroszynski, Pearse, Orf, & Clyne, Citation2019; Rautenhaus, Kern, Schäfler, & Westermann, Citation2015). Providing users with the most widely applicable analytical tool based on interaction and improving the efficiency of analysis are the goals behind the development of component-based visualization platforms. Therefore, in this paper, we develop the concept of an interactive analysis platform using a component-based approach; each analytical tool is embedded in the platform as a component. Each component can be executed independently or as any combination of the components, and different components can be used to solve different problems (https://casearthocean.qdio.ac.cn/oceanVisual_latest/).
In the remainder of this paper, we first describe the platform architecture and explain the function of each part. Following this, we introduce different methods of storing and processing ocean data. Next, based on the use of existing data sources, we describe the construction of ocean visualization functional components, the production of an interactive, multifaceted, multi-scale ocean visualization tool pool, and the development of visualization application services that are designed for use in marine environmental protection and marine scientific discovery. Finally, we describe the construction of applications of the platform based on two particular cases.
2. Architecture of the visualization framework
shows the basic structure of the visualization framework, which is divided into five layers: a data source layer, a data-processing layer, a visual data layer, a visual component layer and a visual application layer. Compared with traditional visualization frameworks, a visual data layer has been added between the front and back ends; this provides unified data services for the different visual components. In the visual data layer, the data are convered and encoded after cleaning, quality control, and standardization by the data service layer based on the data type. We constructed the service interface of the Restful API architecture based on open source tools such as GeoServer, MinIO and Thredds. Restful API provides user interface with the component library for the visual component layer; this allows rapid retrieval and application of data. Commonly used analysis methods are combined in an orderly manner in the visual component layer to form an independent visual ocean component.
Figure 1. The architecture of the visualization framework. The numbers in brackets refer to the sections where the components are introduced in detail.
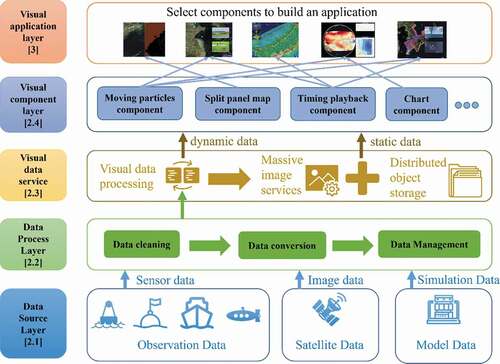
2.1. Data source layer
Currently, the data included in the visualization framework include ocean observation data, satellite remote sensor data and the results of model calculations ().
Figure 2. The ocean science data included in our system included ocean observation data (from buoys, ship surveys etc.), satellite data (acquired by MODIS, Landsat etc.), and model data (e.g. ROMS and GLOMS data).
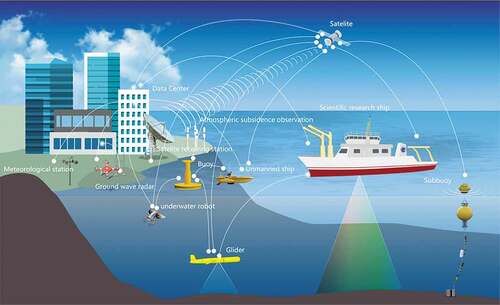
2.1.1. Ocean observation data
Ocean observation information from several main sources was integrated into our system. This included:
1) survey data from instruments and equipment on oceanographic research vessels;
2) buoy data including hydrological, meteorological and water quality data;
3) currents, temperature and salinity data acquired by submersibles. These data can be used to produce vertical profiles of a particular area.
2.1.2. Satellite remote sensing data
Satellite ocean remote sensing sensors include ocean color, infrared and microwave sensors, as well as altimeters, scatterometers, radiometers and synthetic aperture radar systems. The majority of the marine environmental monitoring data included in our system consisted of remote sensing data.
2.1.3. Model calculation data
To allow accurate prediction of marine disasters and identify oceanic phenomena, numerous complex, accurate and efficient numerical models of the ocean were integrated into our system. These included the Regional Ocean Modeling System (ROMS) (Klonaris et al., Citation2021) and Hybrid Coordinate Ocean Model (Metzger et al., Citation2020). The rapid development of GPU technology has led to artificial intelligence technology being widely used in ocean studies (Li et al., Citation2020). In our system, we integrated floodplain recognition data (Liu, Li, & Zheng, Citation2019), internal wave prediction data (Zhang, Li, & Zheng, Citation2021), temperature prediction data (Zheng, Li, Zhang, & Liu, Citation2020) and pCO2 reconstruction data based on deep learning (Wang et al., Citation2021).
2.2. Data-processing layer
The collected data cannot be directly used for data analysis or information mining. Instead, they need to be cleaned, pre-processed, and stored in a unified space to provide raw data services for other applications.
2.2.1. Data cleaning
Data cleaning first involves the removal of noise from the original data using traditional range checking, null checking, error checking and ranking. The valid data are then complemented by integrating data from different sources or by using interpolation methods to fill in missing data. We also adopted various data quality control measures from other disciplines, such as the statistical and gradient tests used in the processing of hydrological and meteorological data. For example, we applied the total and correlation tests to marine geological survey data, whereas we applied heading, speed and gradient tests to geophysical data.
2.2.2. Data conversion
Ocean data are derived from various measurement devices and computer simulations, typically with differences in structure and resolution between the types of data. Therefore, it is necessary to convert data into a uniform format to establish metadata indexing services based on multiple data types and convert physical data to computer-friendly data types before services for different applications can be provided. For example, we convered data acquired by temperature–depth instruments and ship-based acoustic Doppler current profilers into CSV format files. Similarly, for the output, we used NetCDF files as the unified format.
2.2.3. Data management
After the data conversion was completed, the data were divided into structured and unstructured types according to their characteristics. Structured data, such as data from ship-based surveys, buoys and submersible markers, and other real-time or delayed fixed-point observation data, exhibit a high degree of correlation between voyages, stations and survey times. Therefore, their structures and formats are already determined. Metadata can be created automatically based on these data, and such data are typically stored in relational databases. However, in the case of shipboard experimental data, owing to the uncertainty in the survey results, the data are generally stored in NoSQL databases to facilitate dynamic expansion (Han, Le, & Du, Citation2011). Unstructured data such as pictures, audio and video, satellite remote sensing data and model results are indexed by establishing a distributed file storage system.
2.3. Visual data serviece layer
Before performing an analysis of ocean data, it is essential to first understand the data. We therefore added a visual data layer, which provides a unified data interface for visual application layer, to the traditional data-management process. The addition of this layer means that users will not notice any effects due to the heterogeneity of different types of data when working with very large volumes of data.
Because of the multi-dimensional characteristics of ocean data and the strong spatiotemporal dynamics associated with them, we selected the Cesium map engine as the spatial display platform. This engine supports 2D, 2.5D, and 3D map extensions and time-based dynamic displays (Fu, Luan, Cai, Li, & Zhao, Citation2020). However, the data sources that this map engine can identify are limited. In order to make the system compatible with more types of data, we added a visualization data service layer between the visual component layer and the data-processing layer. This layer provides different types of data as a unified data interface service, and the visualization layer builds applications through the data interface so as to achieve a smooth transition from raw data to visual data.
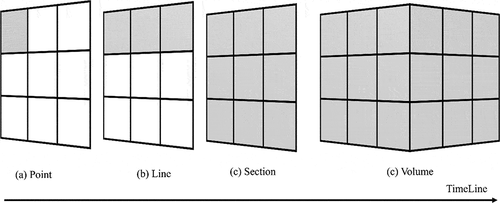
Given the requirement for the application service to provide unified spatial data for the visualization application layer, the visualization data service layer performs three services, it supports the basic data types of point, line, section and volume, which change dynamically over time ().
Figure 3. Spatial data classification including (a) point data, (b) line data, (c) section data and (d) volume data. The horizontal line denotes the timeline and is representative of dynamic data changes over time.
2.3.1. Multi-source data processing and conversion
The format of the data in the data management platform satisfies the data retrieval and download requirements; however, to achieve fast application of the data, we unified the format of the multi-source ocean data used for this service and standardized the structural, configuration and user interface data to the JSON format. For raster data, we unified the data format using coordinate system correction and layer rendering. For vector data, automated conversion to the GeoJSON format was applied; unified data conversion was also applied to the standard ocean model results. Each tool service completes the corresponding transformation using different encoding request formats, sends messageto different data service terminals according to the application requirements and renders it to the map engine through the data control terminals in the application layer.
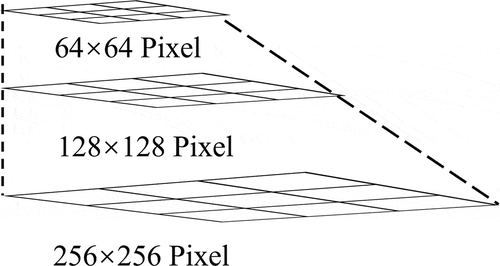
2.3.2. Massive image data services
We adopted the multi-resolution image pyramid hierarchy model () to achieve real-time display of massive image data and fast access to multi-scale information. This model collects series of images with fine to coarse resolutions generated according to specific rules. The image pyramid technique creates several image layers with different resolutions using image resampling methods. Each layer is split and stored by a corresponding spatial indexing mechanism, which improves the display speed when zooming through the images. As shown in , the bottom of the image pyramid has the highest image resolution (256 × 256 pixels), and the resolution becomes lower toward the top of the pyramid. The resolution of the middle layer is 128 × 128 pixels; the top has the lowest resolution (64 × 64 pixels). Thus, the image pyramid consists of three layers corresponding to three levels of resolution, allowing image data to be explored from coarse to fine resolution and from whole images to the local scale.
Figure 4. Similar pyramid image service structure.
We used the open-source GeoServer (GeoServer, Citation2021) to slice the original data and provide them as a service; appropriate professional parameter settings were used for this. In our system, automated display image data is implemented using the GeoServer API interface. Users can upload TIFF files in the background to access the pyramid service link for the image, thus ensuring that the data can be directly accessed when the visual component is used to build the application.
2.3.3. Distributed object storage
The system was designed so that the different files – including vector data, raster data, pictures, videos and gene data – are organized and coded in a uniform way based on the user’s usage habits. lists the encoding methods used for several common data types. The encoded data are stored using the MinIO (MinIO, Citationn.d.) object storage service. Data service links are created according to the coding rules to provide a unified RESTful interface service (Pautasso, Citation2014) for the visualization component layer.
Table 1. Data encoding format.
2.4. Visual component layer
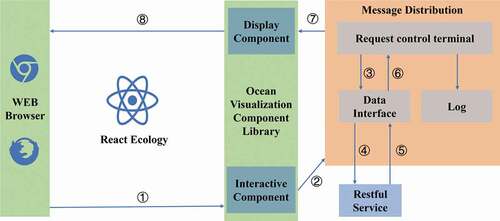
Oceanographic problems typically involve multidisciplinary analysis of data. Thus, different approaches are needed to deal with the relevant issues. When designing the visualization system, we therefore considered oceanographic problems to be made up of separate problems that needed to be analyzed and designed appropriate visualization components for each problem. We established a component analysis library for marine characteristics based on ecosystem responses to provide rapid analysis and decision making. shows the basic arrangement of the interative component and display component
Figure 5. Basic interactions between interative component and display component. The user initiates the request using the browser (①); this is then transmitted to the control terminal by the interactive component (②). The control terminal searches the data according to the requested content and returns it (③, ④, ⑤, and ⑥) . After the data have been obtained, the control terminal renders the data to the document object model through the visual component (⑦) and finally returns the result to the user (⑧).
2.4.1. Moving particle component
We used the moving particle method for vector data such as wind, ocean current and wave data (). Compared with the traditional arrow symbols, the moving particle method can intuitively express the laws of motion that apply to wind, currents and waves. The process of building the dynamic particles on a Cesium engine can be divided into five steps.
Figure 6. Moving particle component: part (a) displays the effect of ocean currents; part (b) relates to the interactive control components of moving particles (http://casearthocean.qdio.ac.cn/oceanVisual_latest/#Current).
(1) Based on CANVAS (Fulton & Fulton, Citation2013) technology, a high-resolution grid is constructed according to the boundaries of the study area.
(2) Randomly moving particles are drawn in each grid cell.
(3) For each particle, the direction of movement is determined according to the horizontal and vertical components of the wind, ocean currents and waves in the grid cell.
(4) Some particles are reset to their original random positions. This makes sure that areas the moving particles pass never become fully empty.
(5) The continuous motion of particles is simulated by the fading in and fading out of different particles. In addition, corresponding interactive components are constructed which can be used to modify the moving particlesrelative speed, color and density of the moving particles. After the user initiates an application request using the browser, the interactive components communicate with the background through the control terminal and transmit the information to the moving particle component. After the data have been loaded, the interactive component can directly perform interactive operations on the style and movement mode of the moving particle component.
3. Visual application layer
The United Nations has announced outlines to guide and support the development of marine science over the next decade (2021–2030). In addition, the ocean is a significant theme of the United Nations Sustainable Development Goals (SDGs). Achieving unified data management and building a component-based visualization system, can help with the understanding of scientific issues such as climate prediction, biogeochemistry and ocean–atmosphere physical coupling using various analytical tools. As part of our system, we developed reusable components that can be applied to individual scientific problems. This will allow the rapid construction of visual analysis tools that can support the realization of the SDGs. Using the system that was developed, we built an early warning and forecasting system for coastal dikes in Fujian as well as an integrated system for marine ranching. These systems can aid disaster prevention and mitigation and the sustainable management of fisheries.
3.1. Early warning and forecasting system for Fujian coastal dikes
China is one of the countries most seriously affected by marine disasters. With the rapid development of the marine economy, the risk of maritime disasters in coastal areas has become increasingly prominent, posing a severe challenge to marine disaster prevention and mitigation. According to the China Marine Disaster Bulletin released in April 2021, storm surges are the most destructive type of marine disaster causing 97% of the total economic losses directly attributable to marine disasters. Therefore, it is crucial to strengthen research on typhoon storm surges and improve forecasting accuracy to aid disaster prevention and mitigation. shows the operating process of our early warning and forecasting system for coastal dikes in Fujian province. First, a check is made to see whether the typhoon center location exceeds the 48-hour warning line(as in the yellow dash line). Assuming that the storm-surge and wave-forecasting models have been activated to generate forecast data, the warning information and typhoon information are directly stored in the MangoDB database and published as JSON-format data by the visual data layer. After being processed by the data-processing layer, the data are stored in the object storage system to provide services via the RESTful application programming interface, and the interface services can be called on-demand using appropriate components to create a decision-support system.
Figure 7. Operating process of the early warning and forecasting system for coastal dikes in Fujian.
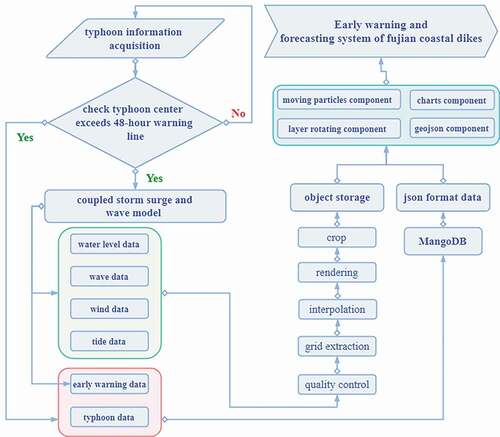
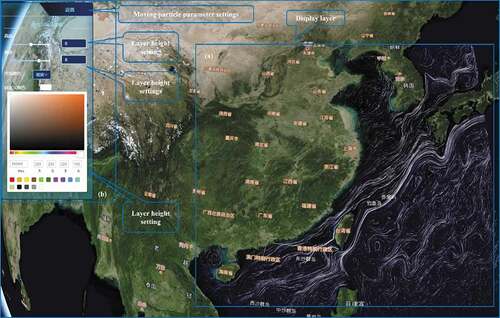
Figure 8. Use of the marine component library to build a service application: an early warning and forecasting system for coastal dikes in Fujian: (a) UI component, (b) chart component, (c) moving particle component, (d) rotating layers component, (e) 3D graphics component, (f) table component and (g) GeoJSON line component. (http://casearthocean.qdio.ac.cn/oceanVisual_latest/#RealTimeCurrent).
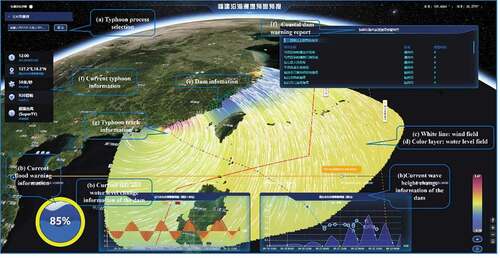
In this forecasting system, we used coupled storm-surge and wave models with unstructured grids; these models have high nearshore resolution and improve the portrayal of complex topography and physical mechanisms (Feng, Li, Yin, Yang, & Yang, Citation2018a). In addition, the joint operations from data calculation to storage and display are fully automated. Decision support is supplied by the component-based visualization platform. We thus established an improved database for the collaborative analysis of disaster big data. In terms of data presentation, the temporal and spatial fields of the model data are interlinked through the integration of multiple visualization components (e.g. moving particles, charts, rotating layers and GeoJSON components). The result is that these components cooperate to visually display the path, size and intensity of a typhoon. Moreover, the rise in water level, the distribution of the wind field and the distribution of the wave field are integrated to predict the development of the storm surge andto provide warnings to the dikes, thus providing decision support for government agencies and related users ().
3.2. Integrated monitoring system for marine ranches
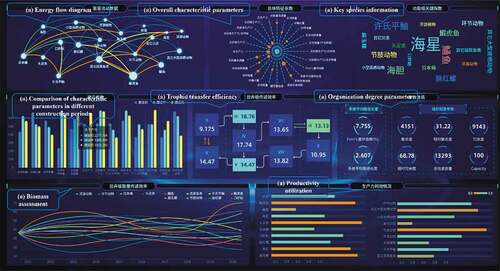
The marine ranching environment represents the primary conditions required for the survival and development of marine organisms. Real-time environmental monitoring of marine ranches can provide information that can be applied to the environmental protection and sustainable development of marine ranches. shows the operating process of our marine ranch information system. In this system, we integrated information such as ship data, meteorological data, water quality data, hydrological data, and video using chart components to achieve real-time monitoring of marine ranches and ensure the stable operation of these ranches (). Monitoring data were used to construct a biological carrying capacity assessment model (Feng et al., Citation2018b). We then used visual components and model results to build applications of this model and made predictions of biomass changes for major resource organisms using these applications. Based on the results, we then developed harvesting strategies and guidance that could be applied to the healthy development of marine rangeland ecosystems ().
Figure 9. The operating process of the marine ranch information system. Monitoring data are stored in the MangoDB database after quality control and data conversion, and model data are directly stored in the database. The panel layout components, chart components, GeoJSON components, and streaming components obtain data and then combine these to form a marine ranch information system.
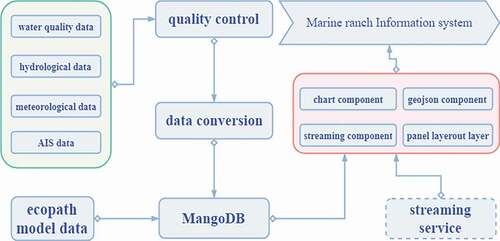
Figure 10. The use of a marine components library to construct a marine ranch environmental information monitoring system: (a) table component, (b) chart component, (c) streaming component and (d) GeoJSON point component. (http://casearthocean.qdio.ac.cn/oceanVisual_latest/#OceanRanch).
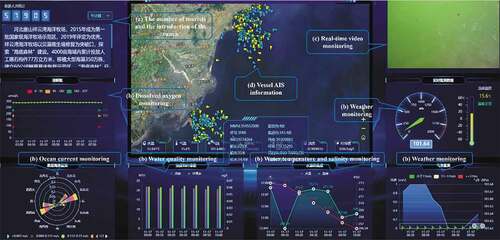
Figure 11. The use of a marine components library to build a marine ranch decision-support information system: (a) Chart component.
4. Discussion
The applications described above demonstrate how building component-based visualization applications can quickly facilitate multiple combinations of visualization methods and interactions between different types of data. This technology can effectively be used to display multi-variable, multi-dimensional ocean datasets in a browser. The complex and time-consuming tasks of data-processing and conversion, as well as other tasks such as data organization, image data service publishing and grid data service publishing, are performed in advance at the back end. The front end needs only to combine the different components according to the application requirements and access the data. The development of interactive visualization technology is difficult and requires a significant amount of programming; in addition, many factors must be considered when displaying large-capacity, high-dimensional data in a network environment.
In contrast, our system is based on the Cesium and React frameworks, and the basic ocean visualization application library contains many visualization components and provides users with development interfaces. Users can create visualization functions and development specifications according to their requirements and add these to the component library to achieve compatibility with and the visualization of different types of data. Users can also choose different components for publishing and constructing their application system.
Compared with ODV and Vapor, our system has the following advantages. 1) Browser–server hierarchical architecture is adopted; thus, service providers host software applications, and users can access browsers without installing any software or plug-ins. 2) The software is not specific to certain types of data. For example, ODV’s primary function is the visual display of voyage survey data, and it cannot integrate marine data from different data sources. In contrast, our system provides online data-publishing functions and visual component combination functions. In this way, the fusion of data from multiple sources can be achieved. 3) Users are provided with a programming interface in the visualization layer. The user uploads the data through the background to obtain the data link. The user then selects the component function according to the application and inputs the data link and parameters (time range, spatial range, frequency, etc.) according to the function requirements; finally the user combines multiple components to form an application service. In addition, the proposed visualization framework can easily be extended and applied to other ocean visualization data, thus reducing development costs.
Despite these achievements, our visualization framework has certain limitations. A unified data service is used to improve data compatibility. When dealing with time-sensitive applications, the results cannot be presented quickly. For example, the triangular grid data calculated by the storm surge model needs to be converted before it can be used by the visualization layer. However, a typhoon forecast is time-sensitive; this means that it is necessary to further improve the data compatibility of the visualization layer to achieve faster display. Another problem is that in order to be able to display greater amounts of marine data, a large number of users is needed to participate in the development of the system. This will include the development of component libraries and the visualization of marine data. In addition, to be able to combine modules, our system currently requires users to be able to program.
Our next step will be to address these limitations. First, we intend to include more applications such as recognition of Enteromorpha, sea ice and eddy based on artificial intelligence, El Niño Southern Oscillation forcasting and global ocean temperature changes . Second, we will continue to expand the ocean component library and plan to develop an interactive front-end system for combining components. Users will be able to create custom visual application displays by using drag-and-drop operations. Finally we will build an interactive visual analysis platform for application to oceanography.
5. Conclusions
Because of the complexity of ocean data and of the ocean itself, a single tool cannot meet all the requirements of ocean data analysis. Current visualization and analysis systems face challenges in dealing with high volumes of data from multiple sources and with the strong spatiotemporal correlation within ocean datasets. These challenges include the display and storage of multi-resolution big data, the scalability of display systems and the fast visualization of ocean applications. In this study, we first built a unified data resource service system for multi-source heterogeneous ocean data. Second, we set up a task-oriented system to develop ocean visualization components for different applications in response to the characteristics of ocean data and realized a modular combination of component libraries. Third, we adopted various interactive analysis schemes that could be applied to different ocean problems. These schemes allow component reuse and enhance the ability to solve ocean problems by providing decision support and will thus contribute to the realization of the United Nation SDGs.
Disclosure statement
No potential conflict of interest was reported by the author(s).
Data availability statement
The data that support the findings of this study :
1.Typhoon path data: http://english.casodc.com/data/metadata-special-detail?id=1422760211214520321
2.Ocean current data: http://159.226.158.60/current/ydz.php
3.Storm surge data: http://casearthocean.qdio.ac.cn/oceanStorm/#RealTimeCurrent
Additional information
Funding
Notes on contributors

Yanjun Wang
Yanjun Wang received his B.S. degree in computer science and technology from the PLA Artillery College, Hefei, China in 2010 and his master’s degree in computer system structure from the Harbin University of Science and Technology, Harbin, China in 2013.
Since 2013, he has been an engineer at the Marine Science Data Center of the Institute of Oceanology, Chinese Academy of Sciences, Qingdao, China. His current research interests include ocean data visualization, big data analysis and artificial intelligence applications.

Fuchao Li
Fuchao Li is a professor at the Institute of Oceanology, Chinese Academy of Sciences. He is engaged in genomics-based research on marine microbial communities, and in research on the functions and diversity of these communities.
In recent years, Professor Li has organized the construction of the Oceanographic Data Center at the Institute of Oceanology, Chinese Academy of Sciences. This center integrates marine data resources and provides a comprehensive platform for the application of marine scientific data in multiple fields, including marine disaster prevention and mitigation, marine economic development and marine scientific research.

Bin Zhang
Bin Zhang received his B.S. degree in marine technology (ocean remote sensing and data processing) from Tianjin University of Science and Technology, Tianjin, China in 2009 and his Ph.D. in marine geology from the Ocean University of China, Qingdao, China in 2015.
From 2015 to 2017, he was a postdoctoral researcher at the Institute of Oceanology, Chinese Academy of Sciences, Qingdao, China. He was an engineer at this institute from 2017–2019 and has been senior engineer since 2019. His current research interests include ocean data quality control, big data analysis and mining, and artificial intelligence applications.

Xiaofeng Li
Xiaofeng Li received his B.S. degree in optical engineering from Zhejiang University, Hangzhou, China in 1985, the degree of M.S. in physical oceanography from the First Institute of Oceanography, Qingdao, China in 1992 and his Ph.D. in physical oceanography from North Carolina State University, Raleigh, NC, USA in 1997.
Dr. Li worked at the National Environmental Satellite, Data, and Information Service, National Ocean and Atmospheric Administration, USA, from 1997 to 2019. His research interests include synthetic aperture radar (SAR) applications in oceanography and marine meteorology, artificial intelligence oceanography, big data and satellite image processing.
Dr Li is an associate editor of the IEEE Transactions on Geoscience and Remote Sensing and the International Journal of Remote Sensing. He is a member of the editorial boards of the International Journal of Digital Earth, Big Earth Data and the Journal of Oceanology and Limnology. He is also the executive editor-in-chief of the Journal of Remote Sensing (a Science Partner Journal).
References
- Andrienko, N., & Andrienko, G. (2013). A visual analytics framework for spatio-temporal analysis and modelling. Data Mining and Knowledge Discovery, 27(1), 55–83.
- Feng, J., Tian, X.-L., Dong, S.-L., He, R.-P., Zhang, K., Zhang, D.-X., Li, L., Zhang, Q.-Q., & Zhang, T. (2018b). Comparative analysis of the energy fluxes and trophic structure of polyculture ecosystems of Portunus trituberculatus based on Ecopath model. Aquaculture, 496, 185–196.
- Feng, X., Li, M., Yin, B., Yang, D., & Yang, H. (2018a). Study of storm surge trends in typhoon-prone coastal areas based on observations and surge-wave coupled simulations. International Journal of Applied Earth Observation and Geoinformation, 68, 272–278.
- Franz, K., Roscher, R., Milioto, A., Wenzel, S., & Kusche, J. (2018). Ocean Eddy Identification and Tracking Using Neural Networks. IGARSS 2018—2018 IEEE International Geoscience and Remote Sensing Symposium, (pp. 6887–6890). Germany: Bonn.
- Fu, Y., Luan, G., Cai, J., Li, Y., & Zhao, F. (2020). Construction and application research of ecological evaluation platform based on Cesium. Water Supply, 21(3), 983–991.
- Fulton, S., & Fulton, J. (2013). HTML5 Canvas: Native Interactivity and Animation for the Web. O’Reilly Media, Inc. America: Sebastopol.
- GeoServer. (2021). GeoServer. Retrieved from August 10, 2021, http://geoserver.org/
- Guidi, L., Fernàndez-Guerra, A., Canchaya, C., Curry, E., Foglini, F., Irisson, J.-O., Malde, K., Marshall C. T., Obst M., Ribeiro R. P., Tjiputra J., Bakker D. C. E., Alexander B., Heymans S. J. J., Muñiz Piniella A., Kellett P., & Coopman J. (2020). Big data in marine science. Marine Board Future Science Brief Belgium: Oostende.
- Han, J., . E., . H., Le, G., & Du, J. (2011). Survey on NoSQL database. 2011 6th International Conference on Pervasive Computing and Applications (pp. 363–366). South Africa: Port Elizabeth.
- Kappe, C. P., Böttinger, M., & Leitte, H. (2019). Exploring Variability within Ensembles of Decadal Climate Predictions. IEEE Transactions on Visualization and Computer Graphics, 25(3), 1499–1512.
- Klonaris, G., Van Eeden, F., Verbeurgt, J., Troch, P., Constales, D., Poppe, H., & De Wulf, A. (2021). ROMS based hydrodynamic modelling focusing on the belgian part of the Southern North Sea. Journal of Marine Science and Engineering, 9(1), 58.
- Li, S., Jaroszynski, S., Pearse, S., Orf, L., & Clyne, J. (2019). VAPOR: A Visualization Package Tailored to Analyze Simulation Data in Earth System Science. Atmosphere, 10(9), 488.
- Li, X., Liu, B., Zheng, G., Ren, Y., Zhang, S., Liu, Y., Gao, L., Liu, Y., Zhang, B., & Wang, F. (2020). Deep-learning-based information mining from ocean remote-sensing imagery. National Science Review, 7(10), 1584–1605.
- Liu, B., Li, X., & Zheng, G. (2019). Coastal Inundation Mapping From Bitemporal and Dual-Polarization SAR Imagery Based on Deep Convolutional Neural Networks. Journal of Geophysical Research: Oceans, 124(12), 9101–9113.
- Liu, S., Chen, G., Yao, S., Tian, F., & Liu, W. (2017). A framework for interactive visual analysis of heterogeneous marine data in an integrated problem solving environment. Computers & Geosciences, 104, 20–28.
- Metzger, E. J., Hogan, P. J., Shriver, J. F., Thoppil, P. G., Douglass, E., Yu, Z., Allard, R. A., Rowley, C. D., Smedstad, O. M., Franklin, D. S., Phelps, M. W., Zamudio, L., Wallcraft, A. J., & Richman, J. R. (2020). Validation Test Report for the Global Ocean Forecast System 3.5—1/25 degree HYCOM/CICE with Tides. Washington DC: Naval Research Lab.
- MinIO, I. (n.d.). MinIO | High Performance, Kubernetes Native Object Storage. MinIO. Retrieved from August 7, 2021, https://min.io
- Pautasso, C. (2014). RESTful Web Services: Principles, Patterns, Emerging Technologies. In A. Bouguettaya, Q. Z. Sheng, & F. Daniel (Eds.), Web Services Foundations (pp. 31–51). New York: Springer.
- Rautenhaus, M., Kern, M., Schäfler, A., & Westermann, R. (2015). Three-dimensional visualization of ensemble weather forecasts – Part 1: The visualization tool Met.3D (version 1.0). Geoscientific Model Development, 8(7), 2329–2353.
- Sacha, D., Zhang, L., Sedlmair, M., Lee, J. A., Peltonen, J., Weiskopf, D., North, S. C., & Keim, D. A. (2017). Visual Interaction with Dimensionality Reduction: A Structured Literature Analysis. IEEE Transactions on Visualization and Computer Graphics, 23(1), 241–250.
- Thomas, J. J., & Cook, K. A. (2006). A visual analytics agenda. IEEE Computer Graphics and Applications, 26(1), 10–13.
- Wang, Y., Li, X., Song, J., Li, X., Zhong, G., & Zhang, B. (2021). Carbon Sinks and Variations of pCO2 in the Southern Ocean From 1998 to 2018 Based on a Deep Learning Approach. IEEE Journal of Selected Topics in Applied Earth Observations and Remote Sensing, 14, 3495–3503.
- Xie, C., Li, M., Wang, H., & Dong, J. (2019). A survey on visual analysis of ocean data. Visual Informatics, 3(3), 113–128.
- Zhang, X., Li, X., & Zheng, Q. (2021). A Machine-Learning Model for Forecasting Internal Wave Propagation in the Andaman Sea. IEEE Journal of Selected Topics in Applied Earth Observations and Remote Sensing, 14, 3095–3106.
- Zheng, G., Li, X., Zhang, R.-H., & Liu, B. (2020). Purely satellite data–driven deep learning forecast of complicated tropical instability waves. Science Advances, 6(29), 1482.