
 ?Mathematical formulae have been encoded as MathML and are displayed in this HTML version using MathJax in order to improve their display. Uncheck the box to turn MathJax off. This feature requires Javascript. Click on a formula to zoom.
ABSTRACT
Spectral data of different rocks and minerals usually show different waveforms and absorption characteristics in visible and infrared wavelengths, which allow identification of mineral species and composition. However, massive spectra of rock/mineral on earth surface were scattered across a variety of spectral libraries worldwide, exhibiting inconsistent data structures and measurement conditions. To advance the data interoperability and the data usability, we collected data and information from six shared libraries with different format and measured field specimen in laboratory to establish an integrated rock spectral library (RockSL). Both the data quality of spectral curves and the integrity of descriptive metadata are considered in the integrated RockSL to be published in GitHub open-source repository. RockSL contains not only the big spectral dataset of rocks and minerals for data service (i.e. data sharing and retrieval) and geological discrimination, but also the characteristics dataset of key parameters/metadata (e.g. particle size, mineral composition and full-band signature, etc.) for exploration of data mining and knowledge discovery. We hope that more researchers will join to improve the availability and practical value of RockSL for remote sensing community. This article introduces the database structure and data processing workflow, and demonstrates a matching service and several examples of characteristic datasets of RockSL.
1. Introduction
Spectral data is measured using spectral sensors, which record either solar or artificially provided radiation reflected from the surface of materials. Since many materials absorb radiation at specific wavelengths, it is possible to identify material species by the characteristic absorption features, which appear as troughs in a spectral curve (Kruse, Citation1994). Wavelength ranges most suitable for the discrimination of geological materials include the visible and near-infrared (VNIR, 0.3–1.1 μm), short-wavelength infrared (SWIR, 1.1–2.5 μm) and the mid infrared (MIR, 3–25 μm), while the characteristic fluorescence of hydrocarbons occurs in the ultraviolet (UV) spectral region (van der Meer et al., Citation2012). Spectral geology deals with the measurement and analysis of portions of the electromagnetic spectrum to identify spectrally distinct and physically significant features of different rock types, which can be a useful aid for remote sensing image interpretation and mineral compositions discrimination.
Geological spectral data obtained from laboratory, field, airborne and orbital sensors, together with related metadata form a spectral library, which provides compositional standards of importance to geological research programs (Kokaly et al., Citation2017). The existing spectral libraries worldwide can be divided into universal spectral libraries that emphasize on collecting spectra of various materials (e.g. rock, mineral, vegetable, soil, snow, etc.) to support data matching and land cover discrimination, and specialized spectral libraries that serve in a specific field and pay more attention to the influence of different variables (e.g. particle size, waveband, roughness, observation angle, porosity and chemical composition, etc.) on spectral characteristics (Zhang, Xiao, & Wen et al., Citation2017; Zhou & Zhou., Citation2009). In this article, we describe and integrate the representative universal libraries (e.g. USGS, JHU, ASTER, Gospel spectral library, etc.) and the geological spectral libraries covering rock/mineral specimens (e.g. JPL, ASU, Mineral Infrared Spectral Atlas, PDS spectral library, etc.), which are shown in .
Table 1. The characteristics of shared spectral libraries integrated in RockSL.
The United States Geological Survey (USGS) spectral library as a widely recognized library was assembled of spectra measured with laboratory field and airborne spectrometers, covering various natural and artificial materials. The USGS spectral library produced generic formats of the spectra and metadata in ASCII file for data dissemination and provides compositional standards of significance for research programs executed by the U.S. Geological Survey (Kokaly et al., Citation2017, Clark, Swayze, & Gallagher et al., Citation1993; Clark et al., Citation2007). Johns Hopkins University (JHU) spectral library included bidirectional (biconical) reflectance data of minerals/meteorites and directional hemispherical reflectance of rocks, which pay more attention to data quality for providing standard spectra (Meerdink, Hook, Roberts, & Abbott, Citation2019). To support the researches of Advanced Spaceborne Thermal Emission Reflection Radiometer (ASTER) providing observations in the visible and near infrared, the shortwave infrared and the thermal infrared band, the ASTER spectral library spectral library was compiled with 2400 spectra of natural and man-made materials, which were acquired by ASTER and contributed from Jet Propulsion Laboratory (JPL) spectral library, JHU library, and USGS spectral library (Baldridge, Hook, Grove, & Rivera, Citation2009). Ground object background spectral library (Gospel) was the most comprehensive spectral library in China, covering various materials (i.e. rock/mineral, vegetable, water, ice/snow and artificial target) and spectral datasets with characteristics of full-band, multi-scale, multi-angle and time series (Su, Li, Wang, & Tang, Citation2003; Zhong & Xiao et al., Citation2020). Contrast to the universal spectral library, the specialized libraries focus on the validation of the effect of physical properties, chemical compositions, measurement parameters on sample spectrum. JPL established three spectral libraries on ground-object reflectance according to three particle sizes (i.e. 125–500 nm, 45–125 nm and less than 45 nm) to reflect the influence of particle size on spectral reflectance (Grove, Hook, & Paylor, Citation1992; Kahle & Goetz, Citation1981). Mineral Infrared Spectral Atlas (MISA) was measured and established by the Chinese Academy of Science, containing VIS/SWIR/MIR data (0.3–5 μm) for deep mining of infrared information (Peng & Liu, Citation1982), while the Arizona State University (ASU) thermal infrared spectral library collected emissivity of terrestrial materials in the 8–14 μm atmospheric window to explore the function of kinetic temperature and spectral emissivity (Christensen et al., Citation2000). The Planetary Data System (PDS) was a compilation of laboratory spectra of the Earth, the Moon and some meteorites in the visible, near-infrared and mid-infrared ranges, which was submitted by various data providers (e.g. RELAB, Janice Bishop, JMUSTARD, RVMORRIS and TLROUSH Spectral Library) for providing a basic data platform for related researchers in planetary geological field (Pelkey, Mustard, & Murchie et al., Citation2007).
However, the spectra of rocks/minerals stored in different libraries exhibited inconsistent data structure and shared format. The accessible spectral libraries were organized in folder system (e.g. USGS, JPL) or relational database (e.g. SPECCHIO), which provide spectral data and associated metadata in ASCII or image format, which make it difficult for users to compare and analyze the data, resulting in low data interoperability and uneasy utilization (Xie, Zhou, & Wu, Citation2020). It’s important to noted that the spectral libraries established by diverse organizations were usually based on local spectra but not global scale. The spectral signatures of minerals obtained from shared spectral libraries, such as USGS, JPL and JHU, are sampled in American, neglecting general applicability for global research like geological (Shanshan, Kefa, Nannan, & Wang, Citation2014; Stelle, Ariza-López, & Ureña-Cámara, Citation2018; Vignesh & Kiran, Citation2020). Besides, the respective spectral libraries mentioned above organized data in different ways lacking of a common model of metadata, which made less effort on the interoperability and interpretation of ancillary data (Hueni, Nieke, Schopfer, Kneubühler, & Itten, Citation2009; Stelle et al., Citation2018). To improve mineral/rock spectral data to be FAIR (Findable, Accessible, Interoperable and Reusable) (Rybkina et al., Citation2018), we unified the data structure and provided a homogeneous framework of metadata to produce a comprehensively integrated spectral library in a global scale.
Generally, RockSL has realized globally the semantic unification and established the standardized metadata space of the rocks/minerals spectral data, which provides the data repository for global or regional geological mapping and field surveying, and characteristic datasets of key parameter (e.g. particle size, wavelength range, etc.) for spectral analysis and comparison. We hope that RockSL as an integrated spectral library can provide a unified data access for researchers with better data consistency to avoid unnecessary redundant measurement or cumbersome query work, and enriches the content of global geographic information resource service products.
2. Methods
2.1. Data sources
The shared spectral data acquired from universal and specialized libraries, and field sampling data were integrated and realized in relational database management systems (i.e. SQL Server software). The query language (SQL) allows to manipulate and query the spectral data in RockSL. The shared data was mainly downloaded from USGS, JHU, JPL, PDS, ASU spectral library and MISA, which existed as ASCII, HDF or image files (). The constituent data was distributed and stored in Chinese or English, behaving different format and related parameters (Xie et al., Citation2020). Besides, the sampling data measured in laboratory are also the important portion of RockSL, which consist of the spectral signature and related metadata (e.g. physical and chemical attribute of rock/mineral samples, measurement conditions, spatial/temporal information of sampling process). The specimens including magmatic, metamorphic, sedimentary rocks, iron and coal minerals were collected from the central and northern region in China. The processing workflow of field spectroscopy includes mineral composition analysis, sample preparation, spectral measurement and data storage. The mineral composition and content of the specimens were analyzed through thin section identification by Axioskop40 microscope. After crushing and grinding, specimens with different particle sizes were tested by SVC HR-1024i Field Spectroradiometer (0.35–2.5 μm) and 102F Fourier transform infrared (FTIR) spectroradiometer (0.4–20 μm) (Song, Liu, Yu, Mao, & Wu, Citation2017; Wang, Liu, Mao, Wang, & Tian-Zi, Citation2018). By means of data integration, RockSL provides digitized spectral data in a uniform format, as well as data in the original format downloaded from each spectral library for further research and application.
2.2. Schema of data collocation
2.2.1. Metadata of spectra collections
The reflection spectrum of rock/mineral is mainly affected by its chemical composition, mineral purity and crystal structure. In addition to intrinsic factors, spectral data is affected by many variation factors such as sample granularity, roughness, observation method and sample compositions, which were expressed as metadata of spectral data. Metadata as a central component in the quality and reliability of spectral data contains further information of the sampling environment and measurement conditions, which is important to support the explanation of scientific data and ensure long-term data usability and exchange (Michener & Brunt, Citation2009; Rasaiah, Malthus, Jones, & Bellman, Citation2012). It was verified that there has been less effort on providing a standard metadata model to facilitate spectral data interoperability. In order to improve the universality and accuracy of the metadata, we referred to the main documents from International Organization for Standardization (ISO) and Quality Assurance Framework for Earth Observation (QA4EO). The work of some peers including the general proposal endorsed by the Committee on Earth Observation Satellites (CEOS) and investigated protocols for recording metadata in field spectroscopy were identified in an international experiment (Rasaiah, Jones, Bellman, Malthus, & Hueni, Citation2015; Stelle et al., Citation2018). The metadata of a spectral resource can be categorized into four types of variables: quantitative (e.g. sampling position, measurement angle, particle size), categorical/qualitative (e.g. specimen species), alphanumeric string (e.g. specimen description) and pictorial types (e.g. the target images) (Hueni et al., Citation2009). Based on the characteristics of shared data and sampled data, we established the customized metadata spaces of RockSL (), which help users to retrieve target data quickly and analyze the intrinsic laws of spectral data. It is noted that data record was rated according to the integrity of related metadata. Data with higher integrity (i.e. higher data level) can provide a more reliable reference for users to discriminate accurately unknown objects and could be applied for deeper analysis to explore the internal relationship between parameters and data.
Table 2. The metadata variables of data model in RockSL.
2.2.2. Data structure
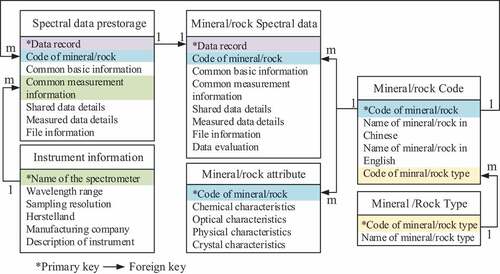
The RockSL data model used in the core and basis of database system consists of data structure, data manipulation and integrity constrain, which refers to the static characteristics (e.g. data type, content and relationship), dynamic behavior (e.g. data retrieval, modification) and constraint conditions of relational data tables. We considered the performance of data structure to reduce the data redundancy and designed appropriate constraints to ensure the consistency and correctness of data storage. Relational model is the mainstream database structure at present, which was applied to RockSL. The data structure of RockSL (shown in ) contained several relational data tables mainly used to save reference spectral data with related parameters, attribute data, classification code of rocks and minerals, and the specific information of spectrometers. The relational table of rock/mineral code as the main relational table was designed to store sematic and classification contents for data consolidation from diverse regions, and to facilitate rapid retrieval. The database structure of RockSL is in the third normal form (3NF), which contains no data redundancies (Mcfadden & Hoffer, Citation1988). Besides, the referential integrity between tables was established by the primary key and foreign key, which guarantee data consistency of the associated tables. It’s important to note that the spectral data was stored in the relational table of data pre-storage before data cleaning, transformation and assessment.
Figure 1. Data structure of the designed database schema. The relational table of mineral/rock code and mineral/rock type records the classification information. The table of mineral/rock attribute records the physical and chemical properties, while spectral data information records spectral data and related metadata. The table of instrument information records the spectrometer information. The numbers (i.e. 1 and m) represent the number of records in each table, indicating that one record in the table (e.g. code of mineral/rock type) corresponds to multiple records in another table (e.g. code of mineral/rock).
2.3. Data processing
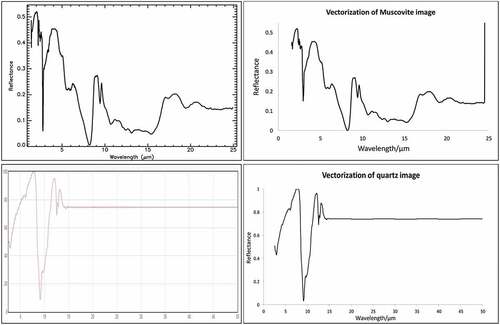
The processing workflow of RockSL including data acquisition, transformation, quality control, data storage is described in . The shared libraries distributed spectral data with varying formats (e.g. ASCII, image file, etc.). The spectral data and related metadata in ASCII format can be extracted and imported directly into RockSL. However, some spectral libraries (e.g. MISA) stored spectral data in the form of curve images instead of providing directly digital spectral curve. The thinning and non-thinning algorithms illustrated in our previous work (Xie et al., Citation2020) can effectively realize the extraction of digital curves from image files (). The methods of data acquisition make it possible to establish a more digital and consistent dataset. Before importing the spectral curves and its descriptive parameters into RockSL, the relevant information of target data in the relational tables (i.e. mineral/rock code, mineral/rock type and instrument information) of RockSL should be completed. Then the target curve of different measurement unit (e.g. reflectance, emissivity) and wavelength unit (e.g. nanometer, micrometer and wavenumber) was transformed to a unified format based on wavelength unit conversion and Kirchhoff’s thermal radiation Law (Reflectivity = 1 – Emissivity). The reflectance spectral curve with nanometer unit was used as a standard format for RockSL. The spectral data stored in the relational table of data pre-storage was screened through different methods of data quality check and assessed for metadata integrity comparing with the metadata space (). After data cleaning and evaluation explained in Section 4, the target data was imported to the final table of spectral data from the pre-storage table.
Figure 2. The processing workflow of RockSL. The sequence numbers on the left represents the corresponding data table in the spectral library, which was operated in corresponding steps.
Figure 3. The original image of the spectral curve (left panel) and its corresponding vectorized digital curve (right panel). The original images of muscovite and quartz as examples were downloaded from USGS and MISA spectral libraries, respectively (Kokaly et al., Citation2017; Peng & Liu, Citation1982).
3. Data record and application
All minerals are classified and coded based on its chemical composition and crystal structure (i.e. crystallochemical principle), which was logical and widely accepted. According to the principle, the minerals/rocks in RockSL are firstly divided into diverse parent nodes according to its dominant anion or anionic group, which includes elements, sulfides, oxides and hydroxides, halides, silicates, other oxygen-containing salt minerals, mixed mineral (e.g. igneous, sedimentary and metamorphic rock) and energy resources (e.g. coal). The parent nodes are subdivided in part based on its compositions but mainly according to intrinsic structure (e.g. the child nodes of silicates include framework, chain, ring, Island and sheet silicates). The RockSL following the classification principle mentioned above contains more than 130 rock/mineral groups, about 200 sample types and 3000 spectral data records. The main components of the RockSL are silicate (more than 1800 records), other oxygenated salts (nearly 400 records), oxides and hydroxides (more than 200 records) and rock samples (more than 200 records). The massive spectral data of RockSL covering various types and complete ancillary data provide great support to spectral matching and easy comparison for unknown rock/mineral discrimination. More types of spectral data will be collected from other available source and laboratory measurement later to improve the applicability in mineral identification. The spectral dataset of characteristics was extracted from big dataset on based the metadata selection. Generally, RockSL provided not only big dataset for data matching service, but also multiple spectral datasets of characteristics for knowledge discovery.
3.1. Matching service
Spectral matching means to compare the spectrum of unknown samples with reference spectra to identify sample category, which put emphasis on mathematical algorithms and reference spectral library. The algorithms are designed to reduce data noise and improve matching efficiency, which consist of preprocessing algorithms and spectral matching methods. Some researchers have studied various spectral preprocessing methods (e.g. spectral differentiation, continuum removal, etc.) to enhance effectively absorption valley characteristics and improve prediction accuracy of spectral matching model (van der Meer, Citation2004; Whitaker & Pigford, Citation1960). Since the RockSL contains spectra with different measurement information (i.e. spectral range and spectral resolution), it is necessary to automatically resample the reference spectrum according to the target spectral information in the matching process. The matching algorithms are executed by calculating the similarity between unknown spectrum and reference spectrum based on complete waveforms or some spectral characteristics, which includes Binary Encoding (BE), Spectral Angle Matching (SAM), Spectral Correlation Fitting (SCF), Spectral Information Divergence (SID), and so on (Goetz, Vane, Solomon, & Rock, Citation1985; Kruse et al., Citation1993; Mcglone & Shufelt, Citation1994; Noronha & Nevatia, Citation2001). It is noted that we consider also the proportion of the matching range to the target spectral range as a key point to evaluate the matching reliability.
The spectral matching service was embedded into the operating system of RockSL, which contained preprocessing methods (i.e. first-order and second-order differentiation, and continuum removal) and matching algorithms (i.e. BE, SAM, SCF, SID and SID_SA). The quartz specimen was observed by portable FTIR spectroradiometer ranging from 0.2 to 20 µm in laboratory. The sampling data in the thermal infrared band range (8–14 μm) of better quality was selected to compared with reference spectra in RockSL. We applied various preprocessing and matching algorithms to carry out matching service, and listed three reference spectrums with high matching similarity (). The customized algorithm (BC_SA_SID_SCF) calculating the total score (e.g. sum of similarity coefficients) through four matching methods (BE, SAM, SID and SCF) was applied in operating module to achieve unknown object discrimination (). The matching results demonstrate that RockSL can be used to identify accurately and effectively unknown minerals. The target spectrum has high matching similarity with the reference spectra (quartz) from different libraries (i.e. ASU and PDS spectral library) with different measurement parameters, which undoubtedly improves the reliability of recognition result.
Figure 4. The matching result of quartz sample. (a) The matching module with three reference spectrums (no. 3289, no. 3290 and no. 4440) of quartz sample from PDS Geoscience spectral library and ASU spectral library. (b) Comparison of unknown spectral curve and reference spectral curves of quartz.
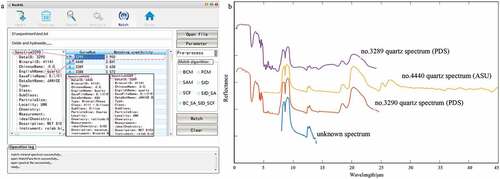
Table 3. Matching results of spectral data of quartz specimen and reference spectra in RockSL.
3.2. Spectral datasets
Spectra of minerals and rocks are affected by chemical composition, observation geometry (e.g. observed angle, distance, etc.), and surface morphology (e.g. particle size, roughness, etc.). The chemical composition of samples not only causes the change of spectral reflection intensity, band position and absorption depth, but also causes the emergence of new characteristic bands due to the generation of new ions in rocks and minerals. In addition, the reflection spectrum is also changed with external environment and surface characteristics, which manifested as the change of reflectance value, absorption width, absorption depth and the shape of spectral curve.
The affected factors mentioned above were recorded in metadata space (), which support the retrieval of target data and spectral analysis of characteristics. The RockSL of shared data and sampling data was refined to obtain data collections of characteristics by projecting metadata space to a subspace (). These characteristic datasets of minerals and related metadata can be established using Structure Query Language (SQL), which are illustrated in . Three refined datasets were selected as examples based on the key parameters (i.e. particle size, wavelength range, chemical composition), which are elaborated in detail below.
Figure 5. Visualization examples of a subspace projection in a 3D metadata cube: abstract model of establishing characteristic dataset of RockSL. The article elaborated several datasets of particle size, wavelength range and mineral component.
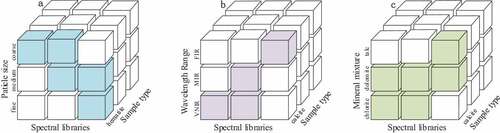
Table 4. The selection of metadata to establish the characteristic dataset.
3.2.1. Particle size
Particle size is an important variable of surface morphology affecting the spectral reflection characteristics of rocks and minerals, and the influence of particle size on the spectral characteristics depends on the type of specimen. Yang (Citation1987) found that the reflection spectrum characteristics of rock/mineral are related to surface states and some bands are more sensitive to the influence of different particle sizes. Okin and Painter (Citation2004) studied the relationship between the reflectance spectra and particle size of montmorillonite and quartz, and found that the reflectance gradually increased with the decrease of particle size in the particle size range (50–750 μm). Ma and Sheng et al. (Citation2015) proposed that the sample spectrum is less affected by particle size when the particle size is greater than 1 mm (threshold value). In the VNIR-SWIR region, the reflectivity of most rocks increases with the decrease of particle size, while the reflectivity of black (dark) rocks decreases with the size of finer particles. In thermal region, the reflectance decreases with decreasing particle size, according to the fact that the spectral contrast of fundamental molecular vibration bands appears to decrease with decreasing particle size (Salisbury & Eastes, Citation1985). Smaller particle size of the sample reduces the porosity and increases the number of particles in the field of view, which leads to the change of reflection value or absorption value. Since the relationship between particle size and spectral signature is highly dependent on rock mineral composition and spectral region, it is necessary for researchers to use comprehensive datasets to explore its universal laws.
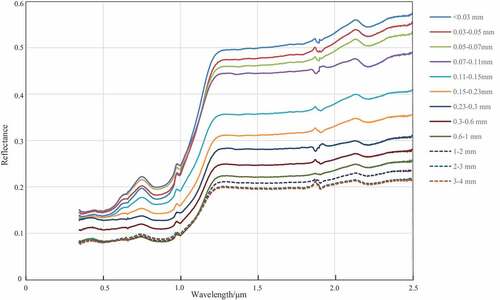
In this article, we choose the spectral data of iron mineral samples with different particle sizes in RockSL as example demonstration, which was attributed by collaborative team from Northeastern University (Wang et al., Citation2018). The comparison result shows that the effect of particle size on the reflection spectrum of hematite behaves significantly different (). The spectral reflectance decreases with the increase of particle size (ranges from 0.03 mm to 1 mm), which shows a significant negative correlation between reflectance value and particle size (Wang et al., Citation2018). When the particle size of the sample is greater than 1 mm, the influence of particle size on the reflection spectrum is much weak. Besides, the effect of particle size on different wave bands can be divided to the stable band (i.e. 350–950 nm) and sensitive band (i.e. 950–1250 nm). The reflection spectra of hematite are overlapping when the particle size of hematite sample is greater than 1 mm, which indicates the effect of particle size is significantly weakened.
Figure 6. The reflectance spectra of hematite with different particle sizes. Spectral data from NEU measured in laboratory (Wang et al., Citation2018).
3.2.2. Full bands
Different bands have different response mechanisms to the groups and ions of minerals. The visible and near-infrared (0.3–1.1 μm) band is mainly used to detect the electronic processes of some metal ions while the short-wave infrared (0.3–1.1 μm) band and the mid-thermal infrared (2.5–14 μm) region is mainly used to detect the molecular vibration of water-containing hydroxyl minerals and hydroxyl-free minerals (e.g. carbonates, silicates), respectively (van der Meer et al., Citation2012).
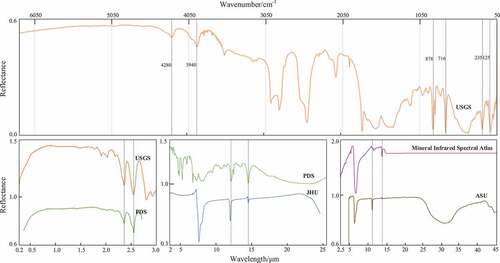
Both the universal spectral libraries and specialized spectral libraries focused on the spectral information of disparate bands and measured the sample spectra with different spectral resolution. The spectral data downloaded from the USGS spectral library was measured by different instruments, which are provided in four bands of 0.2–3.0 μm, 1.5–6.0 μm, 5–25 μm and 25–200 μm, respectively. The data stored in JPL spectral library ranges from 0.4 to 2.5 μm with spectral resolution of 1 nm (0.4–0.8 μm) and 4 nm (0.8–2.5 μm). The spectral data stored in John Hopkins University (JHU) spectral library consisted of rock spectra recorded from 2.08 to 25 μm, and mineral spectra recorded from 0.4 to 14 μm. PDS Spectral Library is a multisource contribution of several spectral library (e.g. CRISM, Janice Bishop, JMUSTARD, RVMORRIS and TLROUSH Spectral Library), in which the spectral data ranges from 0.3 to 26 μm. Arizona State University (ASU) thermal infrared spectral library acquired emissivity of terrestrial materials in the 8–14 μm atmospheric window. The MISA containing 583 images of mineral spectra ranges from 0.25 to 5.0 μm. The data measured by FTIR spectroradiometer in laboratory ranges from 0.4 to 20 μm with spectral resolution of 6 cm−1 (wavenumber). The shared data and measured data can be integrated to design approximately a full-band dataset for exploring the complete feature combination of rock and mineral spectra. The spectra of calcite extracted from the full-band dataset are shown in . The calcite as carbonate minerals with the chemical composition (CaCO3) have diagnostic absorption features of the VNIR, MIR and FIR regions because of the combinational and harmonic bands of vibrations of the bond C–O in the ion composition (Gupta, Citation2003; Hunt & Salisbury, Citation1971). The calcite spectrum indicates the presence of prominent spectral absorption features in the wavelength ranges of 2.50–2.55 µm (4000–3922 cm−1) and 2.30–2.35 µm (4348–4255 cm−1) in the VNIR (Clark et al., Citation1990; Gaffey, Citation1986), around 13.70–14.04 µm (730–712 cm−1) and 11.19–11.40 µm (894–877 cm−1) in the MIR (Lane & Christensen, Citation1997), and two strong separate absorption at around 110 cm−1 and 228 cm−1 in the FIR (Farmer, Citation1974; Legodi, Waal, & Potgieter, Citation2001).
Figure 7. The full-band spectral data of calcite mineral from diverse libraries (i.e. USGS, PDS, JHU, ASU and MISA). The curve (ranges from 1.6–200 µm/6250-50 cm−1) of USGS is displayed on the horizontal axis of wavenumber to highlight the characteristics of the far-infrared bands, while other curves are displayed on the horizontal axis of wavelength.
3.2.3. Mineral composition
Material composition is an intrinsic factor affecting rock spectrum. Mineral spectrum depends on three basic characteristics of mineral composition including chemical composition elements, the spatial geometry or structure of atoms and the strength of interatomic forces. Different mineral contents and mineral assemblages indicate a unique set of spectral features. The establishment of spectral dataset on mineral composition and content can be used to explore and verify the relationship between reflectivity, characteristic band intensity and mineral materials.
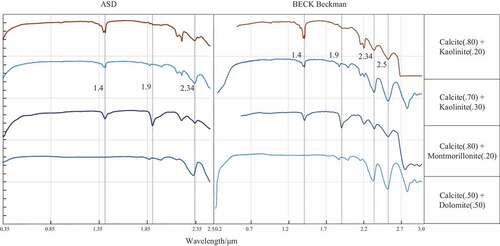
To recognize the impact of mineral content and chemical composition, the calcite specimen mixed with kaolinite, montmorillonite and dolomite is selected for example from the characteristic dataset of mineral composition (). The graph shows that mineral composition has a significant influence on the spectral characteristic spectrum segment, which is reflected in the prominent absorption peak at around 1.4 µm due to the vibration of OH- groups in silicate minerals (i.e. kaolinite, montmorillonite) relative to dolomite (CaMg(CO3)2) (Hunt & Salisbury, Citation1970). The spectrum curve of calcite-montmorillonite has a deep and wide absorption band at around 1.9 µm because of the interlayer water by comparing the spectrum curves of calcite-kaolinite and calcite-montmorillonite. In addition, the calcite-kaolinite sample with higher calcite content has wider and deeper absorption characteristics at 2.34 and 2.5 µm.
Figure 8. The spectra of calcite mineral with different mixture minerals measured by Analytical spectral devices (ASD) and Beckman instrument (downloaded from USGS Spectral library). Spectra are offset for clarity.
4. Technical validation
The process of quality control was designed for evaluating spectral data in two dimensions: data integrity and validity. Data integrity requires the completeness of metadata, and data validity measures the justifiability of the spectral signature. The methods of quality control were designed for single and multiple spectral curves, which was illustrated briefly in a previous work (Xie et al., Citation2020). The data with poor quality was eliminated beforehand, and the qualified data was imported into RockSL after data checking.
To evaluate data integrity and improve data reusability, each record in RockSL is rated referring to the metadata model (). Records lacking common basic parameter were rated as medium, and records lacking common basic parameter and measurement information were rated as low.
From the perspective of data validity, semi-automatic validation workflow was designed to evaluate data quality. The thresholds of reflectance or emissivity (i.e. 0 and 1.0) and boxplot algorithm were applied to detect outliers of single spectral curve automatically. The reliability and availability of data will be greatly reduced when the number of outliers exceeds a certain proportion, which can be evaluated through boxplot algorithm. The boxplot algorithm can display the distribution of a series of points and found the error outliers through using statistics (e.g. median and quartile). The formula of boxplot algorithm is as follows:
where = the value at 25th percentile and
= the value at 75th percentile.
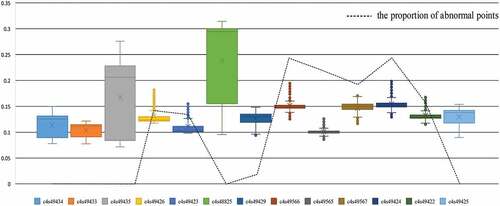
For example, the spectral dataset of hematite downloaded from RVMORRIS spectral library (Lane, Morris, Mertzman, & Christensen, Citation2002) was tested based on the boxplot algorithm to show the distribution of spectral curves (). The unqualified spectral data was deemed unavailable when the proportion of abnormal points exceeds the threshold (set to 0.4). However, due to the value of the published data, the abnormal data was evaluated again by visual observation to avoid incorrect culling of data. The semi-automatic validation workflow can ensure the quality of the integrated dataset to a certain extent.
Figure 9. The data check result of hematite samples based on boxplot algorithm.
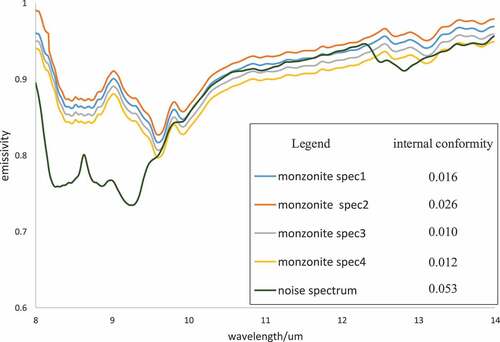
To ensure stability and accuracy of spectral sampling data, target specimen is repeatedly measured by the same spectrometer. The curves with obvious anomalies in multiple groups of similar data can be accurately identified by manual observation, which is time-consuming. The important indicators (Xie et al., Citation2020) were designed to evaluate automatically data quality of multiply similar spectral curves observed in our laboratory including (1) the accuracy of internal conformity indicating the deviation between target spectrum and average spectrum, and (2) the position offset of main absorption peak. The spectral sampling data contributed by NEU have been successfully applied to mine area monitoring and coal extraction (Mao et al., Citation2014). The formula of internal conformity is shown as
where= the observed reflectivity at the corresponding point;
= the number of repeated observations; and
= the number of curve points involved in the calculation.
Multiple similar spectra (i.e. the spectra of monzonite specimen measured by 102F FTIR) and a noise spectrum were tested to the accuracy of internal conformity ().
Figure 10. The data check result of multiple curves of monzonite sample based on internal conformity.
5. Usage notes
As stated earlier, shared data with diverse format (i.e. ASCII and image files) from several representative spectral libraries (i.e. USGS, JHU, JPL, ASU, PDS and MISA) and sampling spectra of rock/mineral were checked and collocated to construct a comprehensive spectral library with more digital and better consistent format. The spectral data was stored in a corresponding relational table in the form of row record. An integrated rock spectral library (RockSL) contains not only the big spectral dataset for unified access, quick retrieval and matching service, but also the characteristics dataset of key parameters/metadata (e.g. particle size, mineral composition and full-band, etc.) for data mining and knowledge discovery.
An operating software system of RockSL was developed being capable of data management, information retrieval and user application, which could be used for the import of open-source datasets with related metadata, the vectorization of spectral curve images, the query of attribute data and spectral data, the quantitative analysis of spectral data and the matching of unknown mineral and rock spectra (). The spectral data in RockSL will be published as a database file (.db), which includes several relational data tables of rock/mineral spectral data and related auxiliary data. The database file can be managed and operated through SQL, which help users to obtain quickly target data and establish a complete dataset according to their own needs. Users can develop also relevant data management and analysis software by themselves based on the shared database file. The integrated library product (RockSL), together with operating software, was released and is shared on GitHub (https://github.com/CSU-PCP-XBS/spectral-dataset-RockSL). GitHub is a hosting platform for open-source and proprietary software projects, which help servers to share data and codes. Publishing RockSL on GitHub will facilitate data release and sharing to communities, which allows users to follow data update and feedback on problems with data services. We hope that more researchers can join us and contribute customized data to RockSL to improve the availability and practical value of data for global communities.
Disclosure statement
No potential conflict of interest was reported by the author(s).
Data availability statement
The integrated spectral library (RockSL) described in this article is openly available on GitHub at https://github.com/CSU-PCP-XBS/spectral-dataset-RockSL.
Additional information
Funding
Notes on contributors

B.S. Xie
Busheng Xie is a Ph.D. student in Geo-science and Info-Physics school of Central South University. He obtained his bachelor’s degree in Geomatics Engineering from Central South University in China. His current research focuses on data organization, analysis and visualization of hyperspectral remote sensing and geo-science.

S.Y. Zhou
Shengyu Zhou received a MS degree from Central South University in 2021. His research interests include spectral database analysis in mining area.
L.X. Wu
Lixin Wu received a BS degree in mining survey from China University of Mining and Technology, Xuzhou, China in 1988 and MS and PhD degrees in geomatics from China University of Mining and Technology (Beijing), Beijing, China in 1991 and 1997, respectively. He is working with Central South University, Changsha, China as a leading professor of Geomatics in the School of Geoscience and Info-physics. Dr. Wu is currently an academician of the International Eurasian Academy of Sciences (IEAS). He was a former Co-Chair of User Applications in Remote Sensing Committee, IEEE Geoscience, and Remote Sensing Society. He is currently a member of the Global Risk Assessment Framework (GRAF) Expert Group of the United Nations, a member of the Infrastructure Implementation Board of Group on Earth Observation (GEO), the Chairman of WG III-8 of International Society for Photogrammetry and Remote Sensing (ISPRS), a member of the China National Committee of the International Society for Digital Earth (ISDE), the Vice Chairman of the Space Observation Committee of the China Seismology Society, and the Editor-in-Chief of the Journal of Geography and Geo-Information Science (Chinese).
W.F. Mao
Wenfei Mao received the B.S. and master’s degrees from Jilin University, Changchun, China, in 2011 and 2015, respectively, and the Ph.D. degree in digital mine engineering from Northeastern University, Shenyang, China, in 2020.He is currently working as a Post Doctor with Central South University, Changsha, China. His research interests include geohazards remote sensing and remote sensing rock mechanics (RSRM).

W. Wang
Wei Wang was born in 1989 in Hunan, China. He is currently an associate professor in the School of Geoscience and Info-Physics of Central South University. He received his Ph.D. in Photogrammetry and Remote Sensing from Wuhan University in 2017. His research interests include optical and laser remote sensing, remote sensing of atmospheric environment, point cloud processing and application.
References
- Baldridge, A. M., Hook, S. J., Grove, C. I., & Rivera, G. (2009). The ASTER spectral library version 2.0. Remote Sensing of Environment, 113(4), 711–715.
- Christensen, P. R., Bandfield, J. L., Hamilton, V. E., Howard, D. A., Lane, M. D., Piatek, J. L., & Stefanov, W. L. (2000). A thermal emission spectral library of rock-forming minerals. Journal of Geophysical Research, 105(E4), 9735–9739.
- Clark, R. N., King, T. V. V., Klejwa, M., Swayze, G. A., & Vergo, N. (1990). High spectral resolution reflectance spectroscopy of minerals. Journal of Geophysical Research, 95(B8), 12653–12680.
- Clark, R. N., Swayze, G. A., Gallagher, A. J., King, T. V., & Calvin, W. M. (1993). The U.S. geological survey digital spectral library:version 1(0.2 to 3.0μm). Open File Report.
- Clark, R. N., Swayze, G. A., Wise, R. A., Live, K. E., Hoefen, T. M., Kokaly, R. F., & Sutley, S. J. (2007). USGS digital spectral library splib06a: U.S. Geological Survey Data Series, 231.
- Farmer, V. (1974). Mineralogical society monograph 4: The infrared spectra of minerals (pp. 427). London: the Mineralogical Society.
- Gaffey, S. J. (1986). Spectral reflectance of carbonate minerals in the visible and near infrared (0.35–2.55 microns): Calcite, aragonite, and dolomite. American Mineralogist, 71, 151–162.
- Goetz, A. F., Vane, G., Solomon, J. E., & Rock, B. N. (1985). Imaging spectrometry for earth remote sensing. Science, 228(4704), 1147–1153.
- Grove, C. I., Hook, S. J., & Paylor, E. D., II. (1992). Compilation of laboratory reflectance spectra of 160 minerals, 0.4 to 2.5 micrometers. Pasadena, CA: Jet Propulsion Laboratory, NASA.
- Gupta, R. P. (2003). Remote sensing geology (2nd ed ed., pp. 655). Springer: Berlin, Germany.
- Hueni, A., Nieke, J., Schopfer, J., Kneubühler, M., & Itten, K. I. (2009). The spectral database specchio for improved long-term usability and data sharing. Computers & Geosciences, 35(3), 557–565.
- Hunt, G. R., & Salisbury, J. W. (1970). Visible and near-infrared spectra of minerals and rocks: I silicate minerals. Modern Geology, 1, 283–300.
- Hunt, G. R., & Salisbury, J. W. (1971). Visible and near infrared spectra of minerals and rocks: II. Carbonates. Modern Geology, 2, 23–30.
- Kahle, A. B., & Goetz, A. F. H. (1981). A data base of geologic field spectra. Proceedings of 15th International symposium on Remote Sensing of Environment. Ann Arbor, Michigan, U.S.
- Kokaly, R. F., Clark, R. N., Swayze, G. A., Livo, K. E., Hoefen, T. M., Pearson, N. C., … Klein, A. J. (2017). USGS spectral library version 7: U.S. geological survey data series 1035. 61p, March, 2020. https://pubs.usgs.gov/ds/1035/ds1035.pdf
- Kruse, F. A., Lefkoff, A. B., Boardman, J. W., Heidebrecht, K. B., Shapiro, A. T., Barloon, P. J., & Goetz, A. F. H. (1993). The spectral image processing system (SIPS)‐interactive visualization and analysis of imaging spectrometer data. Remote Sensing of Environment, 44(2–3), 145–163.
- Kruse, F. A. (1994). Imaging spectrometer data analysis-a tutorial. Proceedings of the International Symposium on Spectral Sensing Res, 1, 44–50.
- Lane, M. D., & Christensen, P. R. (1997). Thermal infrared emission spectroscopy of anhydrous carbonates. Journal of Geophysical Research: Planets, 102(E11), 25581–25592.
- Lane, M. D., Morris, R. V., Mertzman, S. A., & Christensen, P. R. (2002). Evidence for platy hematite grains in Sinus Meridiani, Mars. Journal of Geophysical Research: Planets, 107(E12), 5126.
- Legodi, M. A., Waal, D. D., & Potgieter, J. H. (2001). Quantitative Determination of CaCO3 in Cement Blends by FT-IR. Applied Spectroscopy, 55(3), 361–365.
- Ma, C., Sheng, G. R., Wang, Z. J., & Wang, Z. (2015). Analysis of spectral characteristics for different soils particle sizes. Chinese Journal of Soil Science, 02, 292–298.
- Mao, Y. C., Ma, B. D., Liu, S. J., Wu, L. X., Zhang, X. X., & Yu, M. L. (2014). Study and validation of a remote sensing model for coal extraction based on reflectance spectrum features. Canadian Journal of Remote Sensing: Journal Canadien, 40(5), 327–335.
- Mcfadden, F. R., & Hoffer, J. A. (1988). Database management (2 ed.). California, USA: The Benjamin/Cumming's Publishing Company.
- Mcglone, J. C., & Shufelt, J. A. (1994). Projective and object space geometry for monocular building extraction. Pennsylvania, US: Carnegie Mellon University.
- Meerdink, S. K., Hook, S. J., Roberts, D. A., & Abbott, E. A. (2019). The ECOSTRESS spectral library version 1.0. Remote Sensing of Environment, 230(111196), 1–8.
- Michener, W. K., & Brunt, J. W. (2009). Ecological data: design, management and processing (pp. 92–116). Oxford, UK: Wiley-Blackwell Science.
- Noronha, S., & Nevatia, R. (2001). Detection and modeling of buildings from multiple aerial images. IEEE Transactions on Pattern Analysis and Machine Intelligence, 23(5), 501–518.
- Okin, G. S., & Painter, T. H. (2004). Effect of grain size on remotely sensed spectral reflectance of sandy desert surfaces. Remote Sensing of Environment, 89(3), 272–280.
- Pelkey, S. M., Mustard, J. F., Murchie, S., Clancy, R. T., Wolff, M., Smith, M., & Gondet, B. (2007). CRISM multispectral summary products: Parameterizing mineral diversity on Mars from reflectance. Journal of Geophysical Research Planets, 112(E8), 171–178.
- Peng, W., & Liu, G. (1982). In Zhou, M. S (Eds.).Infrared spectra of minerals (pp. 68–490). Beijing: Science Press.
- Rasaiah, B. A., Jones, S. D., Bellman, C., Malthus, T. J., & Hueni, A. (2015). Assessing field spectroscopy metadata quality. Remote Sensing, 7(4), 4499–4526.
- Rasaiah, B., Malthus, T., Jones, S. D., & Bellman, C. (2012). Critical metadata protocols in hyperspectral field campaigns for building robust hyperspectral datasets. In Proceedings of the XXII ISPRS Congress (Vol. 26). Melbourne, Australia.
- Rybkina, A., Hodson, S., Gvishiani, A., Kabat, P., Krasnoperov, R., Samokhina, O., & Firsova, E. (2018). CODATA and global challenges in data-driven science. Russian Journal of Earth Sciences, 18(4), ES4002.
- Salisbury, J. W., & Eastes, J. W. (1985). The effect of particle size and porosity on spectral contrast in the mid-infrared. Icarus, 64(3), 586–588.
- Shanshan, W., Kefa, Z., Nannan, Z., & Wang, J. (2014). Spectral data analysis of rock and mineral in Hatu Western Junggar Region, Xinjiang. Proceedings of the SPIE 9260, Land Surface Remote Sensing, II, 92602V.
- Song, L., Liu, S. J., Yu, M. L., Mao, Y. C., & Wu, L. X. (2017). A classification method based on the combination of visible, near-infrared and thermal infrared spectrum for coal and gangue distinguishment. Spectroscopy and Spectral Analysis, 37(2), 416–422.
- Stelle, C. A., Ariza-López, F. J., & Ureña-Cámara, M. A. (2018). Spectral library: A proposal for data model. IGARSS 2018–2018 IEEE International Geoscience and Remote Sensing Symposium, Valencia, Spain, (pp. 7395–7398).
- Su, L., Li, X., Wang, J., & Tang, S. (2003). Some problems of typical ground object spectral knowledge base construction and spectral service. Advances in Earth Sciences, 2, 185–191.
- van der Meer, F. D., van der Werff, H. M. A., van Ruitenbeek, F. J. A., Hecker, C. A., Bakker, W. H., Noomen, M. F., … Woldai, T. (2012). Multi- and hyperspectral geologic remote sensing: A review. International Journal of Applied Earth Observation & Geoinformation, 14(1), 112–128.
- van der Meer, F. (2004). Analysis of spectral absorption features in hyperspectral imagery. International Journal of Applied Earth Observation and Geoinformation, 5(1), 55–68.
- Vignesh, K. M., & Kiran, Y. (2020). Comparative analysis of mineral mapping for hyperspectral and multispectral imagery. Arabian Journal of Geosciences, 13(4), 160.
- Wang, D., Liu, S. J., Mao, Y. C., Wang, Y., & Tian-Zi, L. I. (2018). A method based on thermal infrared spectrum for analysis of sio_2 content in anshan-type iron. Spectroscopy and Spectral Analysis, 38(7), 2101–2106.
- Whitaker, S., & Pigford, R. L. (1960). An approach to numerical differentiation of experimental data. Industrial and Engineering Chemistry, 52(2), 185–187.
- Xie, B. S., Zhou, S. Y., & Wu, L. X. (2020). An integrated mineral spectral library using shared data for hyperspectral remote sensing and geological mapping. The International Archives of Photogrammetry, Remote Sensing and Spatial Information Sciences, 43, 69–75.
- Yang, B. (1987). Reflective spectrum features of rocks and ores and their application. Geochimica, 1, 8.
- Zhang, Y., Xiao, Q., Wen, J., You, D. Q., Dou, B. C., & Tang, Y. (2017). Review on spectral libraries: Progress and application. Journal of Remote Sensing, 21(1), 12–26.
- Zhong, S. Y., Xiao, Q., Wen, J. G., Zheng, X. M., Ma, M. G., Qu, Y. H., Zheng, K., Chi, T. H.,Tang, Y., You, D. Q., Hao, D. L., Cheng, J., He, M., Jiang, T. Jin, R., Yao, X. J., & Zhao, L. J. (2020). Design and realization of ground object background spectral library for surveying and mapping. Journal of Remote Sensing (Chinese), 24(6), 701–716.
- Zhou, X., & Zhou., D. (2009). Review of digital ground object spectral library. Spectroscopy and Spectral Analysis, 29(6), 1616–1622.