
 ?Mathematical formulae have been encoded as MathML and are displayed in this HTML version using MathJax in order to improve their display. Uncheck the box to turn MathJax off. This feature requires Javascript. Click on a formula to zoom.
ABSTRACT
The paper aims at exploring the relationship between housing resale prices and neighborhood features in Zhuhai, as well as structure and location characteristics. Thirteen neighborhood features are collected to analyze their influence on average community-level apartment resale prices in 2018. Six neighborhood features, structural and location characteristics, are selected according to their statistical significance and multicollinearity test results from an OLS model. Regression analysis is performed by OLS, GWR, and MGWR to compare their performance in housing price research at community level. The comparison of the three models also demonstrates that the GWR (66%) and MGWR (68%) models perform much better than OLS model (52%). MGWR is not significantly different from GWR in areas with few sample points, and the optimal bandwidth at different spatial scales is hard to be captured in a city-level study area. The regression parameter indicates that building age is the most important factor among all influencing factors. Proximity to schools and factories have positive and negative significant effects on housing resale prices, respectively. The spatial pattern of neighborhood features is also detected at town level. GWR and MGWR models accurately demonstrate local spatial heterogeneity of the housing resale market, which provides better results than the traditional OLS model in the goodness of fit and parameter estimates when spatial dependency is present. The results provide references for local planning departments, helping to reveal the complicated relationship and spatial patterns between housing price and determinants over space.
1. Introduction
In recent years, the rapid growth of housing prices developed into a major problem in China. Although urban planners and administrators have considered several policies and proposed solutions to reduce the pace of price increases, results are yet ineffective. To fully understand the mechanisms behind housing prices has become a challenge in China. As a crucial part of the real estate market, pre-owned apartment attracts lots of attention, from policy makers to citizens. When buying a pre-owned apartment in an urban area, the decision makers setting asking prices prioritize neighborhood features. Neighborhood features are analyzed on the community level, exhibiting the same influence for all the houses in one community. Housing resale prices reflect their location and other characteristics, an understanding of influencing mechanisms helps the government to formulate reasonable price regulation and land use policies (Cao, Diao, & Wu, Citation2018).
Due to the tight connection of housing price and the performance of the regional economy, widespread research in measuring the effect of various factors on housing prices has been conducted by numerous scholars. Considering various potential dimensions influencing housing prices, research has been conducted based on different methods.
1.1. Methods
There are various methods to analyze the relationship between potential impact factors and housing price. Literature also shows that hedonic pricing method (HPM) is the most common one to explore property value effects. Based on the hedonic hypothesis that goods are valued for their utility-bearing attributes or characteristics, HPM was first developed in 1974 (Rosen, Citation1974). According to hedonic price theory, the price of the commodity consists of the characteristic price and the implied price, which corresponds to each characteristic. The HPM model was originally proposed and used in economics such as estimating the marginal implicit prices of any factor influencing potential purchasers (Bartik & Smith, Citation1987; Gatto, Citation2000). In 1998, spatial hedonic regression analysis was first developed to improve the prediction of individual asset values, which demonstrates the substantial benefits obtained by modeling the spatial-temporal dependence of the data (Gelfand, Ghosh, Knight, & Sirmans, Citation1998; Pace, Barry, Clapp, & Rodriquez, Citation1998). After that, applications in relation to HPM and housing prices were developed (Cebula, Citation2009; de Araujo & Cheng, Citation2017; Helbich, Brunauer, Vaz, & Nijkamp, Citation2014; Osland, Citation2010; Shabana, Ali, Bashir, & Ali, Citation2015). A stochastic approach was developed to correct autocorrelation bias in the hedonic function (Tse, Citation2002) and a comparison between HPM and Artificial Neural Networks in housing price prediction was detected (Limsombunchai, Gan, & Lee, Citation2004)
Spatial heterogeneity is a necessary geographical phenomenon when analyzing housing prices. However, the hedonic pricing model is not sensitive enough to detect the complexity of spatial dependencies (So, Tse, & Ganesan, Citation1997). With the development of advanced spatial analyses, some researchers began to consider spatial interactions. Geographically weighted regression (GWR) is a localized multiple-regression model that can be used to evaluate the spatial relationships between dependent variables and explanatory variables (Brunsdon, Fotheringham, & Charlton, Citation1996).
The GWR model has been widely applied in the field of housing price studies among scholars. The spatial variation in the effect of structural amenities and locational context were analyzed in China (Hanink, Cromley, & Ebenstein, Citation2012). The spatial effects of public service facilities’ accessibility on the housing market were revealed (Lan, Wu, Zhou, & Da, Citation2018). Additionally, some scholars have applied Contextualized-GWR, Mixed-GWR, GWR with a non-Euclidean distance metric to improve the housing prices studies (R. Harris, Dong, & Zhang, Citation2013; Helbich et al., Citation2014; Lu, Charlton, Harris, & Fotheringham, Citation2014). To validate the results of GWR, many scholars take the OLS model into account to compare their performance (Fotheringham & Brunsdon, Citation1998; Zheng, Citation2014).
1.2. Factors
Measuring the effects of various factors on housing prices has aroused widespread interest among scholars (Liang, Liu, Qiu, Jing, & Fang, Citation2018). Significant empirical research on the characteristic of housing prices has been conducted by previous scholars, mainly including the structure, location, neighborhood and landscape (Wen, Zhang, & Zhang, Citation2015). The effect of structural variables including year of construction, floor level, living area, etc, are detected as a basis (Li, Chen & Grant, Citation2021; Wen, Xiao, & Zhang, Citation2017a; Wu, Ye, Du, & Luo, Citation2017; Zhang, Zhou, & Hui, Citation2020; Zheng, Citation2014).
In previous studies, relationships between housing prices and neighborhood environment were widely explored. Some publications have confirmed that the selected neighborhood factors have a significant effect on the housing prices. Transportation and accessibility to transport receive great attention from many scholars. Numerous literature reviews of the property value effects of public transport have been published, including railway, bus, and train, which illustrated the effect of transportation accessibility on house prices (Cao et al., Citation2018; Dai, Bai, & Xu, Citation2016; Debrezion, Pels, & Rietveld, Citation2011; Dubé, Thériault, & Des Rosiers, Citation2013; Dziauddin, Citation2019; Golub, Guhathakurta, & Sollapuram, Citation2012; Jang & Kang, Citation2015; So et al., Citation1997; Yang, Zhou, Shyr, & Huo, Citation2019). In the case of Zhuhai, the opening of the Hong Kong–Zhuhai–Macao Bridge has a comprehensive impact on Zhuhai housing prices (Liu & Zhi, Citation2019; Zhou, Pan, & Zhuang, Citation2019). Besides, the educational facilities and quality also have a positive capitalization effect on housing prices, which has been observed in China and United States (Bae & Chung, Citation2013; Clark & Herrin, Citation2000; Wen, Xiao, Hui, & Zhang, Citation2018; Wen et al., Citation2017a; Wen, Zhang, & Zhang, Citation2014). The significant impact of the environments on housing prices are increasing in recent years, such as environmental amenities, urban landscape, and accessibility to parks. Buyers are also willing to pay more for apartments with sea view and perceived better air quality (Baranzini & Schaerer, Citation2011; Chen & Grant, Citation2021; de Araujo & Cheng, Citation2017; Diao & Ferreira, Citation2010; Hui, Chau, Pun, & Law, Citation2007; Jim & Chen, Citation2010; Nilsson, Citation2014; Wang, Lee, & Shirowzhan, Citation2021; Wen, Xiao, & Zhang, Citation2017b; Wen et al., Citation2015; Wu et al., Citation2017). Other factors such as the distance to the central business district (CBD), accessibility of shopping malls, the distance to hospitals, and availability of recreational facilities are also considered (Geng, Cao, Yu, & Tang, Citation2011; Hui et al., Citation2007; Tse, Citation2002; Zhang et al., Citation2020).
Although many studies have involved different methods and factors, comparative research among OLS, GWR, and MGWR models in housing prices is still insufficient. Moreover, neighborhood features are increasing to be one of the determining factors for homebuying and urban planning. Exploring the spatial influence of more neighborhood features is meaningful for further analysis of housing price research. The recognition and analysis of spatial patterns and impact factors of community-level of housing resale prices have important implications for future policies on urban development.
To further develop the housing price research, this study takes Xiangzhou district, Zhuhai city as a research area. The housing resale price, neighborhood features, structure, and location characteristics are collected from 862 communities and 13 kinds of points of interest (POI). Moran’s I analysis is performed to estimate the spatial distribution of Zhuhai housing resale price. OLS is performed as the exploratory data analysis to filter the appropriate variables. All selected variables pass the statistical significance and the variance inflation factor tests. Based on the filtered variables, OLS, GWR, and MGWR models have been developed and applied to study the spatial or locational variation in housing resale prices and the contribution of various determinants. Second, the comprehensive performance among three models is compared, especially their model fit, standard residual, and corrected Akaike Information Criterion (AICc). Third, the results of GWR and MGWR models, especially the local R-square, are explored to analyze the spatial patterns and the local performance between two models. Finally, the coefficient, behavior and spatial patterns of specific explanatory variables are discussed, measuring their influence on housing resale price.
2. Data and method
2.1. Study area
Zhuhai is located in the Pearl River Delta (PRD), Guangdong province. The adjacence of Macau and closeness to Hong Kong brings Zhuhai lots of opportunities. Xiangzhou district in Zhuhai city was selected as one of the earliest Special Economic Zones (SEZ) in China (Sheng & Tang, Citation2013). Within a land surface area of 1732 km2, Zhuhai has experienced a rapid urban sprawl with the fast growth of built-up areas and population for the past four decades, evolving from a double-center city to a multi-center city (Xian, Li, & Qi, Citation2019).
Since the economic-reform experiments in 1980, the housing market in SEZ was growing rapidly (Yeung, Lee, & Kee, Citation2009). The implementation of Chinese housing commercialization policies has resulted in proactive and profit-oriented commercial developers (Wei, Lam, Chiang, & Leung, Citation2014). With the opening of the Hong Kong–Zhuhai–Macao Bridge in 2018 and the Guangdong-Hong Kong-Macao Greater Bay Area was promoted on the national agenda in 2017, Zhuhai has found the new driving force of the great business opportunities for the new geographical integration.
From 1980 to 2010, SEZ expanded from separated rural land into seven towns, but still limited in Xiangzhou District. Therefore, Xiangzhou district is the economic, political, and cultural center with the highest district-based Gross Domestic Product (GDP) in Zhuhai (Sheng & Tang, Citation2013). In 2019, the permanent population of Zhuhai reached 2.02 million, of which 1.17 million are concentrated in the Xiangzhou district. 67.5% of GDP in Zhuhai comes from Xiangzhou district (Bureau, Citation2020). The connecting point of Hong Kong–Zhuhai–Macao Bridge and the port to Macao were located in Xiangzhou district. Although the effect of the opening of Hong Kong – Zhuhai – Macao Bridge on housing prices has been considered in previous research, this was conducted in a non-spatial frame (Li & Shi, Citation2020). Under such circumstances, Xiangzhou district was selected as the study area in this research. This research can help the local policy makers better understand the determining factors of housing prices to formulate policies on land use and urban planning. The methodology and analysis of results may support potential property investors to detect the association between neighborhood features and housing resale prices.
2.2. Data and measures
2.2.1. Dependent variables
All housing resale prices and structure characteristics were collected from the Anjuke real estate and housing database (https://zh.anjuke.com/) in 2018 based on the community level. The average housing resale prices (Yuan/m2) within 862 residential communities were selected as the dependent variable. The samples were filtered to remove abnormal housing prices, such as villas.
It is hypothesized that the apartments with different structural characteristics and resale prices within a specific residential community share the same neighborhood conditions. In the case of Zhuhai, the average difference of housing resale price within a community is less than 15%. Such differences within a residential community are considered insignificant. Therefore, this research focuses on community level and does not consider different apartment levels.
Spatial autocorrelation was assessed with Moran’s I statistic (Anselin, Citation1995). The following results () show the autocorrelation relationship of prices of Zhuhai pre-owned houses in 2018.
Table 1. The result of auto-correlation analysis.
The Moran’s I value of 0.270 means that the average housing prices vary spatially among different regions in this study area. Although the magnitude of the z-score indicates that Moran’s I is not normally distributed, it is nearly impossible to be considered as a random distribution. The housing resale price in Zhuhai generally shows an obvious positive spatial autocorrelation and thus regional agglomeration.
2.2.2. Explanatory variables
Explanatory variables that influence the housing resale prices have been widely detected when analyzing structure characteristics, location characteristics and neighborhood features in Zhuhai. Structure characteristic is the internal factor of the house structure. When considering the structure characteristics at community level, the impact of the internal factors, such as floors, area, and decoration, have been offset in the same community. Therefore, building age becomes a key factor of structure characteristic when comparing different communities. Thus, this research regards building age as the main structure characteristics. For the location characteristic, this research considers the distance to Gongbei Port as the major impact factor. Gongbei Port is the economic center of Zhuhai, as well as the city center. The distance to Gongbei Port is a crucial factor when analyzing the property location value in Zhuhai.
Neighborhood attributes represented through POIs in the surrounding area within communities are another type of explanatory variable. To better evaluate the effect of the neighborhood features, every neighborhood attribute around each community is weighted calculated by their types and range distance to the community. The score of each neighborhood feature is equal to the distance score multiplied by the types score.
In Xiangzhou district, the road connectivity is regular and even, especially in the residential area. The maximum buffer distance used in this research is 1000 m. In such a short distance, the residents tend to walk to their destination, even take a short cut through a garden. In this situation, Euclidean distance can better represent the actual distance than the street distance. Therefore, the Euclidean distance was used as a proxy for the network distance to neighborhood features. To optimize the explanatory variables, multiple rings of buffer were created for every community to calculate the distance score of each POI. Spatial proximity can be assessed using distance-based measurements. Distance-based measurement methods, such as the range distance, are suitable for modeling continuous data (He, Sheng, Jing, Yin, & Hasnain, Citation2020). All the geospatial data associated with neighborhood features were obtained from the Amap (https://m.amap.com/). The description and score calculated principle of range distance is shown in .
Table 2. The descriptions and score of range distance.
Besides, different types of POI decide their importance to the community. To better evaluate the variability between different POI, type score is calculated based on the importance of their types. The description of neighborhood features data is shown in .
Table 3. The descriptions of type score.
2.3. Analysis methods
2.3.1. OLS
To estimate the construction characteristics and neighborhood features on housing resale prices, this paper initially uses a traditional HPM. As widely recognized, HPM is a method used to analyze the market value for individual apartments with many attributes. This method is developed based on the hypothesis that goods are valued on their attributes or characteristics. The general form of a HPM can be defined as
where is the resale market price of apartment
;
is a functional form of construction characteristics;
is a functional form of neighborhood features; and
is a vector of the random error residual terms.
Many previous studies have made use of OLS to express the traditional HPM linear regression. OLS is the method commonly used to estimate and calculate the global regression coefficient, which is a test to determine whether the explanatory variables have consistent relationships with the dependent variable in data space (Horrace & Oaxaca, Citation2006). Therefore, when results of this test are statistically significant, the associated function relations are consistent for all sample points and the effectiveness of each explanatory variable has statistically significant non-stationarity. However, the interactions with spatial data have heterogeneous characteristics, which are not effectively described by global regression models. An OLS estimate of the conventional HPM often leads to biased and inconsistent or inefficient results due to the spatial dependencies among the observations (Anselin, Citation1998). This paper begins regression analysis with OLS regression to find a properly specified initial OLS model as a reference. Then, the same groups of explanatory variables are used to run GWR. Explanatory variables with statistically significant non-stationarity are often a good fit for GWR analysis.
2.3.2. GWR
As mentioned above, the main problem in housing price studies is to deal with spatial heterogeneity and autocorrelation within the housing market. Although many past studies have made different attempts to apply HPM in housing submarkets, the spatial relationship between housing prices and impact factors was not explicitly modelled because of global regression limitations. To overcome this limitation, a GWR model has been employed to better study the locational variation, with significant variables identical to those obtained from the OLS. GWR was proposed in 1996 (Brunsdon et al., Citation1996). As a statistical technique, GWR measures the relationships between predictors and outcome variables over space within a single modelling framework (O’Sullivan, Citation2003; Wheeler & Páez, Citation2010). GWR can significantly reflect the spatial heterogeneity relationship with a local regression model. The coefficients of a basic GWR can be specified as follows:
where refers to the housing resale price at location
;
is the intercept at location
;
refers to the value of local regression coefficient of a continuous function for the specific number
independent variable at position
;
refers to the specific number
attribute for location
; and
refers to the random error at location
. Coefficients of GWR models can vary continuously over the study area. To indicate the effect of certain observations points, GWR introduces a weight matrix when estimating the regression coefficient at position
. In the weight function, the observation closest to location
provides the best estimation. The choice of bandwidth is the most important factor in weight function and Akaike information criterion (AIC) is used to validate the bandwidth selection. When the AIC value reaches the minimum, the optimized bandwidth is obtained (Akaike, Citation1974). When the sample size is small, AICc can replace AIC for optimization (Burnham & Anderson, Citation2004). A Gaussian function is chosen as the weight function in this study.
The model specification is as follows – Model type: Gaussian; Option: Standardization of independent variables, Geographical variability test; Kernel type: Adaptive bi-square (NN); Bandwidth selection method: Golden section search; Selection Criteria: AICc. A fixed distance is used to calculate the bandwidths of the Gaussian kernel and Akaike Information Criterion.
2.3.3. MGWR
GWR explores the spatial non-stationarity of relationships and provides a measure of the spatial scale at which processes operate through the determination of an optimal bandwidth. However, classical GWR assumes that all of the processes being modeled operate at the same spatial scale, which tends to produce rough surfaces when the mean parameters have considerable variations. This assumption constrains the local relationships within each model to the same spatial scale. Variations in spatial relationships within a GWR model might also vary in intensity with respect to location and direction. To derive an optimal bandwidth at different spatial scales, different processes are allowed to operate at different spatial scales, which is MGWR as follows (Fotheringham & Kang, Citation2017; Leong & Yue, Citation2017; Lu, Brunsdon, Charlton, & Harris, Citation2017):
where in
indicates the bandwidth used for calibration of for the specific number
conditional relationship. The bandwidths indicating the data-borrowing range can vary across parameter surfaces. MGWR allows the conditional relationships between the response variable and the different predictor variables to vary at different spatial scales.
2.4. Working process
In this research, OLS, GWR, and MGWR models have been developed and applied to study the spatial or locational variation in housing resale prices and the various determinants in Zhuhai. To better describe the working process of this research, the entire working flow in shown as . First, an OLS model is implemented to filter suitable explanatory variables for further analysis. Second, the performance among three models is comprehensively compared, especially their model fit, standard residual, and AICc. Third, the results of GWR and MGWR models, especially the local R-square, are explored to analyze the spatial patterns and the local performance between two models. Finally, the coefficient, behavior and spatial patterns of specific explanatory variables are discussed, measuring their practical influence significance on housing resale prices.
Figure 1. The research process.
3. Results
3.1. OLS results and filtered variables
To analyze a set of commonly considered potential determinants of housing resale prices, an OLS model is first calibrated of the housing resale price, including all the structure characteristics, location characteristics, and neighborhood features. Before the model’s estimation, all variables have been standardized into the range 0 to 1. The results show that the model is overall significant, explaining approximately 54.1% of the variation in the dependent variables. The coefficient of the variables and its significance are determined for each explanatory variable, shown in .
Table 4. Results of OLS model.
The standardized coefficients capture the magnitude of the effect on housing resale price. Structure characteristics, equal to the year of construction, play the most important role in affecting the resale price in Zhuhai. One standard deviation unit change in the year of construction leads to a price change of 0.494 standard deviations. Besides, the location characteristic also is a key factor, having the second biggest absolute standard coefficient value among all variables.
The results also help identify and quantify the neighborhood features that can significantly affect housing resale price. Housing resale prices are found to be positively associated with schools and executive institutions. Executive institutions are the most important neighborhood feature determinants of resale prices according to the standardized coefficient, which indicates that the location of executive institutions always related to the higher housing price area in Zhuhai. In China, living nearby the executive institutions could bring more sense of security to citizens. Besides, the executive institutions always located closed to the public service institutions, such as cultural hall and library. This is also benefit for daily recreational life. The school district infrastructures have gradually become an essential influencing factor in purchase decisions of resale housing.
Distance to Gongbei Port reveals a negative effect on housing resale price, which means that the further from Gongbei Port, the lower the average housing resale price of the community. With the opening of the Hong Kong–Zhuhai–Macao Bridge in 2018 and the Guangdong-Hong Kong-Macao Greater Bay Area was promoted as a national priority in 2017, Gongbei Port became a focus of people and governments. The distance to Gongbei Port, which connects Zhuhai and Macao, has occupied a dominant position among influencing factors.
Factories, markets, and gas stations are negatively associated with the housing resale price. Factories could bring the dust to the nearby neighbors, as well as the noise from the production and the freight trunk. Gas station has the potential risks to the nearby community. Markets without good management always accompany with poor environmental health.
Zhuhai is very different with regard to natural amenities like parks, which are supposed to significantly affect the housing resale prices in many other cities. Park is insignificantly associated with housing resale price, indicating residents’ unwillingness to pay more to live closer to parks. This result is not surprising given due to the even spatial resource allocation, and the long coastal line as natural sceneries.
Shopping malls do not have a significant correlation to OLS model. Different from Beijing and Shanghai, Zhuhai is a city with an average population, so there is less priority and demand for shopping amenities. Furthermore, Zhuhai does not function as a regional shopping center compared to Macao. Shopping malls exhibit a greater impact on housing prices in cities with younger populations such as Shenzhen. Additionally, there is a significant complementary effect between markets and shopping malls in Zhuhai.
To avoid multicollinearity problems among regression variables, the initial input variables are filtered according to statistical significance and variance inflation factor (VIF). All the VIF of filtered variables should be lower than 5. Then, the p-value of potential determinants are detected to exclude non-significant independent variables (p-value>0.02). It is also important to account for any outliers in the sample data so that the output of GWR is interpreted correctly. Therefore, Robust GWR is used in this research to weaken the impact of the potential outliers (Gollini, Lu, Charlton, Brunsdon, & Harris, Citation2015; P. Harris, Fotheringham, & Juggins, Citation2010). The results of Robust GWR are not significantly different from MGWR model. After filtering, eight variables qualify for further studies.
3.2. Performace of OLS, GWR, and MGWR models
Given the filtered variables, a comparison among three models is performed. They are summarized by the residual sum of squares, AICc, R-square, and adjusted R-square, as shown in . AICc was chosen as the method of assessing the kernel bandwidth selection in this study. Generally, a model with lower AICc value indicates that the variables fit better, and the model performs better overall. The considerable decrease of AICc from OLS to GWR and MGWR means that the spatial effect substantially influences housing prices. A high adjusted R-square value identifies a model explaining more variation in the housing resale price in Zhuhai. The AICc of GWR and MGWR is smaller than that of OLS, but its adjusted R-square is much larger. The results explicitly shows that the GWR and MGWR models perform much better than the traditional OLS model. It demonstrates that the housing resale price varying in terms of the effect and magnitude across space, particularly for the demand of explanatory variables that are spatial in nature. In other words, this study provides empirical evidence confirming the presence of spatial heterogeneity, which cannot to be identified within global regression model such as OLS. When spatial dependency is present in urban housing resale data, GWR and MGWR models reveal much better that the complicated relationship between housing resale price and spatial factors.
Table 5. Results of OLS, GWR, and MGWR.
In this study, MGWR performs better than GWR as indicated by a higher adjusted R-square, lower AICc, and lower residual sum of squares. This means that the MGWR model can slightly improve the performance in capturing the spatial variation of the housing resale prices. The bandwidth of GWR is 250, while the bandwidths of different variables in MGWR is shown in . Although there is almost no difference for both diagnostic statistics, it still demonstrates that an optimal bandwidth at different spatial scales having better performance, particularly for different processes operating at different spatial scales.
Table 6. The bandwidths of MGWR.
However, Zhuhai is a small and compact city, as shown in
Figure 2. Community dot density and average housing price.
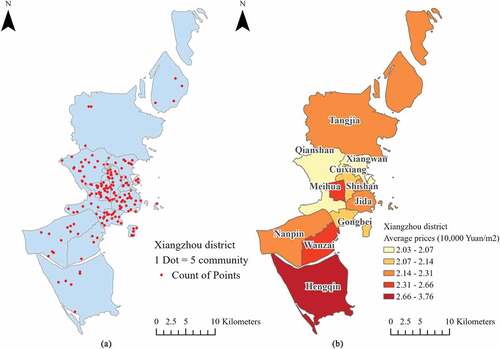
The results of the MGWR method show that the impact distance of different neighborhood features varies in Zhuhai, although the difference with classic GWR is not obvious. Classic GWR can solve part of the spatial heterogeneity problem which cannot be handled by OLS, but it ignores the scale problem of spatial heterogeneity of different influencing factors and causes some estimation errors. MGWR improves on classical GWR by allowing the bandwidths of each variable to be different, thereby obtaining more credible estimation results and giving the scale of influence of different variables. If the bandwidth of a potential variable only has a small change in a tiny area, it’s hard to be captured in a city-level urban area.
The local R-square values of GWR and MGWR models are shown in
Figure 3. Local R-square results of GWR and MGWR models.
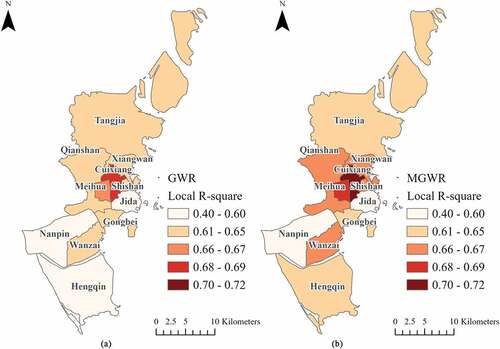
Compared to local R-square models, we can yield several interesting results about the spatial pattern. MGWR model can better simulate the local variables’ impact in the city center than GWR models. The local models in the downtown area, such as Cuihua and Meihua town, have better performance than the local models. 70% of the housing resale price can be explained in this area. In the non-central area, such as Nanping, Tangjia, and Hengqing town, local models can only explain 60% or less of the housing resale price.
Comparing , it’s obvious that GWR and MGWR models have worse performance in the sample scarce areas. This further illustrates that GWR and MGWR models are not suitable in the areas without sufficient samples. More appropriate variables are required in the non-central areas to provide a better explanation for local estimation and more sample points are required in housing price research. The spatial pattern of also proves that the local model fit of the housing resale price doesn’t have an obvious relationship with the housing price itself.
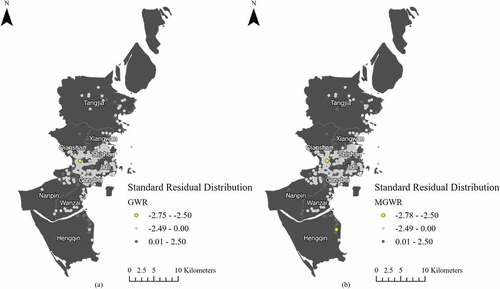
GWR and MGWR models don’t necessarily fully eliminate spatial autocorrelation of residuals. To better illustrate the results, the distribution of standard residuals is also tested, as shown in . Only few points have an absolute residual value exceeding 2.5. The Moran’s I spatial autocorrelation analysis also shows that the residual value of MGWR model is random distributed.
Figure 4. Standard residual distribution of GWR and MGWR models.
3.3. Behavior of specific variables
The coefficients of all significant variables can be found in . The standardized coefficients capture the magnitude of the effect on resale price. Year of construction plays an important role in both GWR and MGWR models. The coefficient of the year of construction is positive, and the absolute value is the biggest among all variables, indicating that year of construction is the crucial key impact factor of housing resale price. This result suggests that newer communities are associated with higher housing prices.
Table 7. Mean value for Parameter Estimates.
Except for year of construction, executive institutions and distance to Gongbei Port are the top two factors in the GWR and MGWR model. However, distance to Gongbei Port has a different relationship of these two models. While distance to Gongbei Port in GWR model shows slightly negative to housing resale price, the coefficient in MGWR model has a significantly positive relation. This is a good example to demonstrate the benefit of MGWR model, which could adjust the optimal bandwidth to better match the real case. shows that distance to Gongbei Port has the smallest bandwidth among all variables. But it could still has a strong influence to housing resale price in such close proximity.
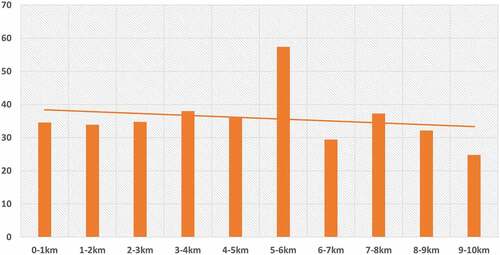
With regard to the spatial structure in Zhuhai, the spatial influence of Gongbei Port is tested by analyzing the relationship between the distance to Gongbei Port and housing resale prices. As the distance to Gongbei Port increases, a salient extreme of housing prices are identified approximately 5–6 km from Gongbei Port, which is the school district area. Although the salient extreme existed, the housing resale price still shows a declining trend when the distance to Gongbei Port increases. The result is shown as .
Figure 5. Housing Price (1000 yuan/m2) and the distance to Gongbei Port.
Besides, the effect of distance to Gongbei Port, markets, post office, and executive institutions, is relatively complicated in Zhuhai. This result demonstrates that an optimal bandwidth at different spatial scales may change the influence ranking of different variables. Among the neighborhood features, the estimation results show significant positive effects of school on housing price, while the effects of factories and gas stations are significantly negative.
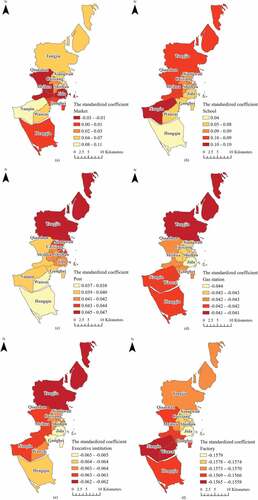
The coefficient of each variable that changes in space was generated by non-stationary relationships. Therefore, we mapped the coefficients among all the neighborhood variables and analyzed the spatial variation of their influences on housing resale prices.
The spatial pattern of the standardized coefficients is shown in
Figure 6. Neighborhood features coefficient in GWR model.
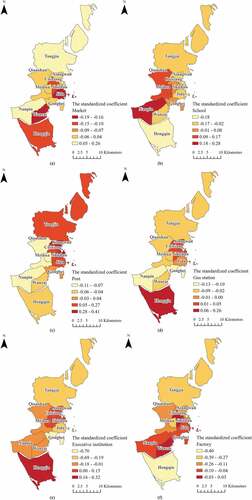
Figure 7. Neighborhood features coefficient in MGWR model.
The results show a significant positive relationship between schools and housing prices for a cluster of neighborhoods located in Nanpin, Meihua, and Qianshan town (). Most of the good primary schools and middle schools are located in these areas. This implies that housing price is positively affected by the quality of schools: the better educational services within the neighborhood, the higher the housing price. Also, the unevenly distributed educational resources magnify residents’ demand for good schools.
The local coefficient of the post office is positive for most of the northern neighborhoods, although it has negative significance for several clusters of neighborhoods located in the middle and south part of the city besides the limited number of middle eastern neighborhoods in GWR model (). Meeting our expectations, the scarcity of post office in northern Zhuhai makes post office more positively correlated to housing prices than any other part of the city. The post office provides residents with cheap and convenient post service. This mode of logistics service is more favored by traditional local villages, mostly clustered in Tangjia town.
A few neighborhoods located in the downtown area represent the inverse relationship between gas stations and housing prices (). This finding is not surprising given that gas stations, especially in the crowded living area, can lead to dangerous effects on nearby houses, which implies that gas stations can have a role in housing price differences among residential neighborhoods.
The OLS result for executive institutions reveals that executive institutions have a significant positive effect on housing price. The GWR model partially confirms this relationship (). Although MGWR model doesn’t confirm the significant effect of executive institutions on housing price at the 0.1 level, it still has a similar spatial pattern distribution (). Especially for Gongbei town, this is the economic center of Zhuhai city and the connecting point of Macao. The lowest absolute coefficient among all the towns means that the impact of executive institution on the housing price in economic developed urban area is low. Executive institutions supply important environmental, social, convenient and economic benefits to urban residents.
Based on the OLS model, factories have a statistically significant negative effect on housing price. In the GWR and MGWR model, neighborhoods in different parts of the city display the same conditions on the relationship between factory and housing price (). The local coefficient is negative for all neighborhoods, although it is not significant at the 0.1 level for some neighborhoods located in the downtown area in GWR model.
Overall, the GWR and MGWR results show diverse patterns of association between neighborhood features and housing prices. Exploring these differences provides important insights into the effect of neighborhood features on the price level of housing in Zhuhai.
4. Conclusions
On the basis of an empirical study, this paper explores the spatial relationship between housing resale prices and potential impact factors at the community level, taking Xiangzhou district, Zhuhai city as a case study. By taking a spatially explicit approach, this analysis helps to better understand OLS, GWR, and MGWR models application in housing resale price. In addition, the spatial patterns and influence level of neighborhood features are analyzed at the community level, which is critical to understanding the impact of distance. The major contribution of this article is concluded as follows.
The spatial distribution of high or low housing prices is spatially clustered. Regarding the mechanism of housing resale prices in the study period, structure characteristic is the primary factor of housing resale price of Zhuhai, followed by neighborhood features. By calculating geographical entities using regression equations and constructing local model equations, MGWR and GWR can prevent the observed weakness of fixed effects in OLS. The results demonstrate that GWR and MGWR are effective in exploring the spatial non-stationarity of housing price distribution. GWR and MGWR models have greatly improved the estimation of housing resale prices. The wide range of local R-square values shows the heterogeneity of the relationship. The result indicates that the effects of the attributes differ over space. A better result of MGWR can be expected if it is adopted with more samples and a proper observing scale.
Given that providing people with affordable and convenient housing is one of the main concerns of policymakers, housing resale price became one of the main concerns of people and local government. Due to the finding that neighborhood features are important factors for housing resale price, research on the spatial distribution of housing resale price promotes scientific and standardized management of land prices in Zhuhai. These findings not only add evidence to the literature in analyzing the relationships among housing resale price, structure characteristics, and neighborhood features, but may also provide implications for scenario selection in housing resale price simulation studies.
Several limitations of this study should be mentioned, and future research will focus on the following topics. First, due to the limitation of data availability, the potential locational factors we selected are not comprehensive. More variables of other dimensions and some internal factors of communities (e.g. plot ratio and greening rate) should be further investigated, which can improve the estimation of housing price in terms of its relations, considering the limitations and advantages of the methods. Currently, there are many real estate agencies that publish different housing information in Zhuhai, most of them on websites advertising housing. It is preferable to integrate all these data to take advantage of big data frameworks and to identify more meaningful results on the spatial distribution and determining factors of housing prices in the future. Secondly, this research only simplifies analyze the mechanism that MGWR doesn’t have a significantly different result from GWR in Zhuhai. Future research can explore more in this topic for better applying MGWR model.
In the future, we can establish specific spatial statistics to estimate the function score and the influence range for different types of neighborhood features, and select more accurate nonlinear functions of the field. Additionally, because of a lack of data and the difficulties associated with the Zhuhai road network, this paper only uses Euclidean distance (ED) instead of road network distance in the impact of spatial accessibility. Most previous studies defined spatial relationships between observations based on ED, which is a good fit for geographic phenomena that only relate to ED. For more complex housing price distribution, however, ED might not be able to well represent the spatial relationships between properties, whereas other cost distance measures, such as network distance and travel time, might perform better. Furthermore, the location data was collected in spherical form instead of projected form. This is feasible in local-scale research at the city level. However, projected coordinate system is recommended in global research.
Acknowledgment
The author would like to express appreciations to Dr. Yongze Song, Yufeng He, Xiang Ye, Peng Luo and all the colleagues from Z_GIS, University of Salzburg and Department of Geoinformatics, Palacký University Olomouc. Special acknowledgement is given to the Erasmus+< program, offering a full scholarship to the first author for completing his joint master degree in Europe.
Disclosure statement
No potential conflict of interest was reported by the author(s).
Data availability statement
The Zhuhai housing price dataset that supports this study is openly available at:
https://drive.google.com/drive/folders/1WyYHlA_-yjMNQfS4a1_E-rVKcStlM_uU?usp=sharing
Additional information
Funding
Notes on contributors

Nianhua Liu
Nianhua Liu is a master student from Z_GIS, University of Salzburg and Geoinformatics, Palacký University Olomouc. He is pursing Erasmus Mundus Joint Master Degree, majoring in Copernicus Master in Digital Earth program. He gets full scholarship from European Union under the Erasmus+ Programme. He holds Bachelor degree in Geographical Information Science from Sun Yat-Sen University.

Josef Strobl
Prof Josef Strobl is Professor at the University of Salzburg, leading the Interfaculty Department of Geoinformatics. He holds degrees in Geography from Vienna University and has been teaching GIScience and related subjects at universities worldwide. He is a full member of the Austrian Academy of Sciences and head of its Commission for Geographic Information Science. Serving as a board member for international organizations like GSDI, ISDE and GISIG and on the editorial boards of leading journals in Geoinformatics and GIScience, he is promoting and spearheading various SDI-related initiatives.
Josef Strobl works with researchers focusing on distance education, spatial analysis and distributed architectures for SDI. Current interests aim at real time and mobile services, terrain analysis and dynamic process modeling, fostering applications in planning, public participation and resource management. Prof. Strobl has been instrumental in developing and implementing the worldwide UNIGIS postgraduate distance learning programme, and is working with a global network of partner institutions towards education, curriculum development, basic and applied research in Geographic Information Science.
References
- Akaike, H. (1974). A new look at the statistical model identification. IEEE Transactions on Automatic Control, 19(6), 716–723.
- Anselin, L. (1995). Local Indicators of Spatial Association—LISA. Geographical Analysis. 27(2), 93–115.
- Anselin, L. (1998). GIS Research Infrastructure for Spatial Analysis of Real Estate Markets. Journal of Housing Research, 9(1), 113–133.
- Bae, H., & Chung, I. H. (2013). Impact of school quality on house prices and estimation of parental demand for good schools in Korea. KEDI Journal of Educational Policy, 10(1), 43–61.
- Baranzini, A., & Schaerer, C. (2011). A sight for sore eyes: Assessing the value of view and land use in the housing market. Journal of Housing Economics, 20(3), 191–199.
- Bartik, T. J., & Smith, V. K. (1987). Chapter 31 Urban amenities and public policy. Handbook of Regional and Urban Economics, 2, 1207–1254.
- Brunsdon, C., Fotheringham, A. S., & Charlton, M. E. (1996). Geographically Weighted Regression: A Method for Exploring Spatial Nonstationarity. Geographical Analysis. 28(4), 281–298.
- Bureau, Z. S. (2020). Zhuhai Statistical Yearbooks 2019. China Statistics Press, Zhuhai, Guangdong, China, (Ed.).
- Burnham, K. P., & Anderson, D. R. (2004). Multimodel Inference:Understanding AIC and BIC in Model Selection. Sociological Methods & Research, 33(2), 261–304.
- Cao, K., Diao, M., & Wu, B. (2018). A Big Data–Based Geographically Weighted Regression Model for Public Housing Prices: A Case Study in Singapore. Annals of the Association of American Geographers, 1–14. doi:10.1080/24694452.2018.1470925
- Cebula, R. (2009). The Hedonic Pricing Model Applied to the Housing Market of the City of Savannah and Its Savannah Historic Landmark District. Review of Regional Studies, 39. doi:10.52324/001c.8197
- Chen, L., & Grant, R. (2021). Built environment, special economic zone, and housing prices in Shenzhen, China. Applied Geography, 129, 102429.
- Clark, D. E., & Herrin, W. E. (2000). The Impact of Public School Attributes on Home Sale Prices in California. Growth and Change, 31(3), 385–407.
- Dai, X., Bai, X., & Xu, M. (2016). The influence of Beijing rail transfer stations on surrounding housing prices. Habitat International, 55, 79–88.
- de Araujo, P., & Cheng, K. (2017). DO PREFERENCES FOR AMENITIES DIFFER AMONG HOME BUYERS? A HEDONIC PRICE APPROACH. Review Urban &Regional Devel, 29(3), 165–184.
- Debrezion, G., Pels, E., & Rietveld, P. (2011). The Impact of Rail Transport on Real Estate Prices:An Empirical Analysis of the Dutch Housing Market. Urban Studies, 48(5), 997–1015.
- Diao, M., & Ferreira, J. (2010). Residential Property Values and the Built Environment: Empirical Study in the Boston, Massachusetts, Metropolitan Area. Transportation Research Record, 2174(1), 138–147.
- Dubé, J., Thériault, M., & Des Rosiers, F. (2013). Commuter rail accessibility and house values: The case of the Montreal South Shore, Canada, 1992–2009. Transportation Research Part A: Policy and Practice, 54, 49–66.
- Dziauddin, M. F. (2019). Estimating land value uplift around light rail transit stations in Greater Kuala Lumpur: An empirical study based on geographically weighted regression (GWR). Research in Transportation Economics, 74, 10–20.
- Fotheringham, C. M. E., & Brunsdon, C. (1998). Geographically Weighted Regression: A Natural Evolution of the Expansion Method for Spatial Data Analysis. Environment and Planning A: Economy and Space, 30(11), 1905–1927.
- Fotheringham, Y. W., & Kang, W. (2017). Multiscale Geographically Weighted Regression (MGWR). Annals of the American Association of Geographers, 107(6), 1247–1265.
- Gatto, M. (2000). Pricing Biodiversity and Ecosystem Services: The Never-Ending Story. BioScience, 50, 347–355.
- Gelfand, A. E., Ghosh, S. K., Knight, J. R., & Sirmans, C. F. (1998). Spatio-Temporal Modeling of Residential Sales Data. Journal of Business and Economic Statistics, 16(3), 312–321.
- Geng, J., Cao, K., Yu, L., & Tang, Y. (2011). Geographically Weighted Regression model (GWR) based spatial analysis of house price in Shenzhen. Proceedings - 2011 19th International Conference on Geoinformatics, Geoinformatics 2011, Shanghai, China, 1–5. doi:10.1109/GeoInformatics.2011.5981032
- Gollini, I., Lu, B., Charlton, M., Brunsdon, C., & Harris, P. (2015). GWmodel: An R Package for Exploring Spatial Heterogeneity Using Geographically Weighted Models. Journal of Statistical Software, 63(17), 1–50.
- Golub, A., Guhathakurta, S., & Sollapuram, B. (2012). Spatial and Temporal Capitalization Effects of Light Rail in Phoenix:From Conception, Planning, and Construction to Operation. Journal of Planning Education and Research, 32(4), 415–429.
- Hanink, D. M., Cromley, R. G., & Ebenstein, A. Y. (2012). Spatial Variation in the Determinants of House Prices and Apartment Rents in China. The Journal of Real Estate Finance and Economics, 45(2), 347–363.
- Harris, P., Fotheringham, A. S., & Juggins, S. (2010). Robust Geographically Weighted Regression: A Technique for Quantifying Spatial Relationships Between Freshwater Acidification Critical Loads and Catchment Attributes. Annals of the Association of American Geographers, 100(2), 286–306.
- Harris, R., Dong, G., & Zhang, W. (2013). Using Contextualized Geographically Weighted Regression to Model the Spatial Heterogeneity of Land Prices in Beijing, China. Transactions in GIS, 17(6), 901–919.
- He, Y., Sheng, Y., Jing, Y., Yin, Y., & Hasnain, A. (2020). Uncorrelated Geo-Text Inhibition Method Based on Voronoi K-Order and Spatial Correlations in Web Maps. ISPRS International Journal of Geo-Information, 9(6), 381.
- Helbich, M., Brunauer, W., Vaz, E., & Nijkamp, P. (2014). Spatial Heterogeneity in Hedonic House Price Models: The Case of Austria. Urban Studies, 51(2), 390–411.
- Horrace, W. C., & Oaxaca, R. L. (2006). Results on the bias and inconsistency of ordinary least squares for the linear probability model. Economics Letters, 90(3), 321–327.
- Hui, E. C. M., Chau, C. K., Pun, L., & Law, M. Y. (2007). Measuring the neighboring and environmental effects on residential property value: Using spatial weighting matrix. Building and Environment, 42(6), 2333–2343.
- Jang, M., & Kang, C.-D. (2015). Retail accessibility and proximity effects on housing prices in Seoul, Korea: A retail type and housing submarket approach. Habitat International, 49, 516–528.
- Jim, C. Y., & Chen, W. Y. (2010). External effects of neighbourhood parks and landscape elements on high-rise residential value. Land Use Policy, 27(2), 662–670.
- Lan, F., Wu, Q., Zhou, T., & Da, H. (2018). Spatial Effects of Public Service Facilities Accessibility on Housing Prices: A Case Study of Xi’an, China. Sustainability, 10(12), 4503.
- Leong, -Y.-Y., & Yue, J. C. (2017). A modification to geographically weighted regression. International Journal of Health Geographics, 16(1), 11.
- Li, Q. Z., & Shi, X. (2020). Decoding spatiotemporal patterns of urban land sprawl in Zhuhai, China. Applied Ecology and Environmental Research, 18, 913–927.
- Liang, X., Liu, Y., Qiu, T., Jing, Y., & Fang, F. (2018). The effects of locational factors on the housing prices of residential communities: The case of Ningbo, China. Habitat International, 81, 1–11.
- Limsombunchai, V., Gan, C., & Lee, M. (2004). House Price Prediction: Hedonic Price Model vs. Artificial Neural Network. American Journal of Applied Sciences, 1. doi:10.3844/ajassp.2004.193.201
- Liu, N., & Zhi, H. (2019). Housing Impact of the Hong Kong-Zhuhai-Macao Bridge on Second-Hand Housing Prices in Zhuhai. Paper presented at the The 2nd International Conference on Urban Informatics, Hong Kong, China.
- Lu, B., Brunsdon, C., Charlton, M., & Harris, P. (2017). Geographically weighted regression with parameter-specific distance metrics. International Journal of Geographical Information Science, 31(5), 982–998.
- Lu, B., Charlton, M., Harris, P., & Fotheringham, A. S. (2014). Geographically weighted regression with a non-Euclidean distance metric: A case study using hedonic house price data. International Journal of Geographical Information Science, 28(4), 660–681.
- Nilsson, P. (2014). Natural amenities in urban space – A geographically weighted regression approach. Landscape and Urban Planning, 121, 45–54.
- O’Sullivan, D. (2003). Geographically Weighted Regression: The Analysis of Spatially Varying Relationships, by A. S. Fotheringham, C. Brunsdon, and M. Charlton. John Wiley & Sons, 35(3), 272–275.
- Osland, L. (2010). An Application of Spatial Econometrics in Relation to Hedonic House Price Modeling. Journal of Real Estate Research, 32, 289–320.
- Pace, R. K., Barry, R., Clapp, J. M., & Rodriquez, M. (1998). Spatiotemporal Autoregressive Models of Neighborhood Effects. The Journal of Real Estate Finance and Economics, 17(1), 15–33.
- Rosen, S. (1974). Hedonic Prices and Implicit Markets: Product Differentiation in Pure Competition. Journal of Political Economy, 82(1), 34–55.
- Shabana, Ali, G., Bashir, M. K., & Ali, H. (2015). Housing valuation of different towns using the hedonic model: A case of Faisalabad city, Pakistan. Habitat International, 50, 240–249.
- Sheng, N., & Tang, U. W. (2013). Zhuhai. Cities, 32, 70–79.
- So, H. M., Tse, R. Y. C., & Ganesan, S. (1997). Estimating the influence of transport on house prices: Evidence from Hong Kong. Journal of Property Valuation and Investment, 15(1), 40–47.
- Tse, R. Y. C. (2002). Estimating Neighbourhood Effects in House Prices: Towards a New Hedonic Model Approach. Urban Studies, 39(7), 1165–1180.
- Wang, J., Lee, C. L., & Shirowzhan, S. (2021). Macro-Impacts of Air Quality on Property Values in China—A Meta‐Regression Analysis of the Literature. Buildings, 11, 48.
- Wei, Y., Lam, P. T. I., Chiang, Y. H., & Leung, B. Y. P. (2014). The Changing Real Estate Supply and Investment Patterns in China: An Institutional Perspective on Affordable Housing. Berlin, Heidelberg. Springer.
- Wen, H., Xiao, Y., Hui, E. C. M., & Zhang, L. (2018). Education quality, accessibility, and housing price: Does spatial heterogeneity exist in education capitalization? Habitat International, 78, 68–82.
- Wen, H., Xiao, Y., & Zhang, L. (2017a). School district, education quality, and housing price: Evidence from a natural experiment in Hangzhou, China. Cities, 66, 72–80.
- Wen, H., Xiao, Y., & Zhang, L. (2017b). Spatial effect of river landscape on housing price: An empirical study on the Grand Canal in Hangzhou, China. Habitat International, 63, 34–44.
- Wen, H., Zhang, Y., & Zhang, L. (2014). Do educational facilities affect housing price? An empirical study in Hangzhou, China. Habitat International, 42, 155–163.
- Wen, H., Zhang, Y., & Zhang, L. (2015). Assessing amenity effects of urban landscapes on housing price in Hangzhou, China. Urban Forestry & Urban Greening, 14(4), 1017–1026.
- Wheeler, D. C., & Páez, A. (2010). Geographically Weighted Regression. In M. M. Fischer & A. Getis (Eds.), Handbook of Applied Spatial Analysis: Software Tools, Methods and Applications (pp. 461–486). Berlin, Heidelberg: Springer Berlin Heidelberg.
- Wu, C., Ye, X., Du, Q., & Luo, P. (2017). Spatial effects of accessibility to parks on housing prices in Shenzhen, China. Habitat International, 63, 45–54.
- Xian, S., Li, L., & Qi, Z. (2019). Toward a sustainable urban expansion: A case study of Zhuhai, China. Journal of Cleaner Production, 230, 276–285.
- Yang, L., Zhou, J., Shyr, O. F., & Huo, D. (2019). Does bus accessibility affect property prices? Cities, 84, 56–65.
- Yeung, Y.-M., Lee, J., & Kee, G. (2009). China’s Special Economic Zones at 30. Eurasian Geography and Economics, 50(2), 222–240.
- Zhang, L., Zhou, J., & Hui, E. C.-M. (2020). Which types of shopping malls affect housing prices? From the perspective of spatial accessibility. Habitat International, 96, 102118.
- Zheng, M. (2014). An Empirical Evaluation of OLS Hedonic Pricing Regression on Singapore Private Housing Market. Master of Science Thesis submitted to Royal Institute of Technology, Stockholm, Sweden. doi:10.13140/RG.2.2.24071.24484
- Zhou, J.-Y., Pan, W.-T., & Zhuang, M.-E. (2019). Research on Housing Price Factors of Zhuhai City:Under the background of the Opening of Hong Kong - Zhuhai - Macao Bridge. Journal of Economics and Business, 2. doi:10.31014/aior.1992.02.02.100