
 ?Mathematical formulae have been encoded as MathML and are displayed in this HTML version using MathJax in order to improve their display. Uncheck the box to turn MathJax off. This feature requires Javascript. Click on a formula to zoom.
ABSTRACT
The reliable knowledge of seasonal snow volume and its trend is very important to understand Earth’s climate system. Thus, a long-time snow water equivalent (SWE) dataset is necessary. This work presents a daily SWE product of 1980–2020 with a linear unmixing method through passive microwave data including SMMR, SSM/I and SSMIS over China after cross-calibration and bias-correction. The unbiased root-mean-square error of snow depth is about 5–7 cm, corresponding to 10–15 mm for SWE, when compared with stations measurements and field snow course data. The spatial patterns and trends of SWE over China present significant regional differences. The overall slope trend presented an insignificant decreasing pattern during 1980–2020 over China; however, there is an obvious fluctuation, i.e. a significant decrease trend during the period 1980–1990, an upward trend from 2005 to 2009, a significant downward trend from 2009 to 2018. The increase of SWE occurred in the Northeast Plain, with an increase trend of 0.2 mm per year. Whereas in the Hengduan Mountains, it presented a downward trend of SWE, up to −0.3 mm per year. In the North Xinjiang, SWE has an increasing trend in the Junggar Basin, while it shows a decreasing trend in the Tianshan and Altai Mountains.
1. Introduction
Approximately one-third of the Earth’s land surface is covered seasonally by snow, and up to 50% of the Northern Hemisphere lands surface has snow cover during the winter (Bormann, Brown, Derksen, & Painter, Citation2018). Snow cover has great influence on global and regional energy, water, and carbon cycles. There are three main continuous snow regions with seasonal snow cover in China, including Qinghai-Tibetan Plateau (QTP), northern Xinjiang (NXJ), northeast China (NE), and the snow cover extent in winter of these three regions covers 27% the total area of China (Huang et al., Citation2016). Especially in the QTP and Xinjiang as semi-arid regions of China, the snowmelt water plays a very important role in agriculture and water supply (Qin et al., Citation2020; Wang, Huang, Wang, Zhou, & Liang, Citation2019). The change in snow cover conditions can have serious economic and social impacts. Snow water equivalent (SWE) describes the amount of water contained in snowpack when it is completely melted. Hence, the knowledge of snow water equivalent is essential in the assessment of the energy and water cycle in the climate system, in validating General Circulation Models (GCM) snow cover simulations and for hydrology and water resource planning. Under the global climate change conditions, the spatial-temporal snow variability in China is a direct response to global climate change. Therefore, it is necessary to have a long time series of snow water equivalent data to study its response to the climate change, including snow water storage and snow cover extent area variation.
It is still difficult to predict SWE variability over large and remote areas due to the high spatial and temporal variability of the snowpack and the lack of in situ data. Passive microwave remote sensing has the capability to obtain SWE information at regional or global scales (Chang et al., Citation1987; Derksen, Walker, & Goodison, Citation2005; Foster et al., Citation1997; Kelly, Citation2009; Takala et al., Citation2011; Jiang, Wang, Zhang, Yang, & Yang, Citation2014; Pulliainen et al., Citation2020). It has been almost four decades to estimate SWE from space-borne passive microwave observations since the first operational radiometer in space, the Scanning Multichannel Microwave Radiometer (SMMR) aboard the National Aeronautics and Space Administration (NASA) Nimbus-7 satellite. The most widely used algorithm was built based on the relationship of brightness temperature difference between 19 GHz and 37 GHz and snow depth or SWE (Chang et al., Citation1987). The emission at lower frequency channel (19 GHz) from dry snow is mainly affected by the properties of the soil background and snow, while the snow emission at higher frequency (37 GHz) is sensitive to snow mass and grain size (Shi et al., Citation2016). Derksen et al. (Citation2005) developed a land sensitivity SWE retrieval algorithms with an unmixed method in Canada. Che, Xin, Jin, Armstrong, and Zhang (Citation2008) modified Chang’s algorithm using the ground measurements of 2003 for SSM/I, then generated a dataset of snow depth from 1980 to 2019. Chang et al. (Citation2009) developed an empirical snow depth algorithm using AMSR-E, by incorporating MODIS 8-day snow fraction data at 0.05 degree grid. Jiang et al. (Citation2014) developed snow depth retrieval algorithms with mixed pixel method for Fengyun-3B (FY3B) meteorological satellite in China. Jiang et al (Citation2014) modified the FY-3B retrieval algorithms, and established regional algorithms in Xinjiang, Northeast of China, and other areas for the FY-3D satellite.
Currently, the European Space Agency (ESA) released GlobSnow v3.0 snow water equivalent dataset (Luojus, Pulliainen, Takala, Lemmetyinen, & Moisander, Citation2021; Pulliainen et al., Citation2020). It includes time series of 1980–2018 Northern Hemisphere terrestrial (non-mountainous) snow water equivalent data derived from the Nimbus-7 satellite’s SMMR, the Special Sensor Microwave/Imager (SSM/I) and Special Sensor Microwave Imager Sounder (SSMIS) aboard the Defense Meteorological Satellite Program (DMSP) series of satellites. In addition, the Advanced Microwave Scanning Radiometer for Earth Observing System (AMSR-E) on board the NASA Aqua satellite, the Advanced Microwave Scanning Radiometer 2 (AMSR2) onboard the Global Change Observation Mission 1-Water (GCOM-W1) satellite by the Japan Aerospace Exploration Agency (JAXA), and Microwave Radiation Imager onboard the Fengyun-3 satellites (FY-3/MWRI) could provide SWE data during the satellite operation since 2002, 2012 and 2010, respectively. Therefore, in order to generate a long series of SWE data, SMMR and SSMI, SSMIS sensors’ observations are necessary. In China, Che et al. (Citation2008) provides snow depth data in China from 1980 to 2019 with the improved Chang’s algorithm in http://westdc.westgis.ac.cn. Through the validation in China, none of GlobSnow SWE and AMSR2 products could estimate snow depth and SWE accurately over China because they were calibrated globally may not performed as well as one calibrated regionally (Yang and Jiang et al., Citation2019a; Yang et al., Citation2020). While Che’s snow depth data have improved a lot in China, it still can be improved with more ground measurements of China involved in the SWE estimates from satellite passive microwave sensors.
From the work of Pulliainen et al. (Citation2020), they derived hemispheric-scale and five regions of interest trends of seasonal snow mass for 1980–2018. There are different trends derived for these five regions, such as that snow mass has increased across large portions of Siberia, while loss of snow mass is evident in Europe, in large portions of Yukon/Alaska, and in regions around Hudson Bay. Hence, it is necessary to analyze the snow mass trends and patterns in regional-scale, e.g. China. Qin et al. (Citation2006) presented the spatial and temporal variabilities of the western China snow cover from 1951 and 1997 with 10-yr SMMR 6-day snow depth, NOAA weekly snow extent, and the daily snow depth from 106 selected meteorological stations in western China. Their results show that western China did not experience a continuous decrease in snow cover during the great warming period of the 1980s and 1990s. Che et al. (Citation2019) found that the snow cover days and depth decreased during the period 1980–2018 in the Qinghai-Tibetan Plateau, especially after the year of 2000. Both of them derived a little bit different results with different data sources and different periods. Xiong, Yao, Shi, Lei, and Pan (Citation2019) found the snow melt onset time in the majority of High Mountain Asia occurs earlier, except in the Karakorom Mountains and a part of the West Kunlun Mountains. Most of their work focused on QTP or western China. Therefore, in order to understand the snow mass change in China, it is necessary to analyze the snow mass variability from long time series of SWE data.
In this work, we present a time series of 1980–2020 SWE data, with the support of China snow survey project by Wang et al. (Citation2018). This SWE data were derived from the production of estimated snow depth and snow density in China. Snow depth in each grid-cell was estimated with a semi-empirical model with the linear unmixing method (Jiang et al., Citation2014; Yang et al., Citation2018) by the sum of values from three individual land cover algorithms, weighted by land cover fraction. And snow density was parameterized through the weather station measurements and snow courses during the winter of 2017–2019. Based on these data, we analyzed the temporal-spatial variability of snow in China during 1980–2020. This work is organized as follows: Section 2 presents the methodology and data used in this work; Section 3 evaluated the snow water equivalent data with ground measurements; then presents the spatial variability characteristic of SWE in China; the last part is the summary.
2. Methods
2.1. Data
2.1.1. Weather station measurements and snow course data
In situ snow depth measurements were from the weather stations and field survey course in China (). The daily weather station measurements during the period 1980–2020 were provided by the National Meteorological Information Centre, China Meteorology Administration. The measured snow parameters are snow depth (daily) and snow pressure (every five-day), namely SWE. The dataset of daily station measurements can be accessed by scientific researchers through the submission of an application (http://data.cma.cn/en). The field snow campaign supported by the Chinese snow survey project was conducted from 2017 to 2019 winter months, and provides an important validation dataset for this study This dataset can be available from the corresponding author on request (Wang et al., Citation2018). Along these six snow courses (, colored lines), a large number of snow pits were measured every 10 to 20 km. The recorded parameters include snow depth, density, air temperature, and the stratigraphy of the snowpack. There are three stable snow cover areas in winter months across China, including NXJ, NE, and the QTP. Thus, two snow courses were, respectively, designed in each snow cover areas to survey snow characteristics (). There were total six snow courses measurements during the periods 2017/2018 and 2018/2019. However, snow courses 3 and 4 located in the QTP were only conducted several days measurements during 2017/2018 winter with very shallow, wet and patchy snow. Hence, these data on snow course 3 and 4 are not used for validation. The specific parameters in each available course are shown in . These two datasets are available from the corresponding authors on request.
Figure 1. Spatial distribution of (a) meteorological stations and field snow courses; (b) land use types over China.
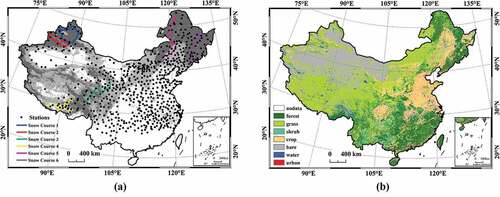
Table 1. The main parameters measured along these four snow survey courses (conducted from December 2017 to May 2019).
To transfer snow depth to SWE, snow density is necessary. In global SWE product, a fixed snow density (240 kg/m3), e.g. GlobSnow-2 product, or mean values for each snow class (Sturm, Holmgren, & Liston, Citation1995), e.g. AMSR-E product, were utilized. We also attempted to adopt a dynamic model (Sturm et al., Citation2010) to provide the spatiotemporal varied snow densities for calculating SWE. However, there are large differences between the station observations and model’s estimates over China (Yang et al., Citation2020). Based on weather station and snow course data (Yang et al., Citation2019a), the average snow densities span from 160 kg/m3 to 190 kg/m3. Thus, we applied a mean snow density, 180 kg/m3, to transfer snow depth to SWE in this study.
2.1.2. Satellite observations
Owing to the similar configurations and inter-sensor calibrations between the SSM/I and SSMIS, thus these instruments are selected to provide brightness temperature data from 1987 to 2020 (https://nsidc.org/data/NSIDC-0032/versions/2). The brightness temperature data during the period 1980–1987 were acquired from the SMMR on board the Nimbus-7 Pathfinder satellite (https://nsidc.org/data/NSIDC-0071/versions/1). The SMMR, SSM/I and SSMIS Equal-Area Scalable Earth-Grid (EASE-Grid) brightness temperature product at 25 km × 25 km resolution were used in this study. shows the comparison among SMMR, SSM/I and SSMIS radiometers used in this study.
Table 2. Summary of the main passive microwave remote sensing sensors. The letter “A” and “D” represent ascending and descending, respectively.
To maintain the maximum consistency of snow depth estimates between SSM/I and SSMIS, we conducted an intercalibration of radiometer brightness temperature between SMMR and SSM/I (Dai, Che, & Ding, Citation2015), and SSM/I and SSMIS (Yang et al., Citation2019b). To obtain the spatial coverage of snow depth across China, the ascending and descending overpass data were combined, but overpass data at night have priority. The basic rules are as following: (a) cold overpass data (ascending for F08-SSM/I; descending for others) are used first if both ascending and descending data are all available, in order to avoid the influence of wet snow on snow depth estimates; (b) warm overpass data are used to fill the gaps of cold overpass orbits; (c) after mentioned above two steps, the previous and next days’ data are used to achieve full spatial coverage if there are still existing gaps.
2.1.3. Auxiliary data
In this paper, a linear unmixing algorithm was used to generate a 40-year snow depth dataset from 1980 to 2020. To develop the linear unmixing algorithm, the land cover fraction data are necessary. 1- km land use data () is freely available in the Data Center for Resources and Environmental Sciences, Chinese Academy of Sciences (http://www.resdc.cn). It was derived from 30 m Thematic Mapper (TM) imagery classification. The main land cover types consist of grassland, barren, farmland, forest, water body, and construction. Then, the land cover fraction at 25 km × 25 km scale was recalculated as the ratio of number of a specific land type pixel (1 km × 1 km) to the total pixels (625). To reduce the effects of water bodies and artificial structures on passive microwave radiometry, the satellite pixels where the total fraction (farmland, barren, grass, and forest) is lower than 60% were filter out.
2.2. Methodology
In this paper, we applied a semi-empirical model with the linear unmixing method (hereafter, called LUM algorithm) designed for China’s snow cover (Jiang et al., Citation2014; Yang et al., Citation2018) to estimate snow depth. Then, a parameterized snow density (180 kg/m3) (Yang et al., Citation2019a) was used to transfer snow depth to SWE according to the ground-based measurements. A satellite passive microwave pixel usually covers several land use types due to its coarse spatial resolution. Thus, the mixed-pixel problem is challenging the snow depth retrieval with satellite passive microwave data (Derksen et al., Citation2005; Jiang et al., Citation2014). The LUM algorithm was originally built using SSM/I data, thus, three frequencies, 19.35 GHz, 37 GHz, and 85.5 GHz (subsequently, 91.655 GHz for SSMIS) were used for the regressions of empirically derived algorithms (Yang et al., Citation2018). Typically, the 19.35 GHz channel is sensitive to underground soil, while 37 GHz reflects on the volume scattering of snowpack to radiation emitted from the soil. Previous studies also demonstrated that the higher frequency, i.e. 85.5 GHz, is more suitable to estimate snow depth for shallow (< 5 cm) or fresh snowpack than the 36.5 GHz channel (Jiang et al., Citation2014; Pan, Durand, Vander Jagt, & Liu, Citation2017). Considering that the snow cover across China is usually shallow, e.g. with a mean value of 5–10 cm (Huang et al., Citation2016; Wang et al., Citation2019; Yang et al., Citation2020), thus, 85.5 GHz was used in the LUM algorithm. The LUM algorithm was represented as:
where ff denotes the land cover fraction; the sub-indices grassland, forest, and cropland refer to the land cover types; here, it should be noted that the shrub is included in forest, and barren in cropland. SDxxxx represents the snow depth in a pure pixel where land cover fraction is greater than 85%. The pure-pixel functions were described as:
where the Tb represents the brightness temperature; V, H are vertical and horizontal polarization respectively. For example, Tb19H37H means brightness temperature difference between 19.35 GHz and 37 GHz at H-pol. The coefficients were fitted based on weather station measurements and satellite Tb observations in the pure pixels during the period 1987–2004.
Owing to absence of 85.5 GHz for SMMR instrument, we directly used the improved Chang algorithm proposed by Che et al. (Citation2008) to retrieve snow depths during the period 1980–1987. This algorithm only used two frequencies, 19.35 GHz and 37 GHz, and was applied to generate long-term snow depth product (http://data.casnw.net/portal).
In this paper, our goal is to develop a time series (1980–2020) of snow depth and SWE that the accuracy can meet the requirements of hydrological applications and climate studies. Thus, five steps were carried out to improve SWE estimates. First, the sensor-cross correction in brightness temperature was done based on the linear relationships among SMMR, SSM/I and SSMIS (Dai et al., Citation2015; Yang et al., Citation2019b). Second, atmospheric correction to satellite observed brightness temperature for 36.5 GHz and 89 GHz was done using Qiu et al. (Citation2021) method, which partially reduces the SWE estimates’ errors. Third, the grid snow depth was estimated using the LUM algorithm. Fourth, we adopted a large number of first-hand data (weather station measurements from 1980 to 2020) to correct the snow depth estimates, namely, bias correction proposed by Pulliainen et al. (Citation2020). There are two steps conducting the bias correction. First, a monthly site-based bias in each year was calculated:
where i denotes the pixel responding to the weather station; Ni is the number of samples within a month, SDestimated is snow depth retrieved by function (1); SDmeasured is the ground truth snow depth, from weather station. To obtain pixel-based bias distribution from site-based values calculated by the function (5), an ordinary kriging interpolation was used in snow-covered areas over China. Then, we used the monthly bias to correct the snow depth estimates:
where y denotes the year (1980–2020); m denotes the month; j is the jth pixel; and Biasy,m,j is from the kriging interpolation. Finally, the SWE was calculated by multiplication of the estimated snow depth by the LUT algorithm and snow density.
Through comparison of seven passive microwave snow cover mapping techniques in our previous work (Liu et al., Citation2018), we found the snow detection method (Li, Liu, Zhu, Zheng, & Chen, Citation2007) applied to Fengyun-3 microwave radiation imager showed best performance in China. It is well known, the PMW remote sensing is suitable for retrieving SWE and snow depth in dry snow conditions (Chang et al., Citation1987). Thus, a wet snow detection method (; Walker & Goodison, Citation1993) was used to provide the quality flag on SWE product.
3. Data records
The dataset provided in this paper consists of two parts – the quick-view image and the SWE product. The quick-view images are stored in PNG format, can be used to quickly understand the distribution of SWE over China. The SWE product is daily gridded SWE at azimuthal equal-area cylindrical grid coordinates with the spatial resolution of 25 km (EASE-GRID). This long-term SWE dataset can meet the requirements of climate change studies, and global water cycle applications. The dataset is available at http://www.doi.org/10.11922/sciencedb.j00076.00071.
The SWE product’s naming convention is “SATELLITE_SENSOR_SWE_YYYYMMDD_DAILY_025 KM_V1.2.h5”. The “SATELLITE” serves as the satellite platform, e.g. DMSP-F17. The “SENSOR” is the type of radiometer, e.g. SSMIS. “SWE” is the abbreviation of snow water equivalent. The file name variables “YYYYMMDD” denote the date stamp, for example, 20200101. The “daily” means the revisit time. The “025KM” denotes the spatial resolution. The “V1.2” is the product version. The pixel values in the H5 files have specific meanings: “0–240” represents the effective value of SWE, and the units of SWE is mm; “250” is for dry snow, “251” is for wet snow, “252” is for the free snow, “253” is for the water body, “254” means missing data and “255” is for outside China. To position the pixel location, the latitude and longitude matrices were also included in the H5 file. The detail information of our SWE dataset is summarized in .
Table 3. The information of the SWE product provided by this paper.
4. Technical validation and trend analysis
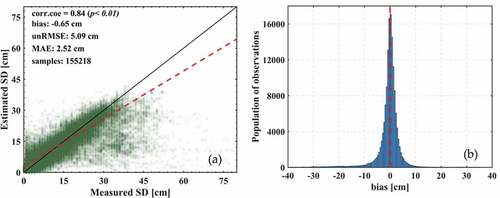
The SWE estimates were compared to the weather station measurements during the period 2011–2019 (). The overall unbiased root mean square error (unRMSE) and bias values are 5.09 cm and −0.65 cm, respectively. The correlation coefficient (corr.coe) is 0.84 (p < 0.01 at 0.05 confidence interval), representing the significant relationship between ground-based measurements and snow depth estimates. Although the overall bias is only −0.65 cm, the SWE product tends to underestimate snow depth for deep snow cover (> 40 cm). However, the number of such cases is small, and therefore not evident in . depicts the histogram of the differences of SWE estimates and station observations. It presents a statistically normal distribution, and the mean value is about 0 cm. The most values of the difference in snow depth span from −10 cm to 10 cm.
Figure 2. Comparison of SWE estimates and weather station measurements.
To determine the interannual variability in the uncertainty, the time series of assessment indexes, including the unRMSE, bias, and corr.coe, are shown in . The results show that the unRMSE ranges from 3.5 cm to 7.8 cm, and fluctuates significantly during the period 2011–2015 (). The bias presents a slight change from year to year. The corr.coe is greater than 0.75 for any season, indicating the estimated snow depth is significantly correlated with the station observation.
Figure 3. Time series (2011–2019) comparison between measured and estimated snow depth data.
Field snow course measurements (), as a type of spatially independent reference data, were also used to assess the SWE estimates. shows the validation results of SWE estimates against snow course observations. The unRMSE values are 5.94 cm, 7.95 cm, and 6.56 cm for snow courses 1, 5, and 6, respectively. For snow course 2, the unRMSE is as high as 15.18 cm. Moreover, it presents serious underestimation, with an overall bias −7.73 cm. The snow course 2 is distributed around the Tianshan mountains where the topography is complex and undulated and thus the representativeness of field measurements is poor. The unRMSE values of snow courses 5 and 6 are higher than that in snow course 1. This is because the northeast China is covered with forest, disturbing the accuracy of SWE product.
Figure 4. Validation of snow depth product with field snow course data during the period 2018–2019.
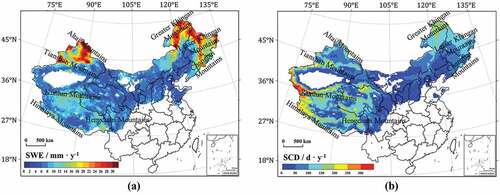
According to the SWE product, the annual (the hydrological year, from September of the current year to August of the next year) averaged SWE during the period 1980–2018 was calculated. As shown in , the spatial patterns of SWE over China present significant regional differences. The SWE is high in the NE, NXJ and the QTP. The maximum SWE estimates are mainly distributed in the Altai Mountains, Tianshan Mountains, the Greater Khingan Mountains and the Lesser Khingan Mountains, where the averaged SWE value is greater than 25 mm. The second highest value of SWE was mainly distributed in the Himalaya Mountains, Kunlun Mountains, Hengduan Mountains and Changbai Mountains, where the average SWE value is more than 15 mm.
shows the spatial distribution of annual average snow cover days (SCD) from 1980 to 2018. The high values of SCD (>120d) are mainly distributed in QTP, NXJ and NE. The magnitude of SCD in NE is obviously correlated with latitude, while it is closely related to altitude in NXJ and QTP areas. In the high-altitude areas such as Tianshan Mountains, Kunlun Mountains and Gangdes Mountains, the SCD value can reach 250 days per year.
Figure 5. Spatial distribution of annual (a) averaged SWE and (b) snow cover days (SCD) during the period 1980–2018.
The spatial distribution of annual SWE slope trends () shows a heterogenous pattern. The significant increase of SWE occurred in the Northeast Plain and Changbai Mountains, as well as some areas of the Lesser Khingan Mountains, and the increase trend there could reach 0.3 mm per year. In the Hengduan Mountains, there is a significant downward trend of SWE, up to −0.4 mm per year, which is similar to the changing trend of SCD (). In NXJ, the SWE has an increasing trend except for the mountain areas, i.e. the upward trend in eastern and western segments of Tianshan Mountains can reach 0.15 mm per year, while the downward trend in central segment of Tianshan Mountains and the Altai Mountains is about −0.2 mm per year.
Figure 6. Spatial distribution of annual (a) SWE and (b) SCD trends from 1980 to 2018 based on slope test. Only areas with trends having a significance level exceeding 95% are shown.
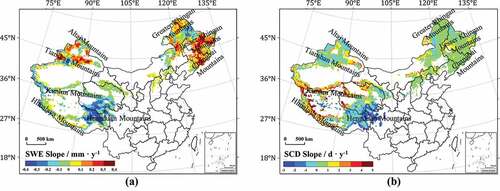
illustrates the spatial distribution of annual snow cover days (SCD) trends by slope test. Areas with significant upward trend are mainly distributed in the west of QTP, including the Gangdise Mountains, the Himalayas, the Karakoram and Kunlun Mountains, with an increasing trend of 5 days per year. In the Altun Mountain and Qilian Mountain areas, it also presents a certain degree of increasing trend, about 3 days per year. Areas with significant reduction trend are mainly distributed in the Hengduan Mountainous Region, where the ratio is about −3 days per year. The SCD in the NE shows a slight upward trend, while the SCD in the NXJ presents a slight downward trend.
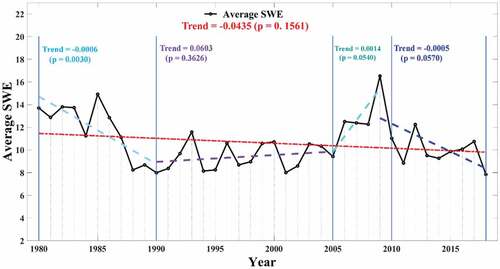
shows that Annual average SWE in China generally presents a slight downward trend from 1980 to 2018. We calculated the average SWE of all pixels in each year, and find that the range is between 8 mm and 17 mm. Two peaks occurred in hydrological year 1985 and 2009. A significant decrease trend (p = 0.0030) occurs during the period 1980–1990, and later a fluctuating change is presented from 1990 to 2005. Owing to the heavy snow in the hydrological year 2009, thus, an increase trend (p = 0.0540) occurs from 2005 to 2009. From 2009 to 2018, there is a downward trend (p = 0.0570). The overall trend is insignificant (p = 0.1561), with a small regression coefficient of −0.0435. Here, it should be noted that own to the different payload configurations of SMMR and SSM/I, the snow cover detection and retrieval algorithms are not inconsistent before and after 1987, maybe affecting the time series variation.
Figure 7. Annual average SWE series of China from 1980 to 2018. Dashed lines represent regression lines of the corresponding SWE series. Trends were considered significant if p < 0.05.
5. Data set value
This paper provides a long-term SWE product from 1980 to 2020 with a semi-empirical linear unmixing algorithm using the space-borne passive microwave observations. The inter-instrument brightness temperature biases among SMMR, SSMI and SSMIS were removed to maintain the consistency of SWE estimates during the period 1980–2020. To improve the accuracy of SWE estimates, a bias correction method based on the ground measurements was applied to revise the SWE estimates. The overall unRMSE of SWE product is about 10–15 mm in China, which can meet the requirement of climate change studies, weather predictions and global water cycle applications.
Data availability
The dataset is openly available in the Science Data Bank at http://www.doi.org/10.11922/sciencedb.j00076.00071.
Acknowledgments
The authors would like to thank the China Meteorological Administration, National Geomatics Center of China, National Snow and Ice Data Center for providing the meteorological station measurements, land cover products, and satellite datasets. The authors also would like to thank all colleagues for assistance with the snow survey field measurements.
Disclosure statement
No potential conflict of interest was reported by the author(s).
Correction Statement
This article has been republished with minor changes. These changes do not impact the academic content of the article.
Additional information
Funding
Notes on contributors

Lingmei Jiang
Lingmei Jiang is currently a professor at Faculty of Geographical Science, Beijing Normal University. She received the Ph.D. degree in geography at Beijing Normal University, China in 2005. Her research interests include microwave emission/scattering modelling of land surface, remote sensing of snow cover and snow water equivalent and remote-sensing data assimilated into land surface model. She has authored/co-authored over 150 scientific publications and has been awarded Shi Yafeng Prize for Young Scientists in Cryosphere and Environment in 2018.
References
- Bormann, K. J., Brown, R. D., Derksen, C., & Painter, T. H. (2018). Estimating snow-cover trends from space. Nature Climate Change, 8(11), 924–928.
- Chang, A., Foster, J. L., & Hall, D. K. (1987). Nimbus-7 SMMR derived global snow cover parameters. Annals of Glaciology, 9, 39–44.
- Chang, S., Shi, J., Jiang, L., Zhang, L., & Yang, H. (2009). Improved snow depth retrieval algorithm in China area using passive microwave remote sensing data. In Proceedings of 2009 IEEE International Geoscience and Remote Sensing Symposium. II, 614-617.
- Che, T., Hao, X., Dai, L., Li, H., Huang, X., & Xiao, L. (2019). Snow cover variation and its impacts over the Qinghai-Tibet Plateau. Bulletin Chinese Academy of Science, 34, 1247–1253.
- Che, T., Xin, L., Jin, R., Armstrong, R., & Zhang, T. (2008). Snow depth derived from passive microwave remote-sensing data in China. Annals of Glaciology, 49(1), 145–154.
- Dai, L., Che, T., & Ding, Y. (2015). Inter-calibrating SMMR, SSM/I and SSMI/S data to improve the consistency of snow-depth products in China. Remote Sensing, 7(6), 7212–7230.
- Derksen, C., Walker, A., & Goodison, B. (2005). Evaluation of passive microwave snow water equivalent retrievals across the boreal forest/tundra transition of western Canada. Remote Sensing of Environment, 96(3–4), 315–327.
- Foster, J. L., Chang, A., & Hall, D.K. (1997). Comparison of snow mass estimates from a prototype passive microwave snow algorithm, a revised algorithm and a snow depth climatology. Remote Sensing of Environment, 62, 132–142.
- Huang, X., Deng, J., Ma, X., Wang, Y., Feng, Q., Hao, X., & Liang, T. (2016). Spatiotemporal dynamics of snow cover based on multi-source remote sensing data in China. The Cryosphere, 10(5), 2453–2463.
- Jiang, L., Wang, P., Zhang, L., Yang, H., & Yang, J. (2014). Improvement of snow depth retrieval for FY3B-MWRI in China. Science China Earth Sciences, 57(6), 1278–1292.
- Kelly, R. (2009). The AMSR-E snow depth algorithm: Description and initial results. Journal of the Remote Sensing Society of Japan, 29(1), 307–317.
- Li, X., Liu, Y., Zhu, X., Zheng, Z., & Chen, A. (2007). Snow cover identification with SSM/I data in China. Journal of Applied Meteorological Science, 18, 12–20.
- Liu, X., Jiang, L., Wu, S., Hao, S., Wang, G., & Yang, J. (2018). Assessment of methods for passive microwave snow cover mapping using FY-3C/MWRI data in China. Remote Sensing, 10(4), 524.
- Luojus, K., Pulliainen, J., Takala, M., Lemmetyinen, J., & Mortimer, C., Derksen, C., Mudryk, L., .Venäläinen, P. (2021). GlobSnow v3.0 Northern Hemisphere snow water equivalent dataset. Scientifc Data, 8, 163.
- Pan, J., Durand, M. T., Vander Jagt, B. J., & Liu, D. (2017). Application of a Markov Chain Monte Carlo algorithm for snow water equivalent retrieval from passive microwave measurements. Remote Sensing of Environment, 192, 150–165.
- Pulliainen, J., Luojus, K., Derksen, C., Mudryk, L., Lemmetyinen, J., Salminen, M., … Smolander, T. (2020). Patterns and trends of Northern Hemisphere snow mass from 1980 to 2018. Nature, 581(7808), 294–298.
- Qin, Y., Abatzoglou, J. T., Siebert, S., Huning, L. S., AghaKouchak, A., Mankin, J. S., … Mueller, N. D. (2020). Agricultural risks from changing snowmelt. Nature Climate Change, 10(5), 459–465.
- Qin, D., Liu, S., & Li, P. (2006). Snow cover distribution, variability, and response to climate change in Western China. Journal of Climate, 19, 1820–1833.
- Qiu, Y., Shi, L., Lemmetyinen, J., Shi, J., & Wang, R. (2021). Atmospheric Correction to Passive Microwave Brightness Temperature in Snow Cover Mapping Over China. IEEE Transactions on Geoscience and Remote Sensing, 59(8), 6482–6495.
- Shi, J., Xiong, C, & Jiang, L. (2016). Review of snow water equivalent microwave remote sensing. Science China: Earth Sciences, 1–15.
- Sturm, M., Holmgren, J., & Liston, G. (1995). A seasonal snow cover classification system for local to global applications, 1995. Journal of Climate, 8(5), 1261–1283.
- Sturm, M., Taras, B., Liston, G., Derksen, C., Jonas, T., & Lea, J. (2010). Estimating regional and global snow water resources using depth data and climate classes of snow. Journal of Hydrometeorology, 11(6), 1380–1394.
- Takala, M., Luojus, K., Pulliainen, J., Lemmetyinen, J., Juha-Petri, K., Koskinen, J., & Bojkov, B. (2011). Estimating northern hemisphere snow water equivalent for climate research through assimilation of space-borne radiometer data and ground-based measurements. Remote Sensing of Environment, 115, 3517–3529.
- Walker, A, and Goodison, B. (1993). Discrimination of a wet snow cover using passive microwave satellite data. Annals of Glaciology, 17, 307–311.
- Wang, J., Che, T., Li, Z., Li, H., Hao, X., Zheng, Z., … Li, L. (2018). Investigation on snow characteristics and their distribution in China. Advances in Earth Science, 33, 12–26.
- Wang, Y., Huang, X., Wang, J., Zhou, M., & Liang, T. (2019). AMSR2 snow depth downscaling algorithm based on a multifactor approach over the Tibetan Plateau, China. Remote Sensing of Environment, 231, 111268.
- Xiong, C., Yao, R., Shi, J., Lei, Y., & Pan, J. (2019). Change of snow and ice melting time in high mountain Asia. Chinese Science Bulletin, 64(27), 2885–2893.
- Yang, J., Jiang, L., Dai, L., Pan, J., Wu, S., & Wang, G. (2019b). The consistency of SSM/I vs. SSMIS and the influence on snow cover detection and snow depth estimation over China. Remote Sensing, 11(16), 1879.
- Yang, J., Jiang, L., Lemmetyinen, J., Luojus, K., Takala, M., Wu, S., & Pan, J. (2020). Validation of remotely sensed estimates of snow water equivalent using multiple reference datasets from the middle and high latitudes of China. Journal of Hydrology, 590, 125499.
- Yang, J., Jiang, L., Wu, S., Liu, X., Wang, G., Hao, S., & Wang, J. (2018). Improvement of snow depth estimation using SSM/I brightness temperature in China. IEEE International Geoscience and Remote Sensing Symposium, Valencia, 5089–5092.
- Yang, J., Jiang, L., Wu, S., Wang, G., Wang, J., & Liu, X. (2019a). Development of a snow depth estimation algorithm over China for the FY-3D/MWRI. Remote Sensing, 11(8), 977.