
 ?Mathematical formulae have been encoded as MathML and are displayed in this HTML version using MathJax in order to improve their display. Uncheck the box to turn MathJax off. This feature requires Javascript. Click on a formula to zoom.
ABSTRACT
As the main components of the atmospheric heat source/sink over the Tibetan Plateau (TP), up-to-date spatiotemporal fields of surface sensible heat flux and latent heat release by precipitation are vital for investigating the local land–atmosphere interaction and the effect of the thermal forcing of the TP on global weather and climate. This study recalculates the long-term daily dataset of surface sensible heat flux and latent heat release of condensation over the TP based on 293 routine meteorological observations, with the latest date being 31 December 2019. Most stations have adequate and valid records during the period 1981–2019, and the results for 1951–1980 are also calculated if the observations are available. Moreover, a brief evaluation of the climatology and long-term variation during 1981–2019 is conducted. By providing the most continuous and longest set of observational surface sensible heat flux and latent heat release of condensation data over the TP with a high degree of credibility, this new dataset will support research concerning the multi-timescale variation of diabatic heating/cooling over the TP and its remote influence. It is openly available on the LASG data-sharing platform (http://data.lasg.ac.cn/TPSHLH/).
1. Introduction
The Tibetan Plateau (TP), also often referred to as “the Third Pole”, plays an important role in the climate of its surrounding regions and even the globe (Boos & Kuang, Citation2010; Ye & Gao, Citation1979; Yeh, Citation1950). The atmospheric heat source/sink over the TP – especially the surface sensible heat flux (SH) and latent heat release of condensation (LH) in the air column – has received widespread concern because of its considerable influence on the Asian monsoon (Chen, Reiter, & Feng, Citation1985; Duan & Wu, Citation2008; Duan et al., 201; Zhao & Chen, Citation2001; Duan, Li, Wang, & Wu, Citation2011; Wu et al., Citation2015) and global climate change (He, Wang, Zhou, & Li, Citation2019).
Unlike the LH in the air column, which can be easily estimated from the precipitation rate, the SH is harder to estimate from observations. It is well known that the SH originates from the turbulent transport in the planetary boundary layer, which cannot be measured directly by satellite instruments. Furthermore, a previous study indicated that the existing reanalysis products show a large uncertainty in the SH over the TP (Wang, Zhou, & Duan, Citation2012). However, despite the inadequate and heterogeneous distribution of routine meteorological stations over the TP, to utilize the records of surface meteorological stations is still a good choice for estimating the SH intensity according to the Monin–Obukhov similarity theory in boundary-layer meteorology (Monin & Obukhov, Citation1954). Following this idea, many previous studies have adopted different parameterization schemes to estimate the SH over the TP (e.g. Chen et al., Citation1985; Feng, Reiter, & Chen, Citation1985; Yang, Qin, Guo, Zhou, & Ma, Citation2009; Ye & Gao, Citation1979).
Three years ago, we released the first version of an atmospheric heat source/sink dataset over the TP based on the routine meteorological observations from the China Meteorological Administration (CMA), together with the radiation fluxes at the surface and the top of the atmosphere derived from satellite data (Duan et al., Citation2018). In this work, we aim to provide an updated dataset of the SH and LH, without including the net radiation flux from the air column. It is worth noting that the number of stations used in the updated version has increased from 80 to 293, and the time span has been extended from 1960–2016 to 1951–2019.
The remainder of the paper is organized as follows: Section 2 introduces the components of the data product and its generation methods. Section 3 gives a preliminary evaluation of the climatological state and the long-term variation of both the SH and LH. Section 4 provides a summary and discussion.
2. Data and methods
2.1. Data source
The raw data source comes from records of routine meteorological observations compiled by the CMA. The 6-hourly variables observed at 0200, 0800, 1400 and 2000 Beijing Standard Time include wind speed at 10 m and ground skin temperature. The daily variables include mean surface pressure, maximum wind speed at 10 m, precipitation amount, mean air temperature, maximum air temperature, and minimum air temperature at 1.5 m.
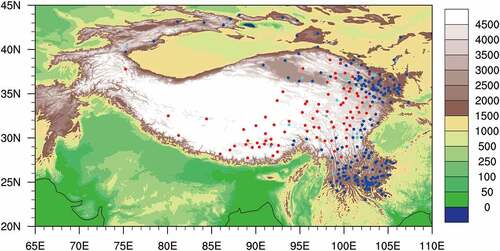
To improve the horizontal resolution, we selected 293 observation stations over the TP. The information for these 293 stations established by the CMA includes the serial number (NO.), identity number (ID) designated by the CMA, name, longitude, latitude, height (unit: m), start date, end date, and missing data percentage (unit: %) from the start date to the end date. The selection criterion of the 293 stations among the 2479 routine meteorological observations of the CMA was that their location had to fall within the domain of (20°–45°N, 65°–110°E) with an altitude above 1500 m.
Figure 1. Spatial distribution of routine surface meteorological stations over the Tibetan Plateau managed by the China Meteorological Administration. Shading denotes the altitude (unit: m). Stations with missing values during 1981–2019 amounting to more than 7.3% are marked in cyan and the others with a percentage below 7.3% are marked in red (altitude above 3000 m) and blue (altitude from 1500 m to 3000 m).
In addition, SH, precipitation and convective heating rate from four widely used reanalysis datasets are compared with the observation estimation presented by our study, including NCEP-DOE reanalysis II (NCEP2; Kanamitsu et al., Citation2002), Japanese 55-year Reanalysis (JRA-55; Harada et al., Citation2016), the Modern-Era Retrospective Analysis for Research and Application version 2 (MERRA2; GMAO, Citation2015) and the latest European Centre for Medium-Range Weather Forecasts (ECMWF) reanalysis product (ERA5; Hersbach et al., Citation2020). The LH in NCEP2 and ERA5 is calculated by the precipitation, and in JRA55 and MERRA2 is estimated by the sum of convective heating rate and large-scale condensation heating rate. The SH and LH from the four reanalysis datasets are interpolated to the 293-observation stations for better comparison.
2.2. Data processing
The similarity theory in boundary-layer meteorology of Monin and Obukhov (Citation1954) provides a bulk transfer equation to estimate the SH, as follows
where is the wind speed at 10 m,
is the ground skin temperature,
is the air temperature at 1.5 m,
is the bulk transfer coefficient of heat,
is the specific heat capacity at constant pressure, and
is the air density, which is estimated by the ideal gas equation,
where is pressure and
is the ideal gas constant. We use the method developed by Yang et al. (Citation2009) to estimate the SH the same as in the dataset produced by Duan et al. (Citation2018). Compared with the constant
in other studies (Chen et al., Citation1985; Feng et al., Citation1985; Ye & Gao, Citation1979; Zhao & Chen, Citation2000), the superiority of the method developed by Yang et al. (Citation2009) is that the diurnal variations of
are taken into account, which is estimated empirically using a high-resolution Tibetan experimental dataset. Hourly variables in EquationEq. (1)
(1)
(1) and (Equation2
(2)
(2) ) are interpolated from 6-hourly and daily observations with a robust statistical relationship between the high-resolution Tibetan experimental data and the routine observations. The daily mean of the SH is the average of the hourly SH across 24 hours every day.
The LH denotes the release of condensation heat when vapor is converted into water in the air column, which should be distinguished from the surface latent heat flux. So, the daily LH is calculated from the daily precipitation rate as follows:
where is the water density,
is the coefficient of condensation heat, and
is the precipitation rate (units:
) (Duan & Wu, Citation2008).
3. Evaluation results
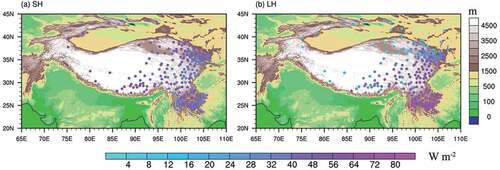
To explore the spatial distribution of the SH and LH over the TP, plots their annual mean intensity at the 268 stations, the percentage of missing values of which are below 7.3% (cyan dots in ), during 1981 to 2019. Generally, the SH over the western and central TP is stronger than that over the eastern TP. As altitude decreases, the SH reduces gradually in the southeastern and eastern slope regions. In contrast, the LH displays an overall opposite pattern compared with the SH, with much weaker intensity over the western and central TP than in the eastern TP. Due mainly to the lower latitude and north–south ridges of the parallel mountains, the LH maximum, with the value exceeding 80 W m−2, occurs in the southeastern corner of the TP, which is also named the Yunan–Guizhou Plateau or referred to as the “low-latitude plateau”.
Figure 2. Spatial distribution of the climatological state in 1981–2019 of the annual mean (a) sensible heat flux and (b) latent heat release of condensation (units: W m−2).
Considering their diverse geographical positions, the 293 stations are further separated into two groups to compare the differences in the annual cycles of SH and LH. The first group, named the “platform group”, includes 79 stations (red points in , dashed lines in ) with altitude above 3000 m; and the second group, named the “slope group” includes 189 stations (blue points in , solid lines in ) with altitude varying from 1500 m to 3000 m.
Figure 3. Annual cycle of the multi-station average climatological state in 1981–2019 of sensible heat flux (red) and latent heat release of condensation (blue) (units: W m−2). Solid lines indicate altitude from 1500 m to 3000 m and dashed lines indicate altitude above 3000 m.
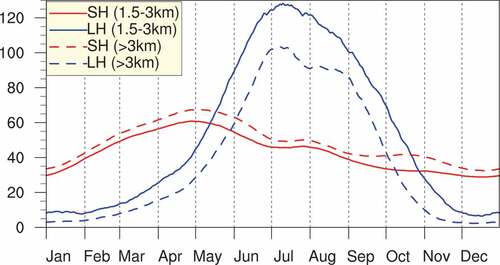
Figure 4. Time series of the station-averaged (a) wind at 10 m (units: m s−1), (b) difference between ground skin temperature and air temperature at 1.5 m (unit: °C), (c) sensible heat flux (units: W m−2), and (d) latent heat release of condensation (units: W m−2). Solid lines indicate altitude from 1500 m to 3000 m and dashed lines indicate altitude above 3000 m.
The daily mean SH and LH are defined as the average between 1981 and 2019 to obtain the annual cycle shown in . In both the platform and slope areas of the TP, the SH peaks in May, while the LH peaks in July. From November to May, SH dominates LH, with the reverse occurring for the rest of the year. It is unsurprising that the LH varies more than the SH during the annual cycle over the TP because the former is closely related to the activity of the Asian summer monsoon. As for the intensity of the SH (LH), the platform group is obviously stronger (weaker) than the slope group. This can be explained by the larger surface wind speed and temperature difference between the land surface and overlying air at high altitudes (). These results are consistent with previous studies concerning the spatial pattern and seasonal evolution of diabatic heating over the TP (e.g. Yang et al., Citation2009; Ye & Gao, Citation1979; Zhao & Chen, Citation2001).
As indicated in EquationEq. (1(1)
(1) ), SH depends mainly on the in situ wind speed and the temperature difference between the surface and the overlying air. To further evaluate the variations of SH and LH, the station-averaged annual-mean time series are calculated for the wind speed, temperature difference between ground and air, the SH, and the LH (). It is clear that the surface wind speed decreases gradually from 1981 to 2002, and thereafter remains stable. Meanwhile, the temperature difference between ground and air shows a slight increasing trend in the slope group after 2003, but in the platform group, it is characterized by a significant increasing trend. In terms of the decadal variation or long-term trend of SH over the TP, the change in surface wind speed overwhelms that of the temperature difference between the land surface and air (Duan & Wu, Citation2008; Yang et al., Citation2009; Zhu, Liu, & Wu, Citation2012). Therefore, the SH over the TP shows a declining trend in the period before 2003 but recovers to a certain degree after that. Previous studies have also verified that the SH over the TP has a significant decreasing trend from the mid-1980s to the end of the 20th century, although they used different methods to calculate the SH (Duan & Wu, Citation2008; Guo, Yang, & Chen, Citation2011). As indicated in EquationEq. (3
(3)
(3) ), the LH resulting from the release of condensation heat is proportional to the precipitation amount, and this is characterized by large interannual variability (Yang et al., Citation2014). Generally, there is a slight increasing trend in LH over the platform area from 1981 to 2019, whilst no significant trend exists in the slope regions.
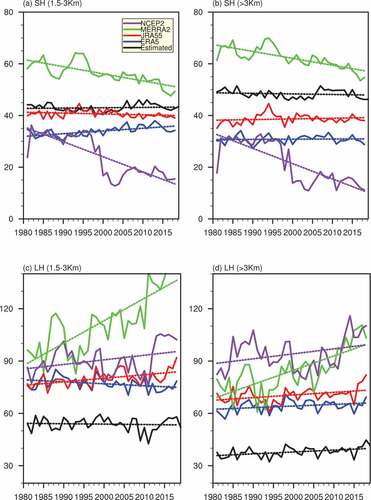
Large differences between SH and LH indeed exist between the reanalysis datasets and estimations based on observation stations (Chen, Pryor, Wang, & Zhang, Citation2019; Wang, Zhou, & Duan, Citation2011; Xie & Wang, Citation2019; Xie, Yu, Li, Ge, & Liu, Citation2018; Zhu et al., Citation2012). shows the linear trends and time series of the SH and LH on the TP from the reanalysis datasets (NCEP2, MERRA2, JRA55 and ERA5) and observation-estimated dataset. Most reanalysis datasets except MERRA2 underestimate the SH on the TP (). The ERA5 and JRA55 can capture the range and magnitude of change in SH over both the slope areas (1.5–3 km; ) and platform (>3 km; ) of the TP, whereas NCEP2 and MERRA2 obviously exaggerate the change in SH over TP. On the contrary, all reanalysis datasets including ERA5, JRA55, MERRA2 and NCEP2 overestimate the latent heat release of condensation over the TP (). The NCEP2 and MERRA2 show a more significant increasing trend than JRA55, ERA5 and the observation estimation. Overall, the changes and trends in both SH and LH over the TP shown by ERA5 and JRA55 are the closest to the observation-based results compared with the other two reanalysis datasets.
Figure 5. Linear trends and time series of the (a, b) sensible heat flux (units: W m−2), and (c, d) latent heat release of condensation (units: W m−2) averaged over the 189-stations (a, c) and 79-stations (b, d) on the TP from multiple datasets.
4. Summary
This paper reports the recalculation of the long-term daily dataset of SH and LH over the TP based on routine meteorological observations of the CMA by using state-of-the-art methods. The dataset covers 293 stations and has been updated to 31 December 2019. Two groups of 79 stations over the platform region of the TP and 189 stations over the slope areas are evaluated for their SH and LH in terms of spatial distribution, annual cycle, and decadal variation during the period 1981–2019. The major conclusions can be summarized as follows:
Climatologically, the SH decreases but the LH increases gradually from the northwest to the southeast over the TP. Generally, the SH over the platform region is greater than that over the slope areas, and vice versa for the LH.
In terms of annual cycle, the SH peaks in May and the LH peaks in July. The strength of LH is greater than that of SH from June to September, with the opposite being true for the rest of the year.
With respect to decadal change, due mainly to the variation of the wind speed and temperature difference between the ground and overlying air, the SH over the TP shows an obvious declining trend during 1981–2003, but recovers gradually thereafter. In contrast, the LH is relatively stable during the data period and characterized by an overall slight increasing trend over the platform region of the TP.
The uncertainties of the SH estimates over the TP are strongly affected by the determination of the bulk transfer coefficient for heat (CH) (Yang et al., Citation2009). Although the introduction of CH diurnal variation by Yang-Scheme reduces some uncertainties in estimating SH, it should be noted that the SH estimates in our study only represent that from the bare-soil surfaces rather than that from the partially vegetation-covered surfaces (Yang et al., Citation2009). In addition, the inadequate and heterogeneous distributions of the routine meteorological stations over the TP have always caused the uncertainties of both the SH and LH estimates. However, this work involves the production of the longest and most continuous dataset of SH and LH over the TP based on 293 routine meteorological stations. It covers most observation stations and makes full use of all available observational data. Compared with the reanalysis datasets, this paper provides a more accurate long-term series of SH and LH over the TP, which is helpful to deeply understand the influence of TP heat source on Asian summer monsoon and even global climate. We will continue to update these datasets of SH and LH over the TP in the future, with an emphasis on reducing the uncertainty induced by the different parameterization models and subgrid-scale topography (Han, Ma, Chen, & Su, Citation2017; Ma et al., Citation2006, Citation2011).
5. Usage notes
The dataset is openly accessible to all potential users. The raw data source from which it is derived is based on the records of routine meteorological observations compiled by the CMA, including three files: a table file for station information; a netCDF file for the daily SH from 1 April 1951 to 31 December 2019; and a netCDF file for the daily LH from 1 April 1951 to 31 December 2019. The station information contains the serial number (NO.), identity number (ID) designated by the CMA, name, longitude, latitude, height (unit: m), start date, end date, and percentage of missing data (unit: %) from the start date to the end date.
Open scholarship

This article has earned the Center for Open Science badge for Open Data. The data are openly accessible at http://www.dx.doi.org/10.11922/sciencedb.j00076.00061.
Data availability statement
The data described in this article are openly available on LASG data sharing platform (http://data.lasg.ac.cn/TPSHLH/). The data described in this article are openly available in the Open Science Framework at http://data.lasg.ac.cn/TPSHLH/.
Disclosure statement
No potential conflict of interest was reported by the author(s).
Additional information
Funding
Notes on contributors

Anmin Duan
Anmin Duan is a distinguished professor of the State Key Laboratory of Marine Environmental Science, College of Ocean and Earth Sciences, Xiamen University. He specializes in Tibetan Plateau meteorology, land-air-sea interaction, and climate change. He has published more than 120 peer-reviewed papers.

Senfeng Liu
Senfeng Liu received a Ph.D. degree in Meteorology from the Institute of Atmospheric Physics Chinese (IAP), Chinese Academy of Sciences (CAS). Now he focuses on the Big Earth Data and numerical simulation as a Research Fellow in the Tropical Marine Science Institute (TMSI), National University of Singapore (NUS).

Wenting Hu
Wenting Hu received a Ph. D. degree in meteorology from the Chinese Academy of Sciences (CAS) Institute of Atmospheric Physics (IAP) in 2012. Now she is an Associate professor of State Key Laboratory of Numerical Modeling for Atmospheric Sciences and Geophysical Fluid Dynamics (LASG), IAP, CAS, with a focus on Asian monsoon dynamics and air-sea interaction.

Die Hu
Die Hu is currently pursuing a Ph.D. degree from the Chinese Academy of Sciences (CAS) Institute of Atmospheric Physics (IAP). Her research interests include the Tibetan Plateau meteorology and air-sea interaction.

Yuzhuo Peng
Yuzhuo Peng is currently pursuing a Ph.D. degree from the Chinese Academy of Sciences (CAS) Institute of Atmospheric Physics (IAP). Her research interests include the climate change on Earth’s three poles.
References
- Boos, W. R., & Kuang, Z. M. (2010). Dominant control of the South Asian monsoon by orographic insulation versus plateau heating. Nature, 463, 218–222.
- Chen, L., Pryor, S. C., Wang, H., & Zhang, R. (2019). Distribution and variation of the surface sensible heat flux over the Central and Eastern Tibetan Plateau: Comparison of station observations and multireanalysis products. Journal of Geophysical Research: Atmospheres, 124, 6191–6206.
- Chen, L., Reiter, E. R., & Feng, Z. (1985). The atmospheric heat source over the Tibetan Plateau: May-August 1979. Monthly Weather Review, 113, 1771–1790.
- Duan, A., Li, F., Wang, M., & Wu, G. (2011). Persistent weakening trend in the spring sensible heat source over the Tibetan Plateau and its impact on the Asian summer monsoon. Journal of Climate, 24(21), 5671–5682.
- Duan, A., Liu, S., Zhao, Y., Gao, K., & Hu, W. (2018). Atmospheric heat source/sink dataset over the Tibetan Plateau based on satellite and routine meteorological observations. Big Earth Data, 2(2), 179–189.
- Duan, A. M., & Wu, G. X. (2008). Weakening trend in the atmospheric heat source over the Tibetan Plateau during recent decades. Part I: Observations. Journal of Climate, 21, 3149–3164.
- Feng, Z., Reiter, R. E., & Chen, L. (1985). The atmospheric heat budget over the western part of the Tibetan Plateau during MONEX. Advances in Atmospheric Sciences, 2, 454–468.
- GMAO, 2015: MERRA-2 tavgM_2d_flx_Nx: 2D, monthly mean, time-averaged, single-level surface flux diagnostics, version 5.12.4. Goddard Earth Sciences Data and Information Services Center, accessed 3 February 2017, 10.5067/0JRLVL8YV2Y4.
- Guo, X., Yang, K., & Chen, Y. (2011). Weakening sensible heat source over the Tibetan Plateau revisited: Effects of the land–atmosphere thermal coupling. Theoretical and Applied Climatology, 104, 1–12.
- Han, C., Ma, Y., Chen, X., & Su, Z. (2017). Trends of land surface heat fluxes on the Tibetan Plateau from 2001 to 2012. International Journal of Climatology, 37, 4757–4767.
- Harada, Y., Kamahori, H., Kobayashi, C., Endo, H., Kobayashi, S., Ota, Y., … Takahashi, K. (2016). The JRA-55 reanalysis: Representation of atmospheric circulation and climate variability, J. Meteorological Society of Japan, 94, 269–302.
- He, C., Wang, Z., Zhou, T., & Li, T. (2019). Enhanced latent heating over the Tibetan Plateau as a key to the enhanced East Asian summer monsoon circulation under a warming climate. Journal of Climate, 32(11), 3373–3374.
- Hersbach, H., Bell, B., Berrisford, P., Hirahara, S., Horányi, A., Muñoz‐Sabater, J., … Thépaut, J. N. (2020). The ERA5 global reanalysis. Quarterly Journal of the Royal Meteorological Society, 146, 1999–2049.
- Kanamitsu, M., Ebisuzaki, W., Woollen, J., Yang, S. K., Hnilo, J. J., Fiorino, M., & Potter, G. L. (2002). NCEP-DOE AMIP-II reanalysis (R-2). Bulletin of the American Meteorological Society, 83, 1631–1643.
- Ma, Y., Zhong, L., Su, Z., Ishikawa, H., Menenti, M., & Koike, T. (2006). Determination of regional distributions and seasonal variations of land surface heat fluxes from Landsat-7 enhanced thematic mapper data over the central Tibetan Plateau area. Journal of Geophysics ResearchAtmospheres, 111, D10305.
- Ma, Y., Zhong, L., Wang, B., Ma, W., Chen, X., & Li, M. (2011). Determination of land surface heat fluxes over heterogeneous landscape of the Tibetan Plateau by using the MODIS and in-situ data. Atmospheric Chemistry and Physics, 11, 10461–10469.
- Monin, A. S., & Obukhov, A. M. (1954). Basic laws of turbulent mixing in the atmosphere near the ground. Tr Akad Nauk SSSR Geofiz Institute, 24, 163–187.
- Wang, M., Zhou, S., & Duan, A. (2011). Trend in the atmospheric heat source over the central and eastern Tibetan Plateau during recent decades: Comparison of observations and reanalysis data. Chinese Science Bulletin, 57, 548–557.
- Wang, M., Zhou, S., & Duan, A. (2012). Trend in the atmospheric heat source over the central and eastern Tibetan Plateau during recent decades: Comparison of observations and reanalysis data. Chinese Science Bulletin, 57, 548–5573–183.
- Wu, G. X., Duan, A. M., Liu, Y. M., Mao, J. Y., Ren, R. C., Bao, Q., … Hu, W. T. (2015). Tibetan Plateau climate dynamics: Recent research progress and outlook. National Science Review, 2, 100–116.
- Xie, Z., & Wang, B. (2019). Summer atmospheric heat sources over the Western–Central Tibetan Plateau: An integrated analysis of multiple reanalysis and satellite datasets. Journal of Climate, 32, 1181–1202.
- Xie, J., Yu, Y., Li, J. L., Ge, J., & Liu, C. (2018). Comparison of surface sensible and latent heat fluxes over the Tibetan Plateau from reanalysis and observations. Meteorology and Atmospheric Physics, 131, 567–584.
- Yang, K., Qin, J., Guo, X., Zhou, D., & Ma, Y. (2009). Method development for estimating sensible heat flux over the Tibetan Plateau from CMA data. Journal of Applied Meteorology and Climatology, 48, 2474–2486.
- Yang, K., Wu, H., Qin, J., Lin, C., Tang, W., & Chen, Y. (2014). Recent climate changes over the Tibetan Plateau and their impacts on energy and water cycle: A review. Global and Planetary Change, 112, 79–91.
- Ye, D., & Gao, Y. (1979). The meteorology of the Qinghai-Xizang (Tibet) Plateau (in Chinese) (pp. 278). Beijing: Science Press.
- Yeh, T.-C. (1950). The circulation of high troposphere over China in winter of 1945–1946. Tellus, 2, 17.
- Zhao, P., & Chen, L. (2000). Study on climatic features of surface turbulent heat exchange coefficients and surface thermal forces over the Qinghai-Xizang Plateau. Acta Mechanica Sinica, 14, 13–29.
- Zhao, P., & Chen, L. X. (2001). Climatic features of atmospheric heat source/sink over the QinghaiXizang Plateau in 35 years and its relation to rainfall in China. Science in China Series D. Earth Sciences, 44, 858–864.
- Zhu, X., Liu, Y., & Wu, G. (2012). An assessment of summer sensible heat flux on the Tibetan Plateau from eight data sets. Science China Earth Sciences, 55, 779–786.