
ABSTRACT
The technological landscape for managing big Earth observation (EO) data ranges from global solutions on large cloud infrastructures with web-based access to self-hosted implementations. EO data cubes are a leading technology for facilitating big EO data analysis and can be deployed on different spatial scales: local, national, regional, or global. Several EO data cubes with a geographic focus (“local EO data cubes”) have been implemented. However, their alignment with the Digital Earth (DE) vision and the benefits and trade-offs in creating and maintaining them ought to be further examined. We investigate local EO data cubes from five perspectives (science, business and industry, government and policy, education, communities and citizens) and illustrate four examples covering three continents at different geographic scales (Swiss Data Cube, semantic EO data cube for Austria, DE Africa, Virginia Data Cube). A local EO data cube can benefit many stakeholders and players but requires several technical developments. These developments include enabling local EO data cubes based on public, global, and cloud-native EO data streaming and interoperability between local EO data cubes. We argue that blurring the dichotomy between global and local aligns with the DE vision to access the world’s knowledge and explore information about the planet.
1. Introduction
Constant streams of Earth observation (EO) data covering almost every place on Earth are filling archives, including open data from the Landsat (Loveland & Dwyer, Citation2012) and Copernicus’ Sentinel missions (Aschbacher & Milagro-Pérez, Citation2012). Several technical and organisational developments already address challenges to accessing data and producing insights in the context of the volume, velocity, and variety of big EO data. For example, web-based analytical platforms provide data access together with computing capabilities in a cloud infrastructure so that users can conduct analysis without requiring on-premise installations or data storage (Sudmanns et al., Citation2020). These platforms are often single instances provided by big organisations that are able to take care of the computational requirements demanded by big EO data analyses. However, such a configuration is not free of criticism and may have side effects and disadvantages that should not be overlooked. Examples include eliminating users’ agency over crucial components of the technology stack (Gomes, Queiroz, & Ferreira, Citation2020; Xu et al., Citation2022) and difficulties in establishing trust in solutions which cannot be completely investigated (Knoth & Nüst, Citation2017). Other side-effects may be related to dependencies such as software lock-in, hidden or unclear decisions, high abstraction levels, limited access to prepared datasets with unknown lineage, varying or opaque business models, and limited interoperability and workflow sharing (Schramm et al., Citation2021). Implementing the FAIR (Findable, Accessible, Interoperable, Reusable) data principles (Wilkinson et al., Citation2016) and long-term reproducibility for science can be affected by the side effects in the same way as the requirement to upload and share data and algorithms on external infrastructures. The dependency on a specific platform, its data and functionalities, and generally the loss of control may limit the diversity of users and sustainability of business models. These negatives are typically counterbalanced by the ease of use of pre-configured platforms, with no need to consider difficult data structures, software and hardware requirements.
EO data cubes are an approach for the management and analytics of multi-dimensional EO data and can be operated on a variety of scales and infrastructures. There is no single, agreed-upon definition of an EO data cube, but several approaches exist. For example, Strobl et al. (Citation2017) consider an EO data cube as a multi-dimensional structure with at least one non-spatial dimension (e.g. time), where coordinate tuples of the dimensions are used for data access. EO data cubes are generally used as a data management technology to organise EO data in a way that abstracts data storage. EO images stored and accessed as individual image files in directories with descriptive names, are acquisition-oriented but require users to know filename conventions and internal directory structures of data centres. The users of EO data cubes can access EO data based on spatio-temporal coordinates rather than the image’s file names or directory structures at a data centre (Lewis et al., Citation2016; Nativi et al., Citation2017). Through possibilities of flexible and scalable deployments and the accessibility of cloud-based computing infrastructure, they have become very popular in recent years.
Instead of relying on a few big, general-purpose systems provided as-is to end-users, we want to emphasise the advantages of a “think global, cube local” approach from a variety of perspectives. In this case, the term “local” refers to self-hosted deployments of EO data cubes, which cover particular geographic regions and serve specific communities or purposes (e.g. on national or institutional level), not necessarily installations on a local computer. Such local EO data cube instances can contribute to building problem-oriented and tailored solutions, increased control of the entire workflow, teach students the technological background, support transparent and reproducible research, and enable groups with a common geographical interest, e.g. national or regional, to conduct big EO data analysis in a self-controlled or even self-hosted environment. “Think global, cube local” means that open source EO data cubes can be self-hosted to serve specific regional or thematic requirements and user groups. Such a self-hosting option is similar to the popular file cloud systems such as Nextcloud or Owncloud. However, employing local EO data cubes requires having global efforts (e.g. the Sustainable Development Goals (SDGs)) in mind (e.g. through interoperability).
Local EO data cube deployments have proven successful in specific contexts, such as national EO data cube implementations, even if they may imply obtaining copies of data or accessing data over the Internet as well as installing and maintaining own infrastructures. General-purpose instances of big platforms, whether commercial or not, are undoubtedly capable of enabling big EO data analytics. Users that are unable to afford installation and maintenance of their own deployment can benefit, but these platforms may not fulfil every user’s requirement. Many end-users may not be interested in global analyses but rather in repeated analyses within the same, limited study area (e.g. their country or region), include their own additional datasets, whether public or not, or execute own algorithms that may not be provided. Local stakeholders can provide infrastructure for such implementations to serve a local community as hardware becomes more affordable. Open-source solutions for big EO data analysis allow these stakeholders to install the software on their own infrastructure as well as popular cloud infrastructures and scale it without expensive software licence costs using container-based solutions. Hence, self-hosted EO data cubes and diversification of analytical platforms and data management software for big EO data are within reach again. Local EO data cubes can be a means to blur the dichotomy between global and local, whereby more people can be involved in global initiatives (e.g. SDGs) and EO’s contribution to such overarching goals (Kavvada et al., Citation2020), while still allowing for decentralised and diverse solutions/implementations.
In addition to global activities and solutions, multiple instances of EO data cubes with a specific geographic focus (“local EO data cubes”) were implemented over the last years on a variety of cloud infrastructures and in various geographical areas. An approach to investigate whether this is a worthwhile effort and whether this contradicts global efforts is difficult and not yet available. The benefits and potential disadvantages of setting up and maintaining self-hosted EO data cubes have not yet been investigated and discussed from different perspectives nor communicated. Further, multiple instances of local EO data cubes may appear to be a contradiction to the Digital Earth (DE) vision. The DE vision, conceived in 1998 by then US vice president Al Gore (Gore, Citation1998), has fuelled imagining possibilities towards innovating and implementing many technologies we now use every day, such as GEOSS (Global Earth Observation System of Systems; https://earthobservations.org/geoss.php, accessed 26.04.2022), the geospatial Web (Janowicz & Hitzler, Citation2017; Wagemann et al., Citation2018), and Google Earth (Liang et al., Citation2018; https://earth.google.com/, accessed 26.04.2022). DE was originally envisioned as an interactive interface to explore information about our planet with multi-resolution, multi-source, and multi-dimensional visualisation options (Gore, Citation1998; Liu et al., Citation2020). A key target to be achieved is the easy and seamless access, integration, sharing, and analysis of geospatial information. With the advent and proliferation of big Earth data, widespread Internet and computational capabilities, this vision is a legacy still influencing the recent and future DE interpretations (Liu et al., Citation2020). This paper investigates and discusses the benefits and characteristics of local EO data cubes and whether such local and diversified activities contribute or contradict the DE vision.
The necessary background information about EO data cubes and various additional enabling technologies are described in Section 2 of this paper. Section 3 is an investigation of local EO data cubes based on a selected set of five perspectives: science, business and industry, government and policy, education, communities and citizens. These perspectives were selected to include a variety of aspects, stakeholders, potential applications, and use-cases. A collection of various general aspects, as well as existing reports based on local EO data cubes, are presented in each of the perspectives. While Section 3 is a general investigation of local EO data cubes’ potentials and capabilities, Section 4 describes four existing local EO data cube implementations to showcase how they support different requirements such as integrating own datasets or facilitating additional developments and specific application contexts. These implementations are located on three continents, range from a continental to a sub-country scale, and are implemented by and for different networks of stakeholders and players. Section 5 discusses the advantages and disadvantages of local EO data cubes in general, but also our approach to investigating them. Section 6 shares our conclusions of the “think global, cube local” idea as well as remaining open questions and an outlook.
2. Background and technological landscape
2.1. Background
The concept of EO data cubes is not novel, but the topic has certainly created a new focus on how end-users and stakeholders interact with EO data and take advantage of its value. According to Strobl et al. (Citation2017), a geospatial data cube is based on regularly or irregularly gridded, spatio-temporal data with additional dimensions (i.e. axes) representing various thematic data parameters (e.g. spectral band, elevation). This “cube” concept is typically described as having spatial (e.g. latitude and longitude) and time dimensions thereby creating a 3-dimensional cube of data. Though this is the simplest explanation of EO data cubes, their differences in storage formats, grid projections, and data parameters are considerable.
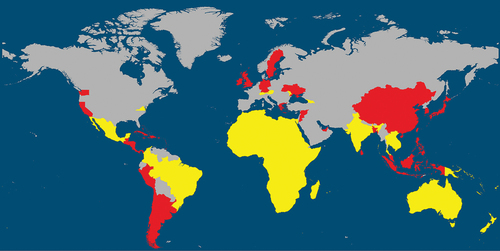
While large-scale systems and global datasets dominate the big EO data landscape, the power and impact of smaller and more localised EO data cubes are gaining popularity ().
Figure 1. The map shows how the Open Data Cube (ODC) global impact has spread to more than 100 countries, exemplarily illustrating the interest in local EO data cubes. This figure includes countries within regional initiatives (e.g. Digital Earth Africa, Digital Earth Pacific) as well as individual countries that have implemented their own EO data cubes (e.g. Australia, Switzerland, Mexico). In addition, there are known EO data cube implementations within countries (e.g. USA states of Virginia and California) that reflect more localised instances. The operational instances are reflected in YELLOW and those under development or consideration are in RED. Besides the ODC implementations, also implementations based on other technologies exist (see Section 2.2). The extent of the technical implementations of the data cubes and their data availability may go beyond or are only partially within national administrative boundaries.
In addition to differences in the technical specifications of the EO data cubes, there are also many players and stakeholders which need to be considered because they are involved creating and managing these EO data cubes. At the top of this EO data landscape are the data providers, which are typically large, global space agencies, such as those found in the Committee on Earth Observation Satellites (CEOS). Once their data is open and available to all users, it is often consumed by cloud providers (e.g. Google Earth Engine, Amazon Web Services, Microsoft Planetary Computer), regional and national initiatives (e.g. Digital Earth Africa, Digital Earth Pacific, Swiss Data Cube, Mexican Geospatial Data Cube, Virginia Data Cube), or directly by end-users. Cloud providers become a source of data redistribution and also providers of analysis-ready data (ARD) as well as analysis frameworks, taking advantage of modern cloud computing architectures and artificial intelligence. Regional initiatives become value-adder and localised “coordinators” of EO data, with their related analysis tools, derived information layers, and capacity building. Finally, there are end-users, who may be intermediate-level organisations (e.g. governments, commercial entities, research groups) or individual users (e.g. researchers, educators). These diverse stakeholders, spanning from the data providers to the end-users, define the complex technological landscape of EO data cubes.
2.2. Enabling technologies and data
EO data cubes can be implemented in a variety of ways using different approaches or technologies. Some approaches are implemented as packages for popular scripting or programming languages. Examples include the Open Data Cube (ODC) (Killough et al., Citation2020), which originated from the Australian Geoscience Data Cube (Lewis et al., Citation2017), or the xCube, which is implemented in the Euro Data Cube (https://eurodatacube.com, accessed 17.02.2022) as part of the Euro Data Cube Facility. Both have a Python-based application programming interface (API) to load the data as Xarray objects (Hoyer & Hamman, Citation2017). An implementation using the R programming language is the SITS package (Simoes et al., Citation2021), which the Brazil Data Cube uses. The Earth System Data Lab (ESDL), also part of the Euro Data Cube Facility, is an approach to creating multivariate data cubes and has a Julia and Python API (Mahecha et al., Citation2020). Other approaches are based on array database systems. Examples include Rasdaman (Baumann et al., Citation1998), which is used in the EarthServer projects (Baumann et al., Citation2016) and by CODE:DE as the BigDataCube service (Storch et al., Citation2019), or the SciDB array database system (Stonebraker et al., Citation2011).
Tightly coupled with EO data cubes is the concept of ARD for improving the transferability of analyses and algorithms (Dwyer et al., Citation2018; Giuliani et al., Citation2017; Lewis et al., Citation2018). CEOS defines ARD as “satellite data that have been processed to a minimum set of requirements and organised into a form that allows immediate analysis with a minimum of additional user effort and interoperability both through time and with other datasets” (Lewis et al., Citation2018). An example is optical imagery calibrated to bottom-of-atmosphere (surface reflectance) together with a set of mandatory and optional metadata and quality information (e.g. cloud contamination). Providing global ARD, such as surface reflectance for optical images, facilitates the deployment of local EO data cubes and the transferability of algorithms between them. For example, the Water Observation from Space (WOFS) algorithm (Mueller et al., Citation2016) has been successfully applied in the DE Australia and DE Africa EO data cubes (Halabisky et al., Citation2021).
Recently, a set of cloud-native solutions for geospatial data has emerged. Most prominently, the SpatioTemporal Asset Catalog (STAC - https://stacspec.org, accessed 17.02.2022) and the Cloud-Optimised Geotiff (COG - https://www.cogeo.org, accessed 17.02.2022) can be named here. The EO profile of STAC allows easier indexing, searching, and consuming a large quantity of EO imagery, e.g. an entire archive. A COG is a GeoTIFF file that can be accessed via the standard Internet protocol HTTP but supports range requests that allow clients to specify the download of parts of the file, e.g. corresponding to a geographical region. In combination, they allow efficient and stable Internet-based distribution of EO data, which can be directly consumed by clients and used on-demand in analyses, e.g. after indexing in an EO data cube.
3. Five perspectives on local EO data cubes
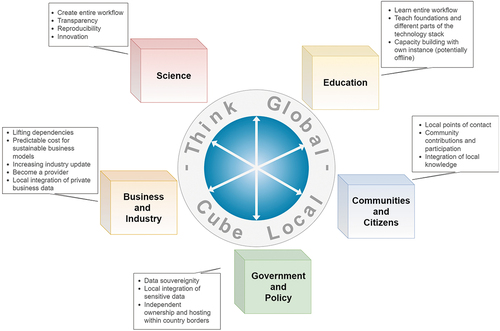
Considering EO beyond a purely isolated (e.g. photogrammetric) scientific aspect, the EO data, workflows, potentially related decisions and their impact are situated at the intersection of different views, values, and interests. The number of users of (big) EO data or derived information and services are growing, increasingly diversifying and, therefore, may benefit from a variety of solutions anywhere along the EO analytics workflow. Several fundamental perspectives span the framework in which localised EO data cubes are positioned ().
Figure 2. Five different perspectives show the benefits of local EO data cubes.
3.1. Science
Scientific endeavours require not only the agency to modify, investigate and understand an entire workflow that generates results but also that all parts are accessible and maintained over a long period of time for reproducibility and the freedom to innovate everywhere along the workflow. There is a risk that algorithms and important processes of scientific knowledge generation are becoming too abstracted and detached from scientists (Mei-Po, Citation2016). Scientific output and the demand for reproducibility benefit not only from being able to repeat experiments but also from transparency and insight into the entire process (Craglia & Nativi, Citation2018), which includes the ability to set-up and create the entire workflow of big EO data analytics.
Today’s science is driven by ideas such as the FAIR principles (Koers et al., Citation2020; Wilkinson et al., Citation2016) and open science to overcome the reproducibility crisis (Nüst et al., Citation2018). In some cases, their integration in research is even mandatory. For example, in European research projects, it is required to consider open science from the beginning (European Commission Directorate General for Research and Innovation, 2018; Burgelman et al., Citation2019), following the Commission’s FAIR Data expert group’s recommendations (The European Parliament and the council of the European Union, Citation2019). Though still a vague concept, open science is often considered to be more than just open data. It includes a certain degree of openness in the entire process of generating scientific results, including open software, open infrastructures, and open publishing (Burgelman et al., Citation2019; Nüst et al., Citation2018). In contrast to a scientific lab experiment, in the EO domain, observations cannot be repeated; therefore, the appropriate archiving of EO data is important with a clear demand for open science and FAIR data management (Giuliani et al., Citation2021).
Abstracted and opaque systems can limit their uptake in scientific workflows. This may be due to a lack of control, unknown or exceedingly high costs particularly affecting smaller research teams, risks of dependency on commercial cloud providers with unknown policies (e.g. deletion, data alteration), unknown or unclear benefits of using such systems, unknown data lineage and processing, abstraction of functionalities that hides implementation details, and potential security and privacy concerns (Wagemann et al., Citation2021). Further, limited flexibility to include own datasets in scientific workflows may deter scientists from using existing big Earth data systems and solutions (Wagemann et al., Citation2021). This consideration includes not only datasets that are restricted but also datasets that are not available in repositories in external systems. One example could be a dataset’s limited extent to a geographical focus, such as the publicly available meteorological datasets for Austria (ZAMG, Citation2021). On the other hand, the emergence of cloud-native data (e.g. using COGs and STAC), globally accessible on demand, can remove the need for science teams to organise publicly available data before exploring it. Local EO data cubes allow scientists to consume the public data and merge them with their own datasets in a self-hosted environment.
A diversity of solutions facilitated by a variety of local EO data cube installations is a pathway towards continued innovative research and development with a scientist’s direct access to data and infrastructure (Gomes et al., Citation2020). Local EO data cube instances can be used for open science and scientific applications in general, thus supporting the FAIR principles (Giuliani et al., Citation2019a), but also for conducting research about them, adjusting them to specific needs and eventually improving them. The semantic EO data cube (Augustin et al., Citation2019) as part of a larger infrastructure with semantic querying options (Schramm et al., Citation2021) is an example of how access to the entire technology stack allows exploring and implementing a variety of ideas as also outlined in Section 4.2.
3.2. Business and industry
Businesses require solutions and technology with economic sustainability, the ability to estimate costs to develop robust business models and provide reliable services that remain profitable over long periods of time. The proliferation of free and open data policies in the EO domain has shifted the value proposition for many companies from data towards algorithms, applications and tailored interfaces based on EO data and related services. Due to this shift, the characteristics of the underlying computing environments will be increasingly in the focus of developing sustainable and financially feasible business models.
As a consequence, EO data cubes and processing resources as a service can be accessed from providers like Google Cloud (Google, Citation2021), Sentinel-Hub, or Euro Data Cube. One specific example in Australia is the Commonwealth Scientific and Industrial Research Organisation (CSIRO) Earth Analytics Science and Innovation (EASI) platform which is designed to support commercial engagement (CSIRO, Citation2022). There is also a strong push from the European Commission e.g. Copernicus Accelerator) and Data and Information Access Services (DIAS) towards developing an EO-driven economic market and businesses that use and rely on EO data (European Commission. Directorate General for Internal Market, Industry, Entrepreneurship and SMEs. and PwC, Citation2019; European Union Agency for the Space Programme (EUSPA), Citation2022). From a commercial perspective, however, the computing environment needs to be carefully selected due to scepticism surrounding the security of externally hosted cloud solutions and a desire to mitigate risks of system and interface changes that require subsequent technical updates of clients or changes of internal workflows, which potentially rise operating costs for data storage, processing, and data transfer (Wagemann et al., Citation2021).
Self-hosted EO data cubes can be deployed on privately controlled infrastructures and therefore limit dependency on external cloud providers or even allow becoming an EO data cube provider for a specific target audience, as some of the examples above (e.g. the EASI platform). Benefits include increasing the predictability of long-term costs, giving companies control over their own systems, and allowing secure integration of internal and sensitive business data. This makes more room for companies to uptake EO data, be flexible and to innovate, similar to benefits encountered from a scientific perspective.
3.3. Government and policy
Nationally maintained EO data cubes can provide a secure and sovereign place for local to national-scale datasets to converge with global-scale EO data in one infrastructure. Data security and technological sovereignty are fundamental aspects for national governments or agencies to develop and implement their EO capabilities and improve compatibility with other national datasets (e.g. meteorological, socio-economic). Data sovereignty refers to enabling a nation to develop tailored services with data and computing resources operated in the country itself (Hummel et al., Citation2021). In this context, the geographical location of technical infrastructure plays an important role and being independent of external technology companies can reduce geographical biases of cloud infrastructure distributions (Cloudscene, Citation2022). Self-hosted EO data cubes can be a data integrator for datasets with a certain level of sensitivity or which cannot be stored or combined with other data on cloud infrastructures operated by other companies or located outside of national borders (Dhu et al., Citation2019).
Sovereign local EO data cube capabilities paired with open-source, scalable architectures allow countries to maintain their own data and products for regulation and reporting but also enable regional-scale EO data cubes for transboundary analysis (Dhu et al., Citation2019). There is currently a large push in the big EO domain to develop methods to support monitoring indicators for (inter)national development agendas (e.g. SDGs) (Anderson et al., Citation2017; Andries et al., Citation2019), but planning, policy-creation and actions to make concrete change towards meeting such visionary targets often happen at a much more localised level (Tan et al., Citation2019). Moving from targets to action comprises iterative feedback loops across sectors and scales, and having a regionally or nationally maintained infrastructure can serve as a science-policy interface towards science-oriented policy and action (Mazzetti et al., Citation2022). Such processes can benefit from local capacity to leverage EO for continued monitoring, investigating and producing evidence for action combined with other sources of data and information that may be sensitive or need to remain private. A regional or national scale infrastructure is more manageable than global solutions in terms of governance and institutional arrangements (Dhu et al., Citation2019).
Besides national governments and agencies, there is also an increasing general interest in geoinformation derived from multidimensional EO data in the United Nations (UN) organisations, e.g. for land monitoring and effective natural resources management. This is documented by examples such as the System for Earth Observation Data Access, Processing, and Analysis for Land Monitoring (SEPAL - https://sepal.io, accessed 17.02.2022) developed by the UN’s Food and Agriculture Organization (FAO). Although it is not based on a local EO data cube, it could benefit from their properties because the aim is to support countries in reliable monitoring and reporting on forests and land use for improved climate change mitigation plans and data-driven land-use policies (Tondapu et al., Citation2018).
Data sovereignty and creating services on own computing resources within a country’s borders can be requirements to set up and maintain a self-hosted local EO data cube, and several countries are already supporting such activities. External, public data can be used with cloud-native technologies but integrated locally making use of local EO data cubes. An example of how a local EO data cube can provide geo-information for national government agencies is the Swiss Data Cube, as described in Section 4.1.
3.4. Education
The DE vision is centred on exploring information to improve understanding of Earth, yet there continues to be a gap between the skills required to use existing infrastructures and what most users are able to do (Hofer et al., Citation2020; Wagemann et al., Citation2021). Local EO data cubes establish a digital space to improve digital literacy in the current “big data” era by creating a means to build knowledge about the Earth and to transfer knowledge about the underlying technology. Self-hosted EO data cubes enable educators and learners to use their own EO data cube instances and explore how such technologies work. This moves beyond considering only remote sensing principles and EO applications during education. If implemented as a “sandbox” (i.e. testing environment) on a learner’s own computer, local EO data cubes can mitigate fears of breaking something or unintentionally executing a potentially costly process in an unfamiliar cloud environment. Looking into the inner workings, software components and infrastructure behind a big EO data technology is important to improve understanding for those wanting to work with such technology and those that may only end up using EO-derived information.
The open education concept requires actions beyond providing free and open training material, e.g. by considering the diversity of learners (Zawacki-Richter et al., Citation2020). More specifically, considering specific capacity building and diverse training needs of users is reported as essential for wider adoption of EO-based approaches and creating own workflows (Kganyago & Mhangara, Citation2019). Local EO data cubes not only allow looking behind the scenes from a technical perspective but are also flexible enough to create a tailored educational frame for learning about the entire workflow of big EO analytics, from data providers to information generation. They open options to improve understanding of the foundations of big EO data technologies and, more importantly, contextualise EO analyses and workflows and their limitations and challenges with hands-on experience. Instead of treating cloud infrastructure as a black box, it opens the possibility to a comprehensive understanding of the entire technology stack of big EO data infrastructure and to match it to application and workflow requirements, creating a space for asking questions, exploring and hopefully innovating anywhere in the workflow.
It is also possible to decouple local EO data cube instances from the Internet, meaning offline EO data cubes can be used to build EO capacity where it may not have been possible before. Online tools have emerged to help bridge the gap between big EO data archives and applications with an educational focus (e.g. EO-Browser by Sinergise, EarthBlox built on top of Google Earth Engine) but require stable Internet connection and are limited to the application end of the EO analytics workflow. The ability to have an offline EO data cube can be especially useful as an educational tool in offline or poorly connected areas (Kumar & Mutanga, Citation2018).
Local EO data cubes may provide new possibilities for teaching big EO data infrastructure and workflows to close skill gaps but also enable more people and communities to directly use and benefit from EO data and derived information, whether used for learning all the inner workings or simply having a running EO data cube that can be used for analysis regardless of Internet access.
3.5. Communities and citizens
Developments of grid-based processing of multidimensional scientific data were driven by computational considerations (Baumann et al., Citation1998; Maier & Vance, Citation1993), and the implementation of EO data cubes has risen from ideas to improve technical access to long time series of EO data (Purss et al., Citation2015). Today, the uptake and application of these technologies can include but also affect any individual, whether directly considered a user or not. Unfortunately, the term user is generally poorly defined and understood when discussing user-centred development in the big EO data domain (Wagemann et al., Citation2021). Users of EO data can be anyone along the EO analytics workflow, from data stewards to analysts to various actors making decisions based on EO-derived information. Analysis results based on data with uncertainty and without local context can be misleading (Scoones et al., Citation2013) and, more specifically, decisions made based on remote sensing data impact more than the people and institutions developing and using them; therefore, requires careful, collaborative approaches (Davis et al., Citation2021).
When examining the development, use and management of EO data cubes and DE more broadly, the role of citizens is unfortunately often left ignored (Craglia et al., Citation2012). There are many reasons for this (e.g. it is easier to investigate a clearly defined group than all citizens). However, public funds are generated by citizens and spent on the use and development of open and private DE technologies, including various EO data cube implementations and decisions made based on EO data and analyses can have a direct impact on citizens. More direct involvement of citizens in EO projects is challenging but can support the sustainability and usability of solutions (Grainger, Citation2017).
Local EO data cubes, if locally maintained, create different and more accessible points of contact (e.g. in terms of language and specific considerations or requirements) when it comes to inquiring about EO-derived information, decisions that have local impact, or the entire system. Direct connections between stakeholders such as developers, data custodians, users, and local people open options for community-driven action and iterative, collaborative approaches to tackling complex ethical challenges of remote sensing data and approaches (Hargreaves & Watmough, Citation2021). The flexibility to deploy self-hosted local EO data cubes in different technological settings, for various geographical scales, and including local datasets makes it possible for those implementing and maintaining them to incorporate public feedback and allow for closer participation of local communities rather than just providing finished EO-based information or products. As examples, see Section 4.3 on the DE Africa initiative on integrating EO data in a variety of geographical scales to support and enable local users and Section 4.4 on the Virginia Data Cube, an implementation where an interested public can ask questions to people employed by their own government about any aspect of the system, the information generated by it, as well as access it themselves.
4. Examples
A diverse and growing collection of local EO data cube implementations are planned or already operational (see ). Four examples show local EO data cubes’ capabilities across different scales and stakeholders: the Swiss Data Cube (SDC), the Sen2Cube.at semantic EO data cube for Austria, DE Africa, and the Virginia Data Cube.
4.1. Swiss Data Cube
Switzerland was among the first countries in the world to adopt the EO data cube concept providing access to more than three decades of EO ARD (Giuliani et al., Citation2017). The SDC (https://www.swissdatacube.org/, accessed 26.04.2022) is a national effort supported by the Swiss government through the Federal Office for the Environment (FOEN) and developed, implemented and operated by the UNs Environment Program (UNEP)/GRID-Geneva in partnership with the University of Geneva (UNIGE), the University of Zurich (UZH), and the Swiss Federal Institute for Forest, Snow and Landscape Research (WSL) (Chatenoux et al., Citation2021). It aims at: (1) automating the processing of satellite imagery to generate information products; (2) solving the conformity (i.e. standardisation of measurements) issue of EO; (3) supporting Multilateral Environmental Agreements; and (4) testing, exploring and developing new methodologies for environmental monitoring.
The SDC is a tera-scale cloud-computing platform allowing users the access, analysis, and visualisation of up to 38 years (1984–2022) of optical (e.g. Sentinel-2; Landsat-5, -7, -8) and radar (e.g. Sentinel-1) satellite EO data (Giuliani et al., Citation2017, Citation2018, Citation2021; Truckenbrodt et al., Citation2019). The archive is updated daily and accounts for approximately 67,000 scenes corresponding to a total volume of 10 terabytes (TB) and more than 2,000 billion observations/pixels (as of May 2022). The SDC is based on the ODC software stack, facilitating efficient management and processing of large volumes of data. Users have access to a Python API to develop methods, algorithms, tools and applications. This API is accessible through Jupyter Notebooks, an interactive web-based programming interface that can be used for combining software code, algorithm output and explanatory text.
Since its inception, one of the key objectives of the SDC is to provide near real-time information capability that can be readily used as an evidence base for the design, development, implementation and evaluation of national policies, programs and regulation, as well as supporting the Swiss government for environmental monitoring and reporting commitments (Dhu et al., Citation2019). It has already contributed to producing valuable insights on the impacts of climate change on vegetation (Poussin et al., Citation2021), snow (Poussin et al., Citation2019), and threatened mountain species (Barras, Braunisch, Arlettaz, & Maiorano, Citation2021). It also contributed to complementing traditional statistical sources to inform on SDGs (Giuliani et al., Citation2020a; Honeck et al., Citation2018) and Essential Variables (Giuliani et al., Citation2020b; Thornton et al., Citation2021).
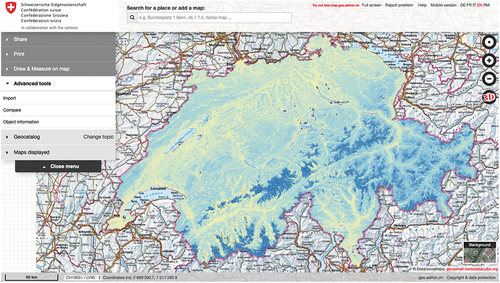
These examples have demonstrated that researchers are able to efficiently and effectively use this local EO data cube for monitoring the nationwide environment. The next step, which is ongoing, is to expand the number of beneficiaries across the government and to other administrative levels, such as cantons. A key requirement for this is to raise awareness about the value of EO among decision-makers. Currently, we see an interesting emerging trend with a growing number of requests coming from lower administrative levels to ingest new EO data sources, such as Sentinel-5P or Sentinel-3, to develop specific information products on air quality (e.g. pollution and dust monitoring). Such requests illustrate a facet that a specific need can also benefit others because, in a national-scale infrastructure, such as the SDC, ingestion of these data happens not at the cantonal level but the national one (). Therefore, this enhances the value of having synoptic, consistent, and spatially explicit information and methods that can be replicated at various scales or particular places.
Figure 3. Annual mean Normalized Difference Water Index (NDWI) for 2021 processed by the SDC and visualised through a WMS service into the National Map Viewer of the Swiss Confederation (https://map.geo.admin.ch). NDWI is a proxy for vegetation water content and allows tracking vegetation conditions across the country. .
To tackle these issues, a collaborative, open-science approach involving both public and private sectors can have a huge return-on-investment by providing tailored, validated information services (Giuliani et al., Citation2019a). An effort towards this objective has been already undertaken to develop a service to access ready-to-use data products compliant with the FAIR principles (Wilkinson et al., Citation2016) with the aim to strengthen open and reproducible EO science and build trust in data (Giuliani et al., Citation2021).
4.2. Semantic EO data cube infrastructures: example of the Austrian Sen2Cube.at
The Austrian semantic EO data cube infrastructure demonstrates how local EO data cubes make it possible to innovate and modify the foundational technology behind big EO data analysis rather than being limited to adapting applications. The infrastructure implements semantic EO data cubes (Augustin et al., Citation2019), which benefit from an open-source and self-hosted EO data cube software and the possibility to add various technical extensions (Sudmanns et al., Citation2021a). A semantic EO data cube infrastructure aims to implement explainable artificial intelligence (i.e. computer vision) directly at the EO data cube level and allows augmentation of the (re-usable) thematic dimension by initial semantic enrichment and user-defined semantic models for semantic analysis.
An additional array of components and software at several layers of the technology stack are necessary to achieve semantic analyses within EO data cubes. In our approach, the new developments and extensions encompass:
A pre-processing and semantic enrichment routine implemented at the data level,
A Graphical User Interface (GUI) with a knowledge engineering interface in which users develop high-level semantic models in a code-free environment,
A newly conceptualised and developed inference engine and semantic querying language that translates the high-level semantic models into EO data cube queries,
The layout concept, which is a machine- and human-readable description of the semantic EO data cube’s content and facilitates automated communication and interoperability between different system components and across multiple semantic EO data cubes (Sudmanns et al., Citation2021b).
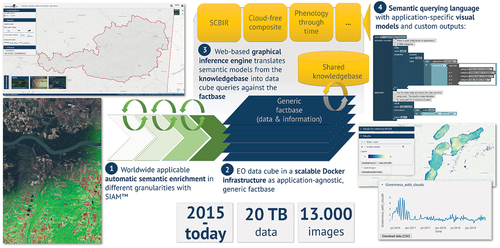
Implemented in a broader infrastructure encompassing the additional components, the semantic EO data cube for Austria contains 20 TB of data and organises 13.000 scenes (as of May 2022). While the GUI is the main access point, an API allows connecting additional clients, such as a command-line interface (CLI), a mobile client, or a toolbox for direct ArcGIS (ESRI) workflow integration. Semantic queries on categorical variables are resource-efficient and can be conducted on a single virtual machine in the cloud. The infrastructure is named after its first prototypical implementation, “Sentinel-2 Semantic Data Cube Austria” (https://sen2cube.at, accessed 17.05.2022), but has been successfully transferred also to other regions (e.g. North-Western Syria described in Augustin et al., Citation2019) and datasets (Advanced Very-High-Resolution Radiometer (AVHRR) and Sentinel-3). It implements a semantic EO data cube in a state-of-the-art cloud-based architecture and automates the semantic enrichment on a big EO data scale to demonstrate different applications of this concept ().
Figure 4. The semantic EO data cube infrastructure is built around a flexible, open-source EO data cube software. A knowledgebase contains semantic models, which are translated by a graphical inference engine into queries against an EO data cube, which contains images as well as semantically enriched information layers. Although it is a local EO data cube and larger EO data cubes exist, it implements its own processing workflows and a graphical approach for querying that would not be possible otherwise.
The development of a semantic EO data cube infrastructure demonstrates the benefits of open source EO data cube software that is flexible enough to be extended with custom components at different levels of the architecture, which goes beyond scripts or queries on the (end-)user side. The Sen2Cube.at prototype is self-hosted on a cloud infrastructure and has already been used in a variety of applications, including agricultural monitoring, soil sealing identification and deriving essential climate variables.
4.3. Digital Earth Africa
DE Africa (https://www.digitalearthafrica.org/, accessed 22.02.2022) is a continental-scale EO data cube initiative to provide decision-ready satellite-based information products to the region to help address sustainable development challenges and to improve economic growth through innovation of new applications. It was established in 2019 and has since become the largest ODC implementation. While sharing core architecture and proven application algorithms with DE Australia (Gavin et al., Citation2018), DE Africa infrastructure operates entirely within the Amazon Web Services (AWS), supported by the Amazon Sustainability Data Initiative (Amazon, Citation2022).
Initially funded by the Australian Government and the Helmsley Charitable Trust, DE Africa aims to develop a self-sustaining program with all operations and management hosted in Africa. As of early 2022, the DE Africa platform has been operational in AWS Africa (Cape Town) region for over a year, hosting over 3 petabytes of ARD and continental-wide services, providing insights on surface water (Halabisky et al., Citation2021), cropland extent (Burton et al., Citation2021) and vegetation cover. A program management office, hosted at the South African National Space Agency, is being set up. Similar regional-scale data management solutions are also being planned for the Pacific Island Countries and Territories and the Americas in the future. Though these are examples of regional data systems, they are also agile and interoperable with smaller-scale data solutions at the local level.
From the start of the DE Africa initiative, there was a strong desire from countries and local users to develop their own applications as well as integrate country-level or local-level datasets, sometimes confidential, into existing workflows. Leveraging ARD (Yuan et al., Citation2021), STAC and ODC, DE Africa has developed solutions for users to take advantage of both “big” data and “small” data systems. One example of such a system is the DE Africa Cube in a Box (CiaB) solution, which is now available (https://github.com/digitalearthafrica/cube-in-a-box, accessed 17.02.2022). The CiaB is a Docker-based ODC implementation that retrieves information on local availability of data from the main DE Africa ODC, which means that it can be rapidly deployed on a single computer or on an organisation’s local network. Using the CiaB does not require downloading data aside from streaming the data from the cloud when running an analysis, making it faster for a local user to undertake analysis.
Coexistence of large-scale and small-scale data solutions has demonstrated value to the region. Some of the impact examples include the study of grasslands and water extent near Lake Baringo, Kenya, to find new Rhino and Giraffe habitats, tracking of unregulated mining in Ghana, mapping of mangroves in Zanzibar to support conservation and improve climate resilience (Amazon, Citation2021), and monitoring of water bodies and the impact of droughts in the Okavango Delta in Botswana () (Mfundisi et al., Citation2022). For each of these cases, data from the continental-scale system is used, in combination with local datasets and knowledge, to gain a complete understanding and trust in the application to support decision making. To build capacity and develop small-scale analysis or prototypes, DE Africa users can use the free cloud-based JupyterLab environment (https://sandbox.digitalearth.africa/, accessed 22.02.2022). Once a local-scale analysis has been undertaken, it can potentially be run on the full DE Africa infrastructure for a continental solution.
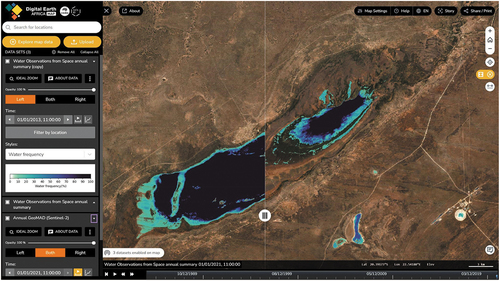
Figure 5. Screen capture of the DE Africa Map showing a comparison of the water detection frequency in 2013 (left panel) and 2021 (right panel) for Lake Ngami, located at the western part of the lower Okavango Delta in Botswana. Water extents are overlaid on a true color Sentinel-2 geomedian image from 2021.
4.4. Virginia Data Cube
An example of a small-scale EO data cube initiative is found in Virginia, United States. The “Data for Virginia” (Data4VA, https://www.data4va.org/, accessed 26.04.2022) initiative is a partnership between the Virginia Modeling and Simulation Center (VMASC), Virginia Institute for Spaceflight and Autonomy (VISA), NASA, and Analytical Mechanics Associates (AMA). Data4VA was launched in early 2020 to help solve Virginia’s greatest environmental and social challenges through the use of satellite data. The Data4VA system, operational since 2021, is available to a broad range of users, including state and local governments, educational institutions, and commercial entities. This partnership between government, academia and industry demonstrates the value of a free and open cloud-based common data management infrastructure that can take advantage of both large-scale global datasets and small-scale state or local datasets to impact local decision-making.
By creating an open data platform accessible to the entire state of Virginia, Data4VA will allow the use of satellite and local data to address issues including: habitat loss, urbanisation, pollution, fires, water quality and supply, energy, and coastal resiliency. Such a system is based on “data democratisation” and allows open access of the system to every person in the state. Once available to state users, this small-scale system will support increased innovation through the use of cloud computing, machine learning, and advanced analytics.
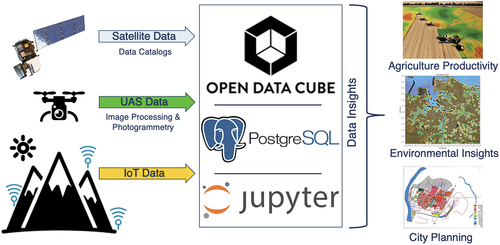
In addition to satellite data, there is a desire to add new and unique datasets to the Data4VA framework. Such data includes information collected from airborne and maritime platforms, drones, ground-based in-situ systems and Internet-of-Things (IoT). Bringing such data together in a common data cube platform will allow easier interoperable and integrated use of the data to address targeted applications such as coastal flooding and resiliency, climate change and wildfire behaviour. The convergence of local-based data with global-scale satellite data yields an infinite number of new opportunities for researchers and decision-makers ().
Figure 6. The integration of satellite data, drone data, and internet-of-things data can be accommodated with the Open Data Cube to support many targeted applications. These applications are better addressed with this combination of data in a common framework as opposed to inefficiently using these data in separate workflows.
Though this example focuses on Virginia, there are also other similar state-based data cube initiatives in the United States. For example, the Australian Government’s CSIRO is leading the formulation of the California Data Cube that will be used by state government organisations and educational institutions. In addition, there are early discussions for a state of Washington data cube as more states see the advantages of such an initiative. In the future, it is anticipated that more of these state-based EO data cubes will arise as there is a strong need and desire for small-scale data implementations that meet the needs of local users, integrate local datasets, and take advantage of the large-scale infrastructure data and applications.
5. Discussion
There are certain barriers to deploying and maintaining self-hosted EO data cubes, such as requiring skills in various domains (e.g. computer science, remote sensing, system administration, programming), or setup costs to obtain hardware (Dhu et al., Citation2019). Other potential long-term issues are requirements to keep local EO data cubes and the data up to date and interoperable, otherwise risking creating arrays of data silos and dependence on continuous investments. In contrast, large systems leveraging central and efficient facilities of large providers allow outsourcing a lot of these tasks. Such systems have opened many possibilities that would not otherwise be possible and allow individuals and smaller teams to tap into big EO data processing. Still, managing EO data and creating EO-based applications involves diverse stakeholders and players with different requirements and capabilities. Despite the effort and resources required, for some stakeholders (e.g. local or regional initiatives, companies with their own infrastructure), there are many reasons to set up and maintain a local EO data cube.
We presented four operational local EO data cubes from different parts of the world to highlight different aspects that they can offer. The aspects include enabling data sovereignty, options to use EO data cubes in new contexts or approaches, and allowing communities to access and use EO data tailored to their local context and needs. While all of the examples employ the ODC, this is not a statement about how local EO data cubes should be implemented now or in the future; however, the ODC was envisioned as a vehicle for achieving such implementations.
The ultimate vision of the ODC founding partners was to achieve a global network of connected regional EO data cubes that are self-sustaining and share core code and application algorithms among a vibrant community of users (Killough et al., Citation2020). By now, there are more than 100 operational country-level and several regional-scale EO data cubes in existence or under development (e.g. DE Australia, DE Africa, DE Pacific, DE Americas). Though such large-scale data solutions are important, the real impact is found at the local level. Collaboration and innovation among local users is the key to achieving success in the application of EO data.
A diversification of installations and a network of connected local EO data cubes raise questions about interoperability. Indeed, interoperability of EO data cubes is recognized as a significant challenge for the EO community. It is necessary to prevent them from becoming silos; therefore, enhancing the interoperability of EO data cubes is of fundamental importance (Giuliani et al., Citation2019a). However, this is not only a requirement for local EO data cube deployments but also if only few monolithic platforms exist. Instead of relying on solutions confined to a monolithic system, interoperability can be enabled through the implementation of existing and widely-adopted geospatial standards such as those from the Open Geospatial Consortium (OGC) (Giuliani et al., Citation2021); the implementation of new and emerging standards such as the STAC, COGs, or the OGC APIs (https://ogcapi.ogc.org, accessed 17.02.2022); finally an alternative is using a unified API, called openEO (https://openeo.org, 17.02.2022) that standardises EO data access and processing between heterogeneous local clients (e.g. R, Python, and JavaScript) and cloud service providers. Such API simplifies direct comparability and enables the creation of virtual EO data cubes independent of the providers’ data storage systems (Schramm et al., Citation2021). All these solutions can help deliver and leverage the power of EO data, build efficient discovery, access and processing services, and contribute to alleviating interoperability (1) among EO data cubes; (2) of EO data cubes with other types of geospatial data cubes and (3) of EO data cubes with general-purpose data cube infrastructures.
The cloud-native technologies STAC and COG allow clients to query a large amount of EO data over the Internet and use them efficiently on-demand in local EO data cubes. Using cloud-native technologies can lower the barriers to setting up and maintaining local EO data cube instances using public datasets as well as facilitate the local integration of additional datasets, which can be sensitive and require protection. Self-hosting a large amount of EO data is costly in terms of both complexity and storage costs and may be unnecessary for public data. The expanding availability of global cloud-native data stores, such as that provided by the USGS as part of their Landsat Collection 2 (https://www.usgs.gov/landsat-missions/landsat-collection-2, accessed 24.02.2022), go a long way towards enabling EO local cubes that do not need to organise local data. However, the details of how the technical implementation can be made effectively and efficiently are still to be investigated.
One of the core ideas behind the original DE vision is that everyone – exemplarily portrayed in the storyline by a schoolgirl representing all humans – can access the world’s knowledge and explore information about the planet. After investigating different perspectives in Section 3 and illustrating existing examples in Section 4, we identified several anchor points where local EO data cubes can contribute to the overarching DE vision by:
Integrating information. Global data provide insights into the Earth system but can also be merged with local or regional data. To produce information with local or regional relevance, existing local datasets, whether public or not, can be integrated or specific algorithms executed. A local EO data cube can facilitate an infrastructure for answering questions or providing information specific to a local environment.
Maintaining independence. Local EO data cube deployments allow local communities or nations to maintain their own data if they cannot be shared and infrastructure without the requirement to rely on other players. Therefore, this can limit the dependency on external information itself or its access.
Accessing information. The information access can be tailored to a community and their specific needs or requirements. Such needs or requirements may range from cultural differences to technical obstacles such as internet connectivity.
Fostering participation and engagement. Avoiding a one-way or even top-down information flow requires options to participate and engage a local community. Such an engagement not only increases the transparency about the impacts of decisions but can also be linked to citizen science concepts, using specific, local knowledge of the environment to produce information and interpret results.
Producing information. Local EO data cubes can enable scientific workflows that require in-depth access to the individual components of the system. Further, they can improve scientific investigations in general by incorporating local or regional data and engaging local communities and their knowledge. In addition, they allow not only to share information but also the tools used to produce it.
Understanding technical systems. In addition to the produced information itself, how systems work, including their underlying assumptions, limitations, and potential for improvements, is part of the world’s knowledge. Educating the next generation can, therefore, be part of the DE vision and allows EO data cubes to be adjusted for local requirements. Further, it may even spark the development of new technologies that solve problems better than existing ones.
Further developments and technical solutions are still required for an implementation of the DE vision using local EO data cubes, such as linking local EO data cubes into the world’s knowledge bases, algorithm sharing and interoperability, simplified setups (e.g. following the CiaB solution), and activities for education and capacity building. Once achieved, a global network of local EO data cubes should not be seen as a contradiction to the DE vision with the current “system of interconnected systems” interpretations (Liu et al., Citation2020).
In our investigation, we focussed on five selected perspectives to illustrate different views on local EO data cubes and four implementation examples. Our approach and the results are not an exhaustive inventory but rather a selection and a snapshot in time. Additional investigations are required and encouraged to fill gaps or provide different viewpoints or contexts. Such investigations are important to guide for future developments because it is expected that there will be no single best (technical) solution which is capable of solving every problem in an optimised way. Regular, frequent, open, and free global EO data paired with the vision of DE means that systems are being built to investigate and monitor anywhere on Earth for an unimaginable array of purposes. Therefore, there are undoubtedly many perspectives that require additional consideration. As a particular example, it can be mentioned that it is important to consider who may be forgotten when evaluating potential unintentional impacts of EO data cubes, whether implemented locally or not. Power imbalances that are created by remote sensing technologies are beginning to be discussed (Davis et al., Citation2021; Hargreaves & Watmough, Citation2021) but are still often overlooked. This means that EO data infrastructures, regardless of how they are implemented or by whom, and EO-informed decisions, even if well-intentioned, may disproportionately impact a variety of groups of people who may not have been considered or listed.
6. Conclusion and outlook
To efficiently manage the large amount of EO data delivered by satellites every day, access to large infrastructures that can lift the computational requirements of big Earth data seemed inevitably necessary. However, there have always been limitations and concerns associated with it. At the same time, freely accessible EO data cube software became one of the most popular EO data management tools, global ARD can be streamed to local infrastructure, and owning computing resources became financially tangible again. In this paper, we investigated whether the implementation and maintenance of self-hosted local EO data cubes (EO data cubes with a regional or local focus) have benefits and advantages.
We argue and conclude that “think global, cube local” as an approach to creating a network of interconnected EO data cubes with specific thematic or geographic foci is a worthwhile effort. Local EO data cubes allow more users to use and contribute to EO data analytics and increase local communities’ engagement and participation. Further, they allow users to bring in their own datasets that may be sensitive, not based on EO, have a geographical focus, or come from new and innovative EO platforms (e.g. drones, internet-of-things). Bringing these local datasets into a user’s EO data cube workflow can enable new analyses and product development, otherwise not possible with large-scale systems. In addition, local EO data cubes allow users to control all parts of the technology stack offering the flexibility to make more efficient and effective implementation decisions. More profound educational and capacity building activities are possible. In all of these activities, it is still possible to have global efforts such as the SDGs in mind. In conclusion, local EO data cubes feature ideas of the DE vision, where the information, and ultimately the accessibility and comprehension, about our planet is at its core.
Open source EO data cubes are a scalable and versatile technical solution to provide an analytical platform for big EO data. They can be deployed and are useful both on various geographical scales, from local to global applications, and by a diverse group of users, from small research teams that use EO data cubes for their study to big organisations that provide global services on top of it. A network of local EO data cubes should not replace existing approaches but rather augment the toolkit that users have at their hands. For an increasing number of stakeholders, self-hosted implementations are possible in a “system of systems” deployment, similar to popular file clouds such as OwnCloud and NextCloud. Local EO data cubes go beyond a “one-size-fits-all” approach. They can be a source for better adaptation to local requirements, follow principles of openness to boost innovation, create an international network intentionally positioned for new user uptake, allow for flexibility, and avoid commercial vendor lock-in.
There are still open questions and room for improvements in all five investigated perspectives. We provided an overview, but more studies are required to quantify the advantages and disadvantages. On the technical side, achieving semantic and syntactic interoperability between local EO data cubes remains one of the main challenges. Much effort has been made in the last years to conceptualise and develop agreed-upon standards, such as STAC, to support interoperability and FAIR data principles. Additional questions are about how education and capacity building can be achieved with local EO data cubes, including ensuring that users are digitally literate and can choose the best tool for their purpose. It is essential to create and implement efficient workflows in political and business contexts and understand their impact on operational decision-making. Lastly, based on the five perspectives, our approach to this topic is a selection and snapshot. Relevant different approaches can contribute to an extension of the view, similar to how revisiting these findings in the future can allow statements about improvements, changes, or remaining gaps.
Acknowledgements
The authors would like to thank the Swiss Federal Office for the Environment (FOEN) for their financial and Institutional support regarding the development of the Swiss Data Cube, the University of Geneva for financing the IT infrastructure. Results of this publication are partly relying on the Swiss Data Cube (http://www.swissdatacube.org), operated and maintained by UNEP/GRID-Geneva, the University of Geneva, the University of Zurich and the Swiss Federal Institute for Forest, Snow and Landscape Research WSL.
The research on the Austrian Sen2Cube.at semantic EO data cube was funded by the Austrian Research Promotion Agency (FFG) under the Austrian Space Application Programme (ASAP) within the projects Sen2Cube.at (project no.:866016), SemantiX (project no.: 878939) and SIMS (project no.: 885365).
Disclosure statement
No potential conflict of interest was reported by the author(s).
Data availability statement
Data sharing is not applicable to this article as no new data were created or analyzed in this study.
Additional information
Notes on contributors

Martin Sudmanns
Martin Sudmanns, Dr., is postdoctoral researcher at the Paris Lodron University Salzburg, Department of Geoinformatics, Austria, and co-head of the research area EO Analytics. His research focuses on Geoinformatics, computer-based representation of natural phenomena in spatial data models, spatio-temporal Earth observation analysis in the context of data cubes and big EO data.

Hannah Augustin
Hannah Augustin, MSc, is a PhD researcher in Earth observation (EO) Analytics at the Paris Lodron University of Salzburg, Department of Geoinformatics, Austria with a research focus on semantic EO data cubes, and automated and transferable processes for generating EO-informed indicators from big optical EO imagery.

Brian Killough
Brian Killough, Dr., has 35 years of NASA experience and leads the Committee on Earth Observing Satellites (CEOS) Systems Engineering Office. The SEO supports the international CEOS organization coordinating satellite earth observation data for global benefit. Dr. Killough has played a significant role in the evolution of the Open Data Cube initiative and the development of regional data cubes in Africa, the Americas and the Pacific Islands. Dr. Killough has authored over 20 technical papers and received the NASA Exceptional Service Medal in 2016 and the 2021 GEO Individual Excellence Award.
Gregory Giuliani
Gregory Giuliani, Dr., is the Head of the Digital Earth Unit and Swiss Data Cube Project Leader at GRID-Geneva of the United Nations Environment Programme (UNEP) and a Senior Lecturer at the University of Geneva’s Institute for Environmental Sciences. He is a geologist and environmental scientist who specialises in Remote Sensing, Geographical Information Systems (GIS) and Spatial Data Infrastructures (SDI). He also works at GRID-Geneva of the UnitedNations Environment Programme (UNEP) since 2001, where he was previously the focal point for Spatial Data Infrastructure (SDI) and is currently the Head of the Digital Earth Unit. Dr. Giuliani’s research focuses on Land Change Science and how Earth observations can be used to monitor and assess environmental changes and support sustainable development.

Dirk Tiede
Dirk Tiede, Dr., is Associate Professor at the University of Salzburg, Department of Geoinformatics – Z_GIS, Austria, and co-head of the research area EO Analytics. His research focuses on methodological developments in image analysis using optical EO data, object-based methodologies and process automation in the context of Big EO data analysis. Research fields include environmental monitoring and support of humanitarian relief operations, for which he received the Christian-Doppler-Award of the Federal State of Salzburg in 2014.

Alex Leith
Alex Leith, Assistant Director, Digital Earth Africa Technologies at Geoscience Australia. Alex Leith is a technical leader at Geoscience Australia, who works with a team of software developers and data engineers to enable people to more easily work with Earth observation data. Alex graduated with a degree in Surveying and Spatial Information Sciences with honours in 2011, and was certified as a Geographic Information Systems Professional in 2015.

Fang Yuan
Fang Yuan, Dr., is the Director of Operations for the Digital Earth Africa establishment team in Geoscience Australia. Fang is an astrophysicist and an Earth observation scientist, with expertise in optical and radar remote sensing and image and spatial analysis. Fang has led the development of EO-based products for natural resources mapping, disaster management, and land cover change monitoring for Australia and Africa.
Adam Lewis
Adam Lewis, Dr., is Senior Advisor to Digital Earth Africa, with over 30 years of experience in marine and terrestrial natural resources management, spatial information analysis and Earth observation. He led the development of the Australian Geoscience Data Cube, played a significant role in the creation and evolution of the Open Data Cube, and contributed to the development of Analysis Ready Data through the Committee on Earth Observing Satellites (CEOS). In 2020, Dr. Lewis was recognised with the Australian Public Service Medal.
References
- Amazon. (2021). Climate Next: How data and community can save Zanzibar’s mangroves. Retrieved from https://www.aboutamazon.com/news/aws/climate-next-how-data-and-community-can-save-zanzibars-mangroves
- Amazon. (2022). Amazon Sustainability Data Initiative (ASDI). Retrieved from https://sustainability.aboutamazon.com/environment/the-cloud/asdi
- Anderson, K., Ryan, B., Sonntag, W., Kavvada, A., & Friedl, L. (2017). Earth observation in service of the 2030 agenda for sustainable development. Geo-Spatial Information Science, 20(2), 77–96. doi:10.1080/10095020.2017.1333230
- Andries, A., Morse, S., Murphy, R., Lynch, J., Woolliams, E., & Fonweban, J. (2019). Translation of Earth observation data into sustainable development indicators: An analytical framework. Sustainable Development, 27(3), 366–376. doi:10.1002/sd.1908
- Aschbacher, J., & Milagro-Pérez, M. P. (2012). The European Earth monitoring (GMES) programme: Status and perspectives. Remote Sensing of Environment, 120, 3–8. doi:10.1016/j.rse.2011.08.028
- Augustin, H., Sudmanns, M., Tiede, D., Lang, S., & Baraldi, A. (2019). Semantic earth observation data cubes. Data, 4(3), 102. doi:10.3390/data4030102
- Barras, A. G., Braunisch, V., Arlettaz, R., & Maiorano, L. (2021). Predictive models of distribution and abundance of a threatened mountain species show that impacts of climate change overrule those of land use change. Diversity & Distributions, 27(6), 989–1004. doi:10.1111/ddi.13247
- Baumann, P., Dehmel, A., Furtado, P., Ritsch, R., & Widmann, N. (1998). The multidimensional database system RasDaman. ACM SIGMOD Record, 27(2), 575–577. doi:10.1145/276305.276386
- Baumann, P., Mazzetti, P., Ungar, J., Barbera, R., Barboni, D., Beccati, A. … Wagner, S. (2016). Big data analytics for earth sciences: The earthserver approach. International Journal of Digital Earth, 9(1), 3–29. doi:10.1080/17538947.2014.1003106
- Burgelman, J.-C., Pascu, C., Szkuta, K., Von Schomberg, R., Karalopoulos, A., Repanas, K., & Schouppe, M. (2019). Open science, open data, and open scholarship: European policies to make science fit for the twenty-first century. Frontiers in Big Data, 2, 43. doi:10.3389/fdata.2019.00043
- Burton, C., Yuan, F., Ee-Faye, C., Halabisky, M., Ongo, D., Mar, F., … Adimou, S. (2021, December 13–17). Co-Production of a 10-m cropland extent map for continental Africa using Sentinel-2, Cloud computing, and the open-data-cube. In Geography. American Geophysical Union Fall Meeting 2021, New Orleans, LA, USA. doi:10.1002/essoar.10510081.1
- Chatenoux, B., Richard, J.-P., Small, D., Roeoesli, C., Wingate, V., Poussin, C., Rodila, D., Peduzzi, P., Steinmeier, C.,Ginzler, C., Psomas, A., Schaepman, M. E., & Giuliani, G. (2021). The Swiss data cube, analysis ready data archive using earth observations of Switzerland. Scientific Data, 8(1), 295. doi:10.1038/s41597-021-01076-6
- Cloudscene. (2022). Number of data centers worldwide in 2022, by country. Statista. Retrieved from https://www.statista.com/statistics/1228433/data-centers-worldwide-by-country/
- Craglia, M., de Bie, K., Jackson, D., Pesaresi, M., Remetey-Fülöpp, G., Wang, C. … Woodgate, P. (2012). Digital Earth 2020: Towards the vision for the next decade. International Journal of Digital Earth, 5(1), 4–21. doi:10.1080/17538947.2011.638500
- Craglia, M., & Nativi, S. (2018). Mind the Gap: Big Data vs. interoperability and reproducibility of science. In P.-P. Mathieu & C. Aubrecht (Eds.), Earth observation open science and innovation (pp. 121–141). Springer International Publishing. doi:10.1007/978-3-319-65633-5_6
- CSIRO. (2022). Earth analytics science and innovation (EASI) platform. Retrieved from https://research.csiro.au/cceo/underpinning-technologies/earth-analytics/
- Davis, D. S., Buffa, D., Rasolondrainy, T., Creswell, E., Anyanwu, C., Ibirogba, A., Randolph, C., Ouarghidi, A., Phelps, L. N.,Lahiniriko, F., Chrisostome, Z. M., Manahira, G., & Douglass, K. (2021). The aerial panopticon and the ethics of archaeological remote sensing in sacred cultural spaces. Archaeological Prospection, 28(3), 305–320. doi:10.1002/arp.1819
- Dhu, T., Giuliani, G., Juárez, J., Kavvada, A., Killough, B., Merodio, P. … Ramage, S. (2019). National open data cubes and their contribution to country-level development policies and practices. Data, 4(4), 144. doi:10.3390/data4040144
- Dwyer, J., Roy, D., Sauer, B., Jenkerson, C., Zhang, H., & Lymburner, L. (2018). Analysis ready data: Enabling analysis of the landsat archive. Remote Sensing, 10(9), 1363. doi:10.3390/rs10091363
- European Commission. Directorate General for Internal Market, Industry, Entrepreneurship and SMEs. & PwC. (2019). Copernicus market report: February 2019. Issue 2. Publications Office. https://data.europa.eu/doi/10.2873/011961
- European Commission. Directorate General for Research and Innovation. (2018). Turning FAIR into reality: Final report and action plan from the European Commission expert group on FAIR data. Publications Office. https://data.europa.eu/doi/10.2777/1524
- European Commission. Joint Research Centre. (2017). Proceedings of the 2017 conference on Big Data from Space (BIDS’ 2017): 28th 30th November 2017 Toulouse (France). Publications Office. https://data.europa.eu/doi/10.2760/383579
- The European Parliament and the council of the European Union. (2019). Directive 2019/1024 of the European Parliament and of the council on open data and the re-use of public sector information. https://eur-lex.europa.eu/legal-content/EN/TXT/HTML/?uri=CELEX:32019L1024&from=EN
- European Union Agency for the Space Programme (EUSPA). (2022). EO and GNSS Market Report. Publications Office of the European Union. Retrieved February 17, 2022, from https://www.euspa.europa.eu/sites/default/files/uploads/euspa_market_report_2022.pdf
- Gavin, D., Dhu, T., Sagar, S., Mueller, N., Dunn, B., Lewis, A., … Thankappan, M. (2018). Digital Earth Australia—From Satellite Data to Better Decisions. In IGARSS 2018 - 2018 IEEE International Geoscience and Remote Sensing Symposium (pp. 8633–8635). doi:10.1109/IGARSS.2018.8518160
- Giuliani, G., Chatenoux, B., De Bono, A., Rodila, D., Richard, J.-P., Allenbach, K., Dao, H., & Peduzzi, P. (2017). Building an Earth Observations Data Cube: Lessons learned from the Swiss Data Cube (SDC) on generating Analysis Ready Data (ARD). Big Earth Data, 1(1–2), 100–117. doi:10.1080/20964471.2017.1398903
- Giuliani, G., Chatenoux, B., Honeck, E., & Richard, J.-P. (2018). Towards Sentinel-2 analysis ready data: A Swiss data cube perspective. In IGARSS 2018 - 2018 IEEE International Geoscience and Remote Sensing Symposium (pp. 8659–8662). doi:10.1109/IGARSS.2018.8517954
- Giuliani, G., Camara, G., Killough, B., & Minchin, S. (2019a). Earth observation open science: enhancing reproducible science using data cubes. Data, 4(4), 147. doi:10.3390/data4040147
- Giuliani, G., Masó, J., Mazzetti, P., Nativi, S., & Zabala, A. (2019b). Paving the way to increased interoperability of earth observations data cubes. Data, 4(3), 113. doi:10.3390/data4030113
- Giuliani, G., Chatenoux, B., Benvenuti, A., Lacroix, P., Santoro, M., & Mazzetti, P. (2020a). Monitoring land degradation at national level using satellite earth observation time-series data to support SDG15 – exploring the potential of data cube. Big Earth Data, 4(1), 3–22. doi:10.1080/20964471.2020.1711633
- Giuliani, G., Egger, E., Italiano, J., Poussin, C., Richard, J.-P., & Chatenoux, B. (2020b). Essential variables for environmental monitoring: What are the possible contributions of earth observation data cubes? Data, 5(4), 100. doi:10.3390/data5040100
- Giuliani, G., Cazeaux, H., Burgi, P.-Y., Poussin, C., Richard, J.-P., & Chatenoux, B. (2021). SwissEnveo: A FAIR national environmental data repository for earth observation open science. Data Science Journal, 20(1), 22. doi:10.5334/dsj-2021-022
- Gomes, V., Queiroz, G., & Ferreira, K. (2020). An overview of platforms for big earth observation data management and analysis. Remote Sensing, 12(8), 1253. doi:10.3390/rs12081253
- Google. (2021). Helping companies tackle climate change with Earth Engine. Retrieved from https://blog.google/products/earth/earth-engine-preview-google-cloud/
- Gore, A. (1998). The digital earth: Understanding our planet in the 21st Century. Australian Surveyor, 43(2), 89–91. doi:10.1080/00050348.1998.10558728
- Grainger, A. (2017). Citizen observatories and the new earth observation science. Remote Sensing, 9(2), 153. doi:10.3390/rs9020153
- Halabisky, M., Mubea, K., Mar, F., Yuan, F., Burton, C., Birchall, E., Fouladi Moghaddam, N., Adimou, G., Mamane, B., Ongo, D., Boamah, E., Chong, E.-F., Gandhi, N., Leith, A., Hall, L., & Lewis, A. (2021, December 13–17). Water Observations from Space: Accurate maps of surface water through time for the continent of Africa. In American Geophysical Union Fall Meeting 2021, New Orleans, LA, USA. doi:10.1002/essoar.10510203.1
- Hargreaves, P. K., & Watmough, G. R. (2021). Satellite Earth observation to support sustainable rural development. International Journal of Applied Earth Observation and Geoinformation, 103, 102466. doi:10.1016/j.jag.2021.102466
- Hofer, B., Lang, S., & Ferber, N. (2020). Future occupational profiles in Earth observation and geoinformation—scenarios resulting from changing workflows. In P. Kyriakidis, D. Hadjimitsis, D. Skarlatos, & A. Mansourian (Eds.), Geospatial technologies for local and regional development (pp. 349–366). Springer International Publishing. doi:10.1007/978-3-030-14745-7_19
- Honeck, E., Castello, R., Chatenoux, B., Richard, J.-P., Lehmann, A., & Giuliani, G. (2018). From a vegetation index to a sustainable development goal indicator: forest trend monitoring using three decades of earth observations across Switzerland. ISPRS International Journal of Geo-Information, 7(12), 455. doi:10.3390/ijgi7120455
- Hoyer, S., & Hamman, J. J. (2017). Xarray: N-D labeled arrays and datasets in Python. Journal of Open Research Software, 5(1), 10. doi:10.5334/jors.148
- Hummel, P., Braun, M., Tretter, M., & Dabrock, P. (2021). Data sovereignty: A review. Big Data & Society, 8(1), 2053951720982012. doi:10.1177/2053951720982012
- Janowicz, K., & Hitzler, P. (2017). Geospatial semantic web. In D. Richardson, N. Castree, M. F. Goodchild, A. Kobayashi, W. Liu, & R. A. Marston (Eds.), International encyclopedia of geography: people, the earth, environment and technology (pp. 1–6). John Wiley & Sons, Ltd. doi:10.1002/9781118786352.wbieg1158
- Kavvada, A., Metternicht, G., Kerblat, F., Mudau, N., Haldorson, M., Laldaparsad, S., Friedl, L., Held, A., & Chuvieco, E. (2020). Towards delivering on the Sustainable Development Goals using Earth observations. Remote Sensing of Environment, 247, 111930. doi:10.1016/j.rse.2020.111930
- Kganyago, M., & Mhangara, P. (2019). The role of African emerging space agencies in earth observation capacity building for facilitating the implementation and monitoring of the African development agenda: The case of African earth observation program. ISPRS International Journal of Geo-Information, 8(7), 292. doi:10.3390/ijgi8070292
- Killough, B., Siqueira, A., & Dyke, G. (2020). Advancements in the open data cube and analysis ready data—past, present and future. In IGARSS 2020 - 2020 IEEE International Geoscience and Remote Sensing Symposium (pp. 3373–3375). doi:10.1109/IGARSS39084.2020.9324712
- Knoth, C., & Nüst, D. (2017). Reproducibility and practical adoption of GEOBIA with open-source software in docker containers. Remote Sensing, 9(3), 290. doi:10.3390/rs9030290
- Koers, H., Bangert, D., Hermans, E., van Horik, R., de Jong, M., & Mokrane, M. (2020). Recommendations for services in a FAIR data ecosystem. Patterns, 1(5), 100058. doi:10.1016/j.patter.2020.100058
- Kumar, L., & Mutanga, O. (2018). Google earth engine applications since inception: Usage, trends, and potential. Remote Sensing, 10(10), 1509. doi:10.3390/rs10101509
- Lewis, A., Lymburner, L., Purss, M. B. J., Brooke, B., Evans, B., Ip, A., Dekker, A. G., Irons, J. R., Minchin, S.,Mueller, N., Oliver, S., Roberts, D., Ryan, B., Thankappan, M., Woodcock, R., & Wyborn, L. (2016). Rapid, high-resolution detection of environmental change over continental scales from satellite data – the Earth Observation Data Cube. International Journal of Digital Earth, 9(1), 106–111. doi:10.1080/17538947.2015.1111952
- Lewis, A., Oliver, S., Lymburner, L., Evans, B., Wyborn, L., Mueller, N., Raevksi, G., Hooke, J., Woodcock, R.,Sixsmith, J., Wu, W., Tan, P., Li, F., Killough, B., Minchin, S., Roberts, D.,Ayers, D., Bala, B., Dwyer, J. … Wang, L.-W. (2017). The Australian Geoscience Data Cube—Foundations and lessons learned. Remote Sensing of Environment, 202, 276–292. doi:10.1016/j.rse.2017.03.015
- Lewis, A., Lacey, J., Mecklenburg, S., Ross, J., Siqueira, A., Killough, B., Szantoi, Z., Tadono, T., Rosenavist, A.,Goryl, P., Miranda, N., & Hosford, S. (2018). CEOS Analysis Ready Data for Land (CARD4L) Overview. In IGARSS 2018 - 2018 IEEE International Geoscience and Remote Sensing Symposium (pp. 7407–7410). doi:10.1109/IGARSS.2018.8519255
- Liang, J., Gong, J., & Li, W. (2018). Applications and impacts of Google Earth: A decadal review (2006–2016). ISPRS Journal of Photogrammetry and Remote Sensing, 146, 91–107. doi:10.1016/j.isprsjprs.2018.08.019
- Liu, Z., Foresman, T., van Genderen, J., & Wang, L. (2020). Understanding digital earth. In H. Guo, M. F. Goodchild, & A. Annoni (Eds.), Manual of digital earth (pp. 1–21). Springer Singapore. doi:10.1007/978-981-32-9915-3_1
- Loveland, T. R., & Dwyer, J. L. (2012). Landsat: Building a strong future. Remote Sensing of Environment, 122, 22–29. doi:10.1016/j.rse.2011.09.022
- Mahecha, M. D., Gans, F., Brandt, G., Christiansen, R., Cornell, S. E., Fomferra, N. … Reichstein, M. (2020). Earth system data cubes unravel global multivariate dynamics. Earth System Dynamics, 11(1), 201–234. doi:10.5194/esd-11-201-2020
- Maier, D., & Vance, B. (1993). A call to order. In Proceedings of the Twelfth ACM SIGACT-SIGMOD-SIGART Symposium on Principles of Database Systems - PODS ’93 (pp. 1–16). doi:10.1145/153850.153851
- Mazzetti, P., Nativi, S., Santoro, M., Giuliani, G., Rodila, D., Folino, A., Caruso, S., Aracri, G., & Lehmann, A. (2022). Knowledge formalization for Earth Science informed decision-making: The GEOEssential Knowledge Base. Environmental Science & Policy, 131, 93–104. doi:10.1016/j.envsci.2021.12.023
- Mei-Po, K. (2016). Algorithmic geographies: big data, algorithmic uncertainty, and the production of geographic knowledge. E, Annals of the American Association of Geographers, 106(2), 274–282. doi:10.1080/00045608.2015.1117937
- Mfundisi, K., Mubea, K., Yuan, F., Burton, C., & Boamah, E. (2022). Analysing effects of drought on inundation extent and vegetation cover dynamics in the Okavango Delta. In AGU 2021 Fall Meeting. New Orleans: LA and virtual. doi:10.1002/essoar.10510000.2
- Mueller, N., Lewis, A., Roberts, D., Ring, S., Melrose, R., Sixsmith, J., Lymburner, L., McIntyre, A., Tan, P., Curnow, S., & Ip, A. (2016). Water observations from space: Mapping surface water from 25 years of Landsat imagery across Australia. Remote Sensing of Environment, 174, 341–352. doi:10.1016/j.rse.2015.11.003
- Nativi, S., Mazzetti, P., & Craglia, M. (2017). A view-based model of data-cube to support big earth data systems interoperability. Big Earth Data, 1(1–2), 75–99. doi:10.1080/20964471.2017.1404232
- Nüst, D., Granell, C., Hofer, B., Konkol, M., Ostermann, F. O., Sileryte, R., & Cerutti, V. (2018). Reproducible research and GIScience: An evaluation using AGILE conference papers. PeerJ, 6, e5072. doi:10.7717/peerj.5072
- Poussin, C., Guigoz, Y., Palazzi, E., Terzago, S., Chatenoux, B., & Giuliani, G. (2019). Snow cover evolution in the Gran Paradiso National Park, Italian Alps, Using the earth observation data cube. Data, 4(4), 138. doi:10.3390/data4040138
- Poussin, C., Massot, A., Ginzler, C., Weber, D., Chatenoux, B., Lacroix, P., Piller, T., Nguyen, L., & Giuliani, G. (2021). Drying conditions in Switzerland – indication from a 35-year Landsat time-series analysis of vegetation water content estimates to support SDGs. Big Earth Data, 5(4), 445–475. doi:10.1080/20964471.2021.1974681
- Purss, M. B. J., Lewis, A., Oliver, S., Ip, A., Sixsmith, J., Evans, B., Edberg, R., Frankish, G., Hurst, L., & Chan, T. (2015). Unlocking the Australian Landsat Archive – from dark data to High Performance Data infrastructures. GeoResj, 6, 135–140. doi:10.1016/j.grj.2015.02.010
- Schramm, M., Pebesma, E., Milenković, M., Foresta, L., Dries, J., Jacob, A., Wagner, W., Mohr, M., Neteler, M., Kadunc, M.,Miksa, T., Kempeneers, P., Verbesselt, J., Gößwein, B., Navacchi, C., Lippens, S., & Reiche, J. (2021). The openEO API–Harmonising the Use of Earth Observation Cloud Services Using Virtual Data Cube Functionalities. Remote Sensing, 13(6), 1125. doi:10.3390/rs13061125
- Scoones, I., Hall, R., Borras, S. M., White, B., & Wolford, W. (2013). The politics of evidence: Methodologies for understanding the global land rush. The Journal of Peasant Studies, 40(3), 469–483. doi:10.1080/03066150.2013.801341
- Simoes, R., Camara, G., Queiroz, G., Souza, F., Andrade, P. R., Santos, L., Carvalho, A., & Ferreira, K. (2021). Satellite Image Time Series Analysis for Big Earth Observation Data. Remote Sensing, 13(13), 2428. doi:10.3390/rs13132428
- Stonebraker, M., Brown, P., Poliakov, A., & Raman, S. (2011). The architecture of SciDB. In J. B. Cushing, J. French, & S. Bowers (Eds.), Scientific and statistical database management (Vol. 6809, pp. 1–16). Berlin Heidelberg: Springer. doi:10.1007/978-3-642-22351-8_1
- Storch, T., Reck, C., Holzwarth, S., Wiegers, B., Mandery, N., Raape, U., Strobl, C., Volkmann, R., Böttcher, M., Hirner, A., Senft, J., Plesia, N., Kukuk, T., Meissl, S., Felske, J.-R., Heege, T.,Keuck, V., Schmidt, M., & Staudenrausch, H. (2019). Insights into CODE-DE Germany’s Copernicus data and exploitation platform. Big Earth Data, 3(4), 338–361. doi:10.1080/20964471.2019.1692297
- Strobl, P., Baumann, P., Lewis, A., Szantoi, Z., Killough, B., Purss, M., Craglia, M., Nativi, S., Held, A., & Dhu, T. (2017). The six faces of the data cube. Publications Office of the European Union. doi:10.2760/383579
- Sudmanns, M., Tiede, D., Lang, S., Bergstedt, H., Trost, G., Augustin, H., Baraldi, A., & Blaschke, T. (2020). Big Earth data: Disruptive changes in Earth observation data management and analysis? International Journal of Digital Earth, 13(7), 832–850. doi:10.1080/17538947.2019.1585976
- Sudmanns, M., Augustin, H., van der Meer, L., Baraldi, A., & Tiede, D. (2021a). The Austrian semantic EO data cube infrastructure. Remote Sensing, 13(23), 4807. doi:10.3390/rs13234807
- Sudmanns, M., Augustin, H., van der Meer, L., Werner, C., Baraldi, A., & Tiede, D. (2021b). One GUI to rule them all: Accessing multiple semantic EO data cubes in one graphical user interface. Gi_forum, 1, 53–59. doi:10.1553/giscience2021_01_s53
- Tan, D. T., Siri, J. G., Gong, Y., Ong, B., Lim, S. C., MacGillivray, B. H., & Marsden, T. (2019). Systems approaches for localising the SDGs: Co-production of place-based case studies. Globalization and Health, 15(1), 85. doi:10.1186/s12992-019-0527-1
- Thornton, J. M., Palazzi, E., Pepin, N. C., Cristofanelli, P., Essery, R., Kotlarski, S., Giuliani, G., Guigoz, Y., Kulonen, A., Pritchard, D., Li, X., Fowler, H. J., Randin, C. F., Shahgedanova, M.,Steinbacher, M., Zebisch, M., & Adler, C. (2021). Toward a definition of Essential Mountain Climate Variables. One Earth, 4(6), 805–827. doi:10.1016/j.oneear.2021.05.005
- Tondapu, G., Markert, K., Lindquist, E., Wiell, D., Díaz, A.-S.-P., Johnson, G., Ashmall, W., Chishtie, F., Ate, P., Tenneson, K., Patterson, M. S., Ricci, S., Fontanarosa, R., & Saah, D. (2018). A SERVIR FAO Open Source Partnership: Co-development of Open Source Web Technologies using Earth Observation for Land Cover Mapping. In AGU Fall Meeting Abstracts. AGU Fall Meeting, Washington, DC, USA.
- Truckenbrodt, J., Freemantle, T., Williams, C., Jones, T., Small, D., Dubois, C., Thiel, C., Rossi, C., Syriou, A., & Giuliani, G. (2019). Towards Sentinel-1 SAR Analysis-Ready Data: A Best Practices Assessment on Preparing Backscatter Data for the Cube. Data, 4(3), 93. doi:10.3390/data4030093
- Wagemann, J., Clements, O., Marco Figuera, R., Rossi, A. P., & Mantovani, S. (2018). Geospatial web services pave new ways for server-based on-demand access and processing of Big Earth Data. International Journal of Digital Earth, 11(1), 7–25. doi:10.1080/17538947.2017.1351583
- Wagemann, J., Siemen, S., Seeger, B., & Bendix, J. (2021). A user perspective on future cloud-based services for Big Earth data. International Journal of Digital Earth, 14(12), 1758–1774. doi:10.1080/17538947.2021.1982031
- Wilkinson, M. D., Dumontier, M., Aalbersberg, I. J., Appleton, G., Axton, M., Baak, A., Blomberg, N., Boiten, J.-W., da Silva Santos, L. B., Bourne, P. E., Bouwman, J., Brookes, A. J., Clark, T., Crosas, M.,Dillo, I., Dumon, O., Edmunds, S., Evelo, C. T., Finkers, R., … Mons, B. (2016). The FAIR Guiding Principles for scientific data management and stewardship. Scientific Data, 3(1), 160018. doi:10.1038/sdata.2016.18
- Xu, C., Du, X., Jian, H., Dong, Y., Qin, W., Mu, H., Yan, Z., Zhu, J., & Fan, X. (2022). Analyzing large-scale Data Cubes with user-defined algorithms: A cloud-native approach. International Journal of Applied Earth Observation and Geoinformation, 109, 102784. doi:10.1016/j.jag.2022.102784
- Yuan, F., Lewis, A., Leith, A., Dhar, T., & Gavin, D. (2021). Analysis Ready Data for Africa. In 2021 IEEE International Geoscience and Remote Sensing Symposium IGARSS (pp. 1789–1791). doi:10.1109/IGARSS47720.2021.9554019
- ZAMG. (2021). Freier Zugang zu hochwertigen Wetterdaten. Retrieved from https://www.zamg.ac.at/cms/de/aktuell/news/freier-zugang-zu-hochwertigen-wetterdaten
- Zawacki-Richter, O., Conrad, D., Bozkurt, A., Aydin, C. H., Bedenlier, S., Jung, I., Stöter, J., Veletsianos, G., Blaschke, L. M., Bond, M., Broens, A., Bruhn, E., Dolch, C., Kalz, M., Kondakci, Y., Marin, V., Mayrberger, K., Müskens, W., Naidu, S., … Xiao, J. (2020). Elements of Open Education: An Invitation to Future Research. The International Review of Research in Open and Distributed Learning, 21(3). doi:10.19173/irrodl.v21i3.4659