
 ?Mathematical formulae have been encoded as MathML and are displayed in this HTML version using MathJax in order to improve their display. Uncheck the box to turn MathJax off. This feature requires Javascript. Click on a formula to zoom.
ABSTRACT
Big Earth Data refers to the multidimensional integration and association of scientific data, including geography, resources, environment, ecology, and biology. An effective data classification system and label management strategy are important foundations for long-term management of data resources. The objective of this study was to construct a classification system and realize multidimensional semantic data label management for the Big Earth Data Science Engineering Program (CASEarth). This study constructed two sets of classification and coding systems that realize classification by mapping each other; namely, the geosphere-level and Sustainable Development Goals (SDGs) indicator classifications. This technique was based on natural language processing technology and solved problems with subject-word segmentation, weight calculation, and dynamic matching. A prototype system for classification and label management was constructed based on existing CASEarth datasets of more than 1,100. Furthermore, we expect our study to provide the methodology and technical support for user-oriented classification and label management services for Big Earth Data.
1. Introduction
Big Earth Data involve large datasets in the field of Earth science that contain spatial attribute data. These data sources include high volumes of remote sensing data for land, ocean, atmosphere, and human activities (Guo, Citation2017a). Big Earth Data have massive, multi-source, multi-temporal, heterogeneous, multi-scale, and non-stationary characteristics; they also exhibit strong temporal, spatial, and physical correlations. Big Earth Data have imparted important scientific and socioeconomic value to various fields, such as environmental protection, resource utilization, and disaster risk reduction (Guo, Citation2017b). They are vital data resources for supporting the United Nations (UN) Sustainable Development Goals (SDGs) (Guo, Hackmann, & Gong, Citation2021). Thus, establishing a classification system for big data management and services is an urgent necessity.
CASEarthFootnote1, the Big Earth Science Engineering Program of the Chinese Academy of Sciences, was officially approved in January 2018, with a five-year implementation period. The priority research program is committed to building a big data and cloud service sharing platform as well as a global-leading digital Earth science platform. In this platform, the spatiotemporal data reach up to the petabyte (PB) scale and include ground observation and scientific research data, remote sensing data products, models and assimilation data (Wu, Che, Li, & Zhu, Citation2021). And data on the platform will allow the dataset to be further utilized in other research and integrated with multiple datasets, data analysis, and mining services (Liang, Guo, Zhang, Li, & Wang, Citation2021). This will promote technological innovation in the field of big data and scientific discoveries in earth system science (Guo, Citation2019). In addition, it will realize public knowledge dissemination services and provide all-round macro-scale decision support for many initiatives, such as “the Belt and Road” (Guo, Citation2018), “Beautiful China” (Fang, Wang, & Liu, Citation2019), Community of Human Destiny, and the UN’s SDGs. These complex and diverse data resources come from various fields, such as remote sensing, geography, ecology, atmosphere, oceanography, and specific geographical areas, including the Qinghai-Tibet Plateau and polar regions. Various institutions and research groups have produced these data resources using a unified exchange platform. However, it is difficult to organize and manage data under a unified classification framework and present them in a user-friendly, retrievable, and accessible manner.
The classification management of Earth science data is a long-term challenge. Among international databases, the US National Aeronautics and Space Administration (NASA) has established a catalogue of Earth observation resources (Nagendra et al., Citation2001). Its classification takes the structure of the geosphere and discipline as the main dimensions, including the atmosphere, heat, land, life, water, ice and snow, human processes, remote sensing, and biology. The United States Geological Survey (USGS) has established a catalogue of geoscience data that includes atmosphere and climate, geological processes, Earth characteristics, natural disasters, geosciences, natural resources, environmental problems, ocean and coastal zones. The World Food and Agriculture Organization (FAO) has established a sharing network, GeoNetwork, primarily for geospatial data sharing. Its data classification system includes administrative boundaries, agriculture and livestock, applied ecology, basic maps, biological and ecological resources, climate, fisheries and aquatic products, forests, human health, atmosphere and water resources, infrastructure, land use and change, population, socioeconomic indicators, soil, and topography.
In terms of the national databases in China, the National Earth System Science Data Center (http://www.geodata.cn/) has paid equal attention to Earth science disciplines and regions. It has established a data classification system that covers the atmosphere, terrestrial surface, terrestrial hydrosphere, cryosphere, natural resources, oceans, polar regions, solid Earth, paleoenvironment, solar-terrestrial space environment, astronomy, and remote sensing data, as well as typical regions such as the Yellow River Delta, Yangtze River Delta, and Loess Plateau (Wang et al., Citation2014). Liao and Jiang (Citation2005) indicated that the classification of Earth science data should follow six principles: scientific, systematic, integrity, hierarchy, scalability, practicability, and compatibility. The National Tibetan Plateau Data CenterFootnote2 established a classification system based on discipline, theme, and regional attributes. The data catalogue of the National Cryosphere Desert Data CenterFootnote3 in Western China includes glaciers, frozen soil, snow, desertification, polar, hydrology, ecology, soil and water conservation, meteorology, basic geography, remote sensing and products, landslides, atmospheric background, and debris flow. The data catalogue of the National Polar Data CenterFootnote4 includes marine physics, marine chemistry, polar glaciers, polar sea ice, polar atmosphere, geophysics, polar geology, space physics, polar biology, polar environment, Antarctic astronomy, and geodesy. The data catalogue of the National Space Science Data CenterFootnote5 consists mainly of subject words which are divided into primary and secondary categories. The primary categories include space physics and environment, astronomy, moon and planetary science, space geoscience, and interdisciplinary research among others.
Boulila et al. (Citation2018) proposed a decision support system parsing tool based on the complex and multi-source characteristics of remote sensing big data which classified and analyzed complex remote sensing data to help users make decisions. Mezni et al. (Citation2022) proposed the SmartWater framework, which combines sensor cloud, deep learning, knowledge reasoning, and data processing and analysis technologies for each water area. Wybrands et al. (Citation2021) proposed a prototype implementation of a water management information system for precipitation data management, groundwater data management, and long-term water demand forecasting. Most of these databases focus on specific aspects of Earth and do not consider the geosphere as a whole. Moreover, the classification of these data centers was relatively static. Different users with varying backgrounds and requirements use the same portal catalogue, lacking label and recommendation technology support.
Some databases are closely linked to the SDGs (Wang et al., Citation2019). The SDG databases are available on the UN website, such as the SDG Acceleration Action DatabaseFootnote6 and the SDG Good Practices DatabaseFootnote7. Furthermore, the FAOFootnote8, which supports agriculture or SDG food security indicators, has five primary categories: general, agriculture, forestry, fishery, and aquaculture natural resources. Most of these databases focus on statistical data and lack spatial-distribution data. More spatial data are needed for SDG evaluation, whether in targets or indicators related to water, atmosphere, biodiversity, land or ocean, and multi-scale targets or indicators for fields such as agriculture, urbanization, industry, education, disaster reduction, and social development. Nilsson et al. (Citation2018) used the SDG interaction framework to develop a knowledge platform that systematized and aggregated various information, applying it to scientific research, policy formation, and the interaction between global sustainable development goals. Group on Earth Observation (GEO) develops a SoS knowledge base to evolve the Global Earth Observation System of Systems (GEOSS) software ecosystem into a GEOSS social ecosystem to support the implementation of SDGs and global decision-making, within and across different domains (Nativi et al. Citation2019). Similarly, CASEarth’s Big Earth Data supports SDGs as well as spatial characteristics, such as Earth observation remote sensing data or land surface data products. Their mission includes water distribution, farmland and forest mapping, urbanization data reflecting night light signals, land degradation, vegetation, and habitat change.
However, designing a reasonable classification system for Big Earth Data and making it user-friendly and accessible is challenging. Mazzetti et al. (Citation2022) proposed the ERA-PLANET reference framework to solve the interoperability problem of data and models by designing a knowledge base supporting the semantic and practical interoperability of data and models. For a single subject, the data can be classified using only a few users. Although multi-disciplinary research teams have contributed to Big Earth Data sources, a greater number of active users makes it difficult to integrate all the data while retaining flexible retrieval by individual users. Top-down and bottom-up approaches are required for Big Earth Data management. The top-down method is a scientific and effective data-classification system; whereas the bottom-up method requires the automatic addition of flexible labels such that data can be easily found and understood by users. Data-tag management is required to quickly locate and retrieve relevant content from massive volumes of data.
Thus, the logical starting point of this research is to combine the stable classification system of Big Earth Data with dynamic semantic labeling technology. Subsequently, a classification that considers the subject and application service attributes is formed. Consequently, a data-label configuration mechanism was designed and developed to meet the individual needs of the users. This study is expected to provide a data management framework for long-term data preservation, integration, sharing, and other services for Big Earth Data.
2. Data and methods
2.1. Data sources
The CASEarth Data Sharing and Service PortalFootnote9 combines datasets from various research teams and projects obtained through instrument observation, remote sensing interpretation, model simulation, and statistical analysis. The data formats were mostly text, vector, and raster data, such as global 30 m surface coverage fine classification products and global ocean surface net radiation. Currently, 1,169 datasets have been acquired from the Aerospace Information Research Institute, Chinese Academy of Sciences, which also hosts the CASEarth program.
2.2. Methods
The technical workflow of this study is illustrated in . Through comprehensive analysis and referencing the classification of relevant data resources and the multidimensional label management system, we first classified the geosphere layer and SDG indicators on Big Earth Data. Second, we performed a label extraction on the dataset text of Big Earth Data using natural language processing. Based on web technology and geographic information technology, a data classification and distribution prototype was built for metadata storage, semantic recognition, data classification, and visualization of Big Earth Data.
Figure 1. Flowchart providing an overview of the research on data resource classification and the multidimensional label management system.
2.2.1. Classification steps
The overall data classification comprised two sets of classification systems. One set focuses on discipline and geosphere characteristics, based on discipline classification; the second set was oriented towards SDG support and established the SDG classification system.
(1) Discipline classification
There are three main steps in disciplinary classification: top-down, bottom-up, and human-computer interaction. Top-down refers to the establishment of circles as the primary core category. Taking a holistic view of the Earth system, a geosphere structure was designed and combined with object-oriented thinking for description, making it easier to establish connections with datasets. Bottom-up refers to the elementalization of secondary indicators. The element references multiple sources of vocabularies of field topics, including Global Change Master Directory (GCMDFootnote10), domain standards, and the keywords of datasets in the CASEarth program. Finally, human-computer interaction refers to combining the opinions of data producers, CASEarth data managers, and user comments to improve classification. Users include government policymakers, scientists, teachers, students, and the public.
(2) SDG classification
Big Earth Data would support the UN SDGs in terms of data, methods, and decision support and has the advantage of reflecting spatial attributes. Six UN SDGs are closely related to the spatial distribution of resources and environments. These are SDG2 (zero hunger), SDG6 (clean water and sanitation), SDG11 (sustainable cities and communities), SDG13 (climate action), SDG14 (life below water), and SDG15 (life on land). Therefore, these six goals and their related targets and indicators were selected to establish the SDG classification system for Big Earth Data.
2.2.2. Label extraction method
At present, there are three ways to extract tags from many texts: i) based on parts of speech and syntax, ii) based on a topic model, and iii) based on supervised learning. This experiment used an extraction method based on parts of speech and syntax and JiebaFootnote11 word segmentation and keyword extraction for label extraction.
(1) Text pre-processing
This experiment used the data description text of Big Earth Data for label extraction, which included the dataset number, dataset name, dataset type, introduction, subject classification, and keywords. First, phrase extraction is performed using phrase advance to automatically identify and extract noun phrases in the text. To flexibly and efficiently deal with the indexing task of incremental large-scale data, this system uses Jieba word segmentation. The phrases were tokenized and extracted from the specific textual content (titles, keywords, etc.) of the dataset. This method implements efficient word graph scanningbased on a prefix dictionary and generates a directed acyclic graph composed of all possible word formations of Chinese characters in a sentence. Dynamic programming was used to determine the maximum probability path according to the word frequency. For unregistered words, the HMM (Hidden Markov Model) model based on the ability of Chinese characters to form words and the Viterbi algorithm were used.
Owing to the lack of word boundaries in the text data, word segmentation and stop word filtering were performed before the keywords were extracted, and word segmentation was performed on the input text (. After word segmentation, the text was converted into a set of terms. The collection contains items unrelated to keywords, such as function words, meaningless word sequence fragments, or symbols. Irrelevant items were removed based on the stop word thesaurus of the Harbin Institute of TechnologyFootnote12. For some unrecognized or meaningless words, word frequency statistics were performed on the text after word segmentation, and high-frequency meaningless words were manually filtered and added to the stop word set to improve the accuracy and speed of keyword extraction. Text preprocessing obtains the candidate keyword set (
, and the content of text
is regarded as a set composed of feature items (words, phrases),
,
is the characteristic item,
.
(2) Weight calculations
Based on the importance of each feature item in text (
, and weighted
, the TextRank algorithm was used to calculate the weights. After word segmentation, each word was considered as a node, and weights were introduced to the edges between the nodes. The weight calculation formula is as follows:
where is the weight of the edge from node;
to
, d is the damping coefficient;
is the set pointed to the
node, and
is the set pointed to by the
node.
Undirected links between nodes were established with co-occurrence relationships, candidate keyword graphs were constructed, and the window length ( was set. An edge exists between two nodes only when their corresponding words co-occur in a window of length (
, and the weights of each node are initialized. The weight of word (i) depends on the weight of edge (j, i) formed by each point j before i and the sum of the weights from point j to the other edges. The weight of each node is calculated iteratively until convergence is achieved. The calculated node weights were arranged in reverse order, and the T words with the highest weights were obtained as labels.
2.2.3. Prototype system development
The technical realization of the classification and labelling prototype system includes four aspects: technical system selection, database technical scheme, user interface, and deployment. Overall, the prototype used an open-source technology system. The system was developed on Linux machines using Python (version 3.5) and the Tornado Framework. Web interaction is based on HTML5, JavaScript, and CSS3.
The advanced open-source PostgreSQL database was used for data storage based on the characteristics of the system data storage. The database version was PostgreSQL 9.5 or beyond. On this basis, we established tag data and metadata tables, harvested the metadata of the Big Earth Data and stored it in the library using the pycsw tool. The Neo4J graph database was used to store the knowledge relationships for complex knowledge networks and semantic relationships. We used mature Python tools to operate and call the database functions.
The app programming interface provided by the web service communicates with other applications. In view of the heterogeneity of system publishing resources, separate service interfaces were designed for different applications. Data were exchanged in the GeoJSON/XML format, providing functions such as metadata retrieval and association recommendations. The system development operating environment was Debian 10, Ubuntu 20.04, or other compatible GNU/Linux distributions.
3. Results
3.1. Classification system for Big Earth Data disciplines and SDGs
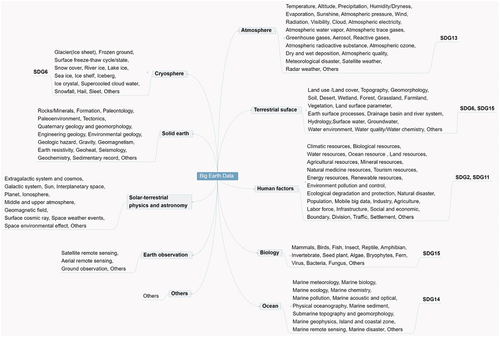
The discipline classification is based on the Earth system, supplemented by domains with high data needs, including atmosphere, terrestrial, human factors, biology, ocean, cryosphere, solid Earth, solar-terrestrial physics and astronomy, and Earth observing systems. There were 10 domains comprising the main dimensional content. Secondary categories were the key elements in each domain, with 148 secondary categories ().
Table 1. Classification system for Big Earth Data disciplines.
Table 2. SDG classification used by the study.
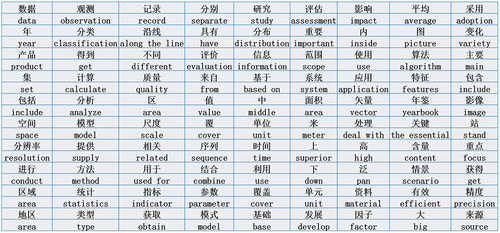
3.2. Comparison of word segmentation results
Word segmentation is the process of recombining consecutive word sequences into semantically independent word sequences, according to certain specifications. To extract the label from over 1,100 pieces of the Big Earth Data Science and Engineering dataset, the first step was to segment the dataset using the Jieba word segmentation tool.
Jieba word segmentation is based on a prefix dictionary to achieve efficient word graph scanning and generate a directed acyclic graph (DAG) composed of all possible word formations of Chinese characters in a sentence. Dynamic programming was used to find the maximum probability path and maximum segmentation combination based on word frequencies. For unregistered words, the HMM model is based on the ability of Chinese characters to form words, and the Viterbi algorithm is used. There are 349,046 words in the prefix dictionary used in this participle, including most of the words used daily, and words that are not in the prefix dictionary can also be calculated.
For part of the dataset text (), Jieba word segmentation and the Chinese Academy of Sciences Word Segmentation System (NLPIR) were used for word segmentation comparisons. The precision rate, recall rate, and F-measure value were used to evaluate the precision of the two-word segmentation method. Finally, a word segmentation tool with a higher precision was selected to perform the overall word segmentation processing of the text. The formula used for calculation was as follows:
TP represents the number of positive examples in the predicted accurate samples; FP represents the number of samples predicted to be positive but negative; FN represents the number of samples predicted to be negative but positive.
Through the calculation of the precision rate, recall rate, and F-measure value, as shown in , the Jieba word segmentation had a better effect on word segmentation of Big Earth Data text. Its accuracy was much higher than that of NLPIR with the loss of text content relatively low.
Table 3. Comparison of word segmentation results.
After word segmentation, the text was converted into a set of terms. The collection contained items unrelated to keywords, such as function words, meaningless word sequence fragments, or symbols. The stop words and meaningless words were eliminated according to the stop word thesaurus of the Harbin Institute of Technology and the artificially screened meaningless words (), which improved the accuracy and speed of keyword extraction.
Figure 2. Manual screening of high-frequency meaningless words.
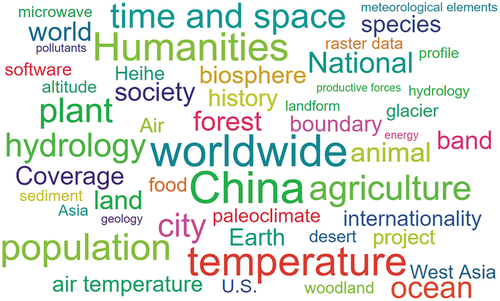
The weights of the word sets were calculated after word segmentation and the elimination of meaningless words. The TextRank calculation method was used to extract keywords for each piece of data, and the keywords and weights of the words in the entire text were displayed. Among them, China = 1, global = 0.747863, Qinghai-Tibet Plateau = 0.608185, resources = 0.429319, environment = 0.404956, country = 0.387999, soil = 0.384693, and atmosphere = 0.378582. A high-frequency keyword cloud was formed according to the frequency of the keywords, as shown in . The main data of CASEarth display distinct multiscale and interdisciplinary characteristics. Global scale data were the most common, followed by national- and regional-scale data. Regionally, the Qinghai-Tibet Plateau, the third polar region, Asia, Central Asia, the Qilian Mountains, and other regions are highlighted. In terms of thematic characteristics, data in the thematic fields of resources, environment, vegetation, soil, temperature, precipitation, climate, economy, lakes, ecology, land, geography, and disasters were relatively concentrated with a very high degree of aggregation.
Figure 3. High-frequency keywords for all data.
3.3. Implementation of a prototype system
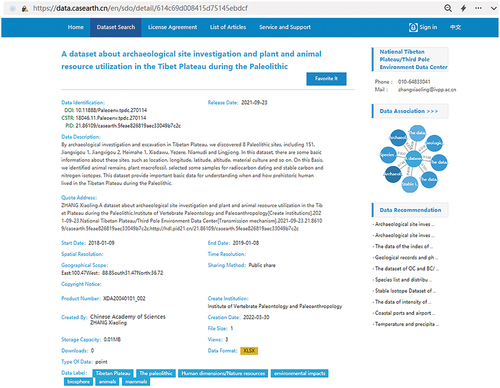
Based on web and geographic information technology, a service system for metadata storage and semantic recognition of Big Earth Data was established. The discipline and SDG classification interfaces displayed by the prototype system are shown in , respectively (https://data.casearth.cn/en/). The dataset’s metadata can be accessed by clicking on the corresponding secondary category indicator and the assigned tags in can be presented simultaneously.
Figure 4. The discipline classification interface.
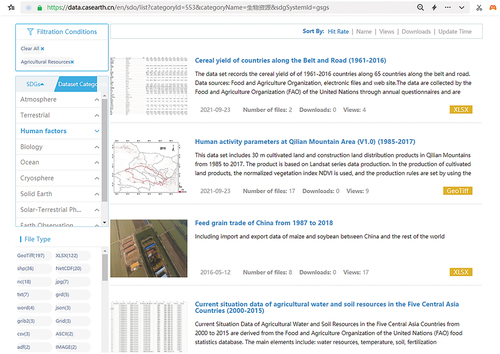
Figure 5. Sustainable Development Goals (SDG) classification interface.
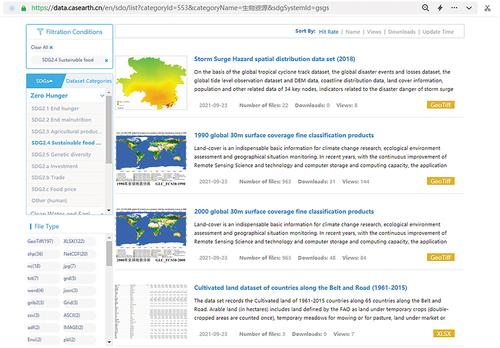
Figure 6. Data label display interface.
The prototype system can provide various data discovery modes for special data characteristics such as item classification, keyword retrieval, tag cloud filtering, and data association recommendations. The system also provides various data acquisition modes, including online downloads and API interface access. It supports online viewing, previews, and queries of customizable multiformat data, as well as statistics, collection, recommendation, download, and evaluation services for personalized needs.
4. Discussion
4.1. Discipline classification and SDGs classification
Big Earth Data is a comprehensive and frontier crossover field that spans many fields and disciplines. The current lack of common data classification standards directly affects the exchange of scientific data among these domains. A data classification system is crucial for the organization and presentation of a data center’s content. A scientific, reasonable, and stable data classification and coding system is fundamental. Data classification has long followed traditional methods of faceted and line classification, which require strict hierarchical and phylum relationships in the classification system. However, this approach is based on a clear logical framework, which makes it difficult to classify data from data-centered and interdisciplinary fields.
The disciplinary and SDG-based classifications proposed in this study are feasible solutions to the classification problem in the management of Big Earth Data. First, it is an object-oriented classification model that considers the Earth system’s spheres and life forms as objects and uses these objects as the basic categories for classification, which is different from the traditional discipline classification. Object-oriented classification mainly refers to datasets, and the model links the classification to datasets. Second, secondary categories are directly associated with data elements, enabling the direct location of relevant data resources; thus, avoiding excessive layers, which slow down this process. Third, this classification considers the mapping between discipline sphere classification and the classification system of SDGs supported by Big Earth Data. For example, in discipline classification, data associated with secondary indicators (“Agriculture,” “Labor force,” etc.) under the primary category “Human factors” belong to SDG2 “Zero Hunger,” so the Big Earth Data discipline classification was cross-referenced with the indicators in the SDG classification system. The SDG classification system is combined with the Big Earth Data discipline classification for users’ reference. When establishing the SDGs classification system, the secondary indicators under each primary category are labelled with “Others” which is also a primary category corresponding to the discipline classification to help users locate specific mapping relationships, as shown in .
Figure 7. Mapping Big Earth Data discipline classifications to SDG classification.
4.2. Word segmentation result comparison
“Word segmentation” is the first step in Chinese text processing, in which a continuous text is divided into a set of words. Early word segmentation was mainly based on string-matching methods. With the rise and development of machine-learning methods, many statistical word-segmentation methods have emerged.
In this experiment, the Chinese Academy of Sciences Word Segmentation System and Jieba word segmentation were used for a comparative analysis. coreDict, biGramDict, nr. coreDict is the main dictionary used by the Chinese Word Segmentation system of Chinese Academy of Sciences, which records 6,768-word blocks corresponding to word frequencies and handles for part-of-speech tagging; biGramDict records the relationship between words, i.e. the frequency of two adjacent words appearing together, and nr records the Chinese name and role annotation, which is the result of training on the people’s daily corpus. Word segmentation systems can recognize words and names.
From the above experimental results, the effect of Jieba is better than that of the Chinese Academy of Sciences Word Segmentation System when performing word segmentation on Earth science text. However, the accuracy of the current results is not very high and cannot adequately cover all Earth science majors. To improve the accuracy of word segmentation, relevant terms in Earth science knowledge should be imported in the future to increase the accuracy rate. The users of Big Earth Data mainly include government decision makers, scientists, educators, and the public. Returning labels to each dataset enables users to judge whether the content of the data meets their needs quickly, and the tag management’s goal should be to harmonize the vocabulary. This is a necessary first step in achieving FAIR (Findable, Accessibility, Interoperability, and Reusability) (Wilkinson et al., Citation2016).
4.3. Big Earth Data knowledge graph
This study established relationships between datasets using a classification and labeling system. However, this is insufficient for mining dataset knowledge and association recommendations. A knowledge graph is a branch of artificial intelligence and an important method for knowledge representation and mining in the era of big data. The concept of a knowledge graph originated from the semantic network proposed in the late 1950s to the early 1960s. It has experienced the evolution of expert systems, ontology, semantic webs (Berners-Lee, Hendler, & Lassila, Citation2001), and linked data (Bizer, Heath, & Berners-Lee, Citation2009). The idea of a knowledge graph first appeared when Tim Berners-Lee conceived a giant global graph (GGG) (Tim, Citation2007), which aimed to connect all data on the web and allow the discovery of new relations between openly accessible data. A widely-accepted definition states that a knowledge graph is a structured semantic knowledge base used to describe concepts and their relationships in the physical world in a symbolic form. Its basic unit is the triple of “Entity-Relation-Entity” and “Entity-Attribute-Attribute Value”. Entities are interconnected through relationships and form a network knowledge structure (Liu, Han, & Sun, Citation2020). OpenKG points out that knowledge graphs organically organize fragmented data by establishing association links between data, making it easier for people and machines to understand and process, facilitating search, mining, and analysis, and providing a knowledge base for the realization of artificial intelligence. In this application system, due to the limited metadata and low correlation when using the knowledge graph method to establish relationships between entities, this method could not be used. With the development of big data, there will be an increasing number of datasets and related information in the future and semantic knowledge will become increasingly abundant. In recent years, the bidirectional encoder representation from transformers (BERT) model has been favored by scholars, a pre-training model, proposed by the Google AI Research Institute in October 2018. BERT performs well in many Natural Language Processing tasks (Devlin et al., Citation2018) such as text classification, generative summarization, question answering, and reading comprehension. In the future, relationship mining, knowledge reasoning, user accuracy recommendations, and knowledge services based on knowledge graphs will be important directions for further research and application of Big Earth Data, and Bert model will be adopted as a powerful mining method. The application of knowledge graph technology will enrich the scientific connotations of the Earth system.
5. Conclusions
Multi-source and heterogeneous Big Earth Data are difficult to classify, integrate, personalize, display, and serve. This study completed the design of a Big Earth Data classification system based on object-oriented concepts. In the discipline classification system, the first class is dominated by the Earth system, including 10 main dimensions: atmosphere, land surface, human factors, biology, cryosphere, ocean, solid Earth, solar-terrestrial space physics and astronomy, Earth observation, and others. A secondary classification system was designed according to the 17 objectives of the SDGs, focusing on the main data in the CASEarth program. The first batch of over 1,100 converged data catalogues of CASEarth was preprocessed, such as word segmentation and stop word filtering, and the TextRank algorithm was used to sort the weights to generate semantic labels, build prototypes of data classification, label management, and implement data labeling.
In the future, this classification prototype could be associated with a data archiving system and data service system. The data producer can fill in the recommended label of the data through the data-archiving system or confirm manual data science judgment through the label automatically generated by the system. After the data users log in, the system automatically suggests data tags relevant to their interests, based on their user profiles. Therefore, different users can have different personalized experiences when logging into the Big Earth Data platform.
Disclosure statement
No potential conflict of interest was reported by the author(s).
Data availability statement
Data sharing is not applicable to this article as no new data were created or analyzed in this study.
Additional information
Funding
Notes on contributors

Juanle Wang
Juanle Wang received the B.Sc. degree in surveying engineering in 1998 and M.S. degree in geodesy and survey engineering in 2002 from China University of Mining and Technology, Xuzhou, China, and the Ph.D. degree in Cartography and Geography Information System from the Institute of Geographic Sciences and Natural Resources Research, Chinese Academy of Sciences in 2005. Currently, he is a Professor with the Institute of Geographic Sciences and Natural Resources Research, Chinese Academy of Sciences in Beijing, China. He also serves the Execute Director of the Disaster Risk Reduction Knowledge Service in the International Knowledge Centre for Engineering Sciences and Technology under the Auspices of UNESCO. His research interests include environmental remote sensing, disaster risk reduction knowledge service, and the sharing of Big Earth Data. Prof. Wang is a member of World Data System Scientific Committee in International Science Council (ISC).

Dongmei Yan
Dongmei Yan received the M.S. degree in Computer Applications from Beijing University of Aeronautics and Astronautics in 1996 and Ph.D. degree in Earth System Science from Graduate School of Chinese Academy of Sciences in 2004. Currently, she is the deputy director general and professor of the International Research Center of Big Data for Sustainable Development Goals (CBAS) in Beijing, China. She also serves as the director of administration office of the Big Earth Data Science Engineering Program of CAS (CASEarth) and is responsible of the data sharing of this program. Her research interests include remote sensing processing, spatial data mining, and the sharing of Big Earth Data.
Notes
12. http://ltp.ai/.
References
- Berners-Lee, T. (2007). Giant Global Graph. Decentralized Information Group Breadcrumbs, 6–11. http://dig.csail.mit.edu/breadcrumbs/node/215
- Berners-Lee, T., Hendler, J., & Lassila, O. (2001). The semantic web: A new form of web content that is meaningful to computers will unleash a revolution of new possibilities. Scientific American, 284(5), 34–43. doi:10.1038/scientificamerican0501-34
- Bizer, C., Heath, T., & Berners-Lee, T. (2009). Linked data: The story so far. International Journal on Semantic Web and Information Systems, 5(3), 1–22. doi:10.4018/jswis.2009081901
- Boulila, W., Farah, I. R., & Hussain, A. (2018). A novel decision support system for the interpretation of remote sensing big data. Earth Science Informatics, 11(1), 31–45. doi:10.1007/S12145-017-0313-7
- Devlin, J., Chang, M. W., Lee, K., & Toutanova, K. (2018). Bert: Pre-training of Deep Bidirectional Transformers for Language Understanding. Comput.Sci. arXiv:1810.04805.
- Fang, C., Wang, Z. B., & Liu, H. M. (2019). Exploration on the theoretical basis and evaluation plan of Beautiful China construction. Acta Geographica Sinica, 74(4), 619–632. doi:10.11821/dlxb201904001
- Guo, H. (2017a). Big data drives the development of Earth science. Big Earth Data, 1(1–2), 1–3. doi:10.1080/20964471.2017.1405925
- Guo, H. (2017b). Big Earth data: A new frontier in Earth and information sciences. Big Earth Data, 1(1–2), 4–20. doi:10.1080/20964471.2017.1403062
- Guo, H. (2018). Steps to the digital Silk Road. Nature, 554, 25–27. doi:10.1038/d41586-018-01303-y
- Guo, H. (2019). Big Earth Data Science Engineering Data Sharing Blue Book. Beijing: Science Press.
- Guo, H., Hackmann, H., & Gong, K. (2021). Big data in support of the Sustainable Development Goals: A celebration of the establishment of the International Research Center of Big Data for Sustainable Development Goals (CBAS). Big Earth Data, 5(3), 259–262. doi:10.1080/20964471.2021.1962621
- Liang, D., Guo, H., Zhang, L., Li, H., & Wang, X. (2021). Sentinel-1 EW mode dataset for Antarctica from 2014–2020 produced by the CASEarth Cloud Service Platform. Big Earth Data, 1–16. doi:10.1080/20964471.2021.1976706
- Liao, S., & Jiang, L. (2005). Research on Earth System Science Data Classification System. Advances in Geographical Sciences, 24(6), 93–98. doi:10.11820/dlkxjz.2005.06.011
- Liu, Z. Y., Han, X., & Sun, M. S. (2020). Knowledge graph and Deep learning. Beijing: Tsinghua University Press.
- Mazzetti, P., Nativi, S., Santoro, M., Giuliani, G., Rodila, D., Folino, A., Lehmann, A. … Lehmann, A. (2022). Knowledge formalization for earth science informed decision-making: The Geoessential knowledge base. Environmental Science & Policy, 131, 93–104. doi:10.1016/j.envsci.2021.12.023
- Mezni, H., Driss, M., Boulila, W., Atitallah, S. B., Sellami, M., & Alharbi, N. (2022). Smartwater: A service-oriented and sensor cloud-based framework for smart monitoring of water environments. Remote Sensing, 14(4), 922.
- Nagendra, K. S., Bukhres, O., Sikkupparbathyam, S., Areal, M., Miled, Z. B., Olsen, L., Major, G. … Major, G. (2001). NASA Global Change Master Directory: An implementation of asynchronous management protocol in a heterogeneous distributed environment. Proceedings 3rd International Symposium on Distributed Objects and Applications (pp. 136–145). IEEE. doi:10.1109/DOA.2001.954079
- Nativi, S., Santoro, M., Giuliani, G., & Mazzetti, P. (2019). Towards a knowledge base to support global change policy goals. International Journal of Digital Earth 13(2):29 .
- Nilsson, M., Chisholm, E., Griggs, D., Howden-Chapman, P., McCollum, D., Messerli, P., Stafford-Smith, M. … Stafford-Smith, M. (2018). Mapping interactions between the sustainable development goals: Lessons learned and ways forward. Sustainability Science, 13(6), 1489–1503.
- Wang, J., Lin, H., Ran, Y., Zhou, Y., Song, J., & Du, J. (2014). Discussion on data classification of Earth system science for data sharing. Advances in Earth Science, 29(2), 265–274. doi:10.11867/j.issn.1001-8166.2014.02.0265
- Wang, J., Wei, H., Cheng, K., Ge, L., Ochir, A., Bian, L., Nasanbat, E. … Nasanbat, E. (2019). Spatio-temporal pattern of land degradation along the China-Mongolia railway (Mongolia). Sustainability, 11(9), 2705. doi:10.3390/su11092705
- Wilkinson, M. D., Dumontier, M., Aalbersberg, I. J. J., Appleton, G., Axton, M., Baak, A., Mons, B. … Mons, B. (2016). The FAIR Guiding Principles for scientific data management and stewardship. Scientific Data, 3(1), 1–9. doi:10.1038/sdata.2016.18
- Wu, A., Che, T., Li, X., & Zhu, X. (2021). A ship navigation information service system for the Arctic Northeast Passage using 3D GIS based on big Earth data. Big Earth Data, 1–27. doi:10.1080/20964471.2021.1981197
- Wybrands, M., Frohmann, F., Andree, M., & Gómez, J. M. (2021). WISdoM: An information system for water management//advances and New Trends in Environmental Informatics (pp. 131–146). Cham: Springer.