
 ?Mathematical formulae have been encoded as MathML and are displayed in this HTML version using MathJax in order to improve their display. Uncheck the box to turn MathJax off. This feature requires Javascript. Click on a formula to zoom.
ABSTRACT
The glaciers on the Tibetan Plateau (TP) constitute critical sources of water for the proglacial lakes and many rivers found downstream. To better understand the evolution of glaciers and the impact of this on proglacial lakes, seven glaciers corresponding to continenṅtal, subcontinental, and marine climate types that are influenced by westerlies and the Indian summer monsoon were selected for study. The evolution of the edges of these glaciers and their associated proglacial lakes were identified based on the visual interpretation of Landsat TM/ETM+/OLI images. A dataset covering the period 1976–2020 that included the glacier and proglacial lake edge vectors was then created. The relative errors in the areas of the individual glaciers were less than 3%, and for the proglacial lakes these errors were in the range 0%–7%. The dataset was used to effectively compare the changes in glaciers and proglacial lakes that have occurred over the past four decades. The most striking changes that were found were the retreat of glaciers and the formation of small proglacial lakes. This dataset could also be used as a proxy to support research on changes in mountain glaciers, particularly their response to climate change and water resources. This response is of great scientific significance and is important in many applications, including assessments of the ecological problems caused by melting glaciers. The dataset can be downloaded from http://doi.org/10.57760/sciencedb.j00076.00131.
1. Introduction
Glaciers are important indicators of climate change, and the melting of snow and glaciers could lead to a marked rise in global sea levels (Meier et al., Citation2007). Many Asian rivers originate on the Tibetan Plateau and in High Mountain Asia; these rivers provide communities and ecosystems with a reliable source of water, especially on the Tibetan Plateau. The Intergovernmental Panel on Climate Change (IPCC) released its Special Report on the Ocean and Cryosphere in a Changing Climate (SROCC) in September 2019. This report stated that, against the background of climate warming, the cryosphere in High Mountain Asia is shrinking, the melting of glaciers will continue, and alpine and polar regions face increasing disaster risks (IPCC, Citation2019). The research team quantitatively evaluated the importance and vulnerability of the world’s “water towers”. It was pointed out that these water towers are crucial to maintaining life on Earth and that the most important water towers are often the most vulnerable (Immerzeel et al., Citation2020). The glaciers in the Himalayas, on Nyainchentanglha and in the Tanggula Mountains, as well as those on the Changtang Plateau and in Central Tibet, have experienced accelerated mass loss and retreat since the beginning of the 21st century, which has led to various hazards and glacier collapses (Jia, Hou, & Wang, Citation2021; Ke, Ding, Li, & Qiu, Citation2017; Li & Lin, Citation2017; Lin et al., Citation2019; Maurer, Schaefer, Rupper, & Corley, Citation2019; Muhammad et al., Citation2021; Pandey, Ali, & Ray, Citation2021; Tian et al., Citation2017; Wu et al., Citation2016, Citation2018; Yagoub, Li, Siddig, Musa, & Anjum, Citation2018; Zhou, Lia, Lia, Zhao, & Ding, Citation2018). Some researchers have also suggested applications for big data in High Mountain Asia and produced a variety of datasets on lake ice and snow cover; these datasets provide a firm basis for related research in the region (Lu et al., Citation2020; Muhammad & Thapa, Citation2020; Muhammad et al., Citation2021; Qiu et al., Citation2017, Citation2019; Wang et al., Citation2021).
Glacier ablation can be measured in terms of glacier area, glacier length, and glacier mass. Of these measures, glacier area can be used to indicate the amount of glacier recession (Khromova, Nosenko, Kutuzov, Muraviev, & Chernova, Citation2014). Over the past half century, the amount of retreat of glaciers on the Tibetan Plateau has tended to increase from the northwest to the southeast, and a large number of glaciers are disappearing or splitting (Bo et al., Citation2022). The number of observations, in particular long-term observations, of glaciers is still insufficient and seriously restricts glacier research, especially the accurate physical modeling of glaciers (Bo et al., Citation2022).
Previous studies have generally been concerned with the large-scale monitoring of glaciers using remote sensing. The Randolph Glacier Inventory (RGI Consortium, Citation2017), the First Chinese Glacier Inventory and Second Chinese Glacier Inventory (CGI1 and CGI2) (Liu, Guo, & Xu, Citation2019), and the GLIMS Glacier Database (Raup et al., Citation2007) are the main reference data used in glacier research because of their large areal coverage; however, the accuracy of these data still needs to be improved (Bo et al., Citation2022). With the development of remote sensing, glacier datasets focusing on the Tibetan Plateau has been produced, such as the Karola glacier area change dataset (Tibet) (Laba, Qiu, & Chu, Citation2017), the western China glacier catalog (Ran, Wang, & Guo, Citation2021), the Longbasaba glacier change dataset (central Himalaya) (Zhang, Wei, Zhang, Wang, & Zheng, Citation2021), and the Gangdise glacier vector dataset (Liu et al., Citation2020). However, these datasets cover short time scales and generally reflect glacier change characteristics for a certain year. For example, the western China glacier catalog relates to the years 2017–2018 only and the Gangdise glacier vector dataset relates to 2016 only. It can be seen that although these glacier inventories cover considerable areas, the data on which they are based need to cover longer time periods. With the aim of improving on these glacier inventories, in this study, long time-series of data were used for selecting representative changes in glacier boundaries, thus providing glacier change data with a higher temporal resolution.
Over the years, we have focused on extracting glacier boundaries by visual interpretation. This work has played an important role in glacier monitoring in the Tibetan Plateau, but these data need to be shared with other researchers to realize their full value. In this study, we aimed to produce a glacier dataset that was updated over a longer period than previous datasets. Therefore, it was necessary to continuously monitor glaciers in different regions over long periods so that sufficient data could be collected.
2. Selection of glaciers
Based on the different climate conditions that affect glaciers, in this study, a distinction was made between glaciers located at the sources of rivers, glaciers with large fractures that are undergoing ablation, glaciers affected by human activities, and glaciers developed as tourist attractions. The seven representative glaciers that were selected are located in different geographical regions of the Tibetan Plateau and are affected by different climate conditions. The glaciers have an average altitude of more than 4,500 m ().
Figure 1. The locations of the seven typical glaciers on the Tibetan Plateau that were selected for this study.
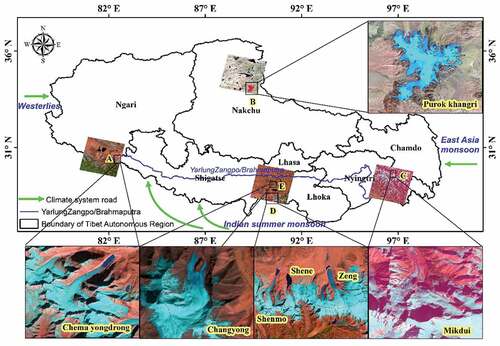
The Chema Yongdrong Glacier is the source of the Yarlung Zangbo River (Brahmaputra), which is affected by the Indian summer monsoon and is one of the most important water sources in the Tibetan Plateau, India, and the Southeast Asia region. Therefore, the changes in the Chema Yongdrong Glacier and the associated proglacial lake have an important impact on the activities of people downstream ().
The Purok Khangri Glacier is the third largest area of ice in the world (i.e. the largest outside of Antarctica and the Arctic) and is affected by the westerlies. The meltwater from this glacier flows into different lakes on the Changtang Plateau, which is an important water source for wild animals. The changes in the Purok Khangri Glacier are associated with changes in the climate and other natural systems as the glacier is rarely disturbed by outside influences: there is basically no human activity in the area. However, in recent years, extensive break-up and melting of the glacier has occurred. The Purok Khangri Glacier can be considered representative of continental glaciers, and the changes affecting it demonstrate the impact of changes in the climate and other natural systems on glaciers ().
The Mikdui Glacier is typical of the maritime glaciers in southeast Tibet and is a major tourist attraction. In recent years, the glacier has retreated significantly, increasing the area of the glacial lake downstream. The changes in this glacier reflect the changes affecting maritime glaciers in southeast Tibet ().
The Shenmo Glacier, Shene Glacier, and Zeng Glacier are located close to one another in the Himalaya Mountains on the border between China and Bhutan. Proglacial lakes can be found at the terminuses of these glaciers, which are affected by the Indian summer monsoon. However, the changes occurring in these three glaciers and their associated proglacial lakes are quite different, which means that it is important to track these changes in detail ().
The Changyong Glacier is a famous tourist attraction in Tibet. This glacier is located beside a highway near to the Yarlung Zangbo River in the Yamdrok Yutso basin and is relatively accessible. It is affected by the Indian summer monsoon as well as the local climate. Due to the glacier’s geographical location, in recent years, there has been a lot of tourist activity in the area and many scientific expeditions have been made to it. The changes in this glacier are, therefore, obvious, and the glacier was selected as being representative of glaciers that are affected by human activities ().
The selected glaciers were varied in terms of the characteristics of the glaciers themselves, their geographical locations, and the impact of external factors. A comparative analysis of the glaciers was made to explore the relationship between glacier retreat and regional climate change and to help understand cryospheric water resources and associated disasters.
3. Input data and methods
3.1. Landsat data
Since 1972, the Landsat series of Earth observation satellites have continuously acquired images of the Earth’s land surface, providing uninterrupted data that can help land managers and policymakers make informed decisions about natural resources and the environment (United States Geological Survey, USGS). Landsat data thus constitute an ideal resource for monitoring the features of the Earth’s surface, including glaciers. In this study, we selected seven glaciers of different types (continental, subcontinental, and marine) that were influenced by the westerlies and the Indian summer monsoon () from images that were free of cloud and snow; this meant that most of the imagery used had been acquired in autumn and winter (September to December). All of the original imagery had less than 10% cloud cover. In addition, most of the selected glaciers had no surface moraine. The use of these high-quality, clean images greatly increased the accuracy of the subsequent image interpretation. The data used consisted of Landsat 2 MSS, Landsat 5 TM/ETM+, Landsat 7 TM, and Landsat 8 OLI data from the period 1976–2020; further details are given in . The data used also had a high temporal resolution, with imagery being available at least every five years. Limited imagery from the 1970s was available for the Changyong and Mikdui glaciers; the earliest data covering these two glaciers dated from the 1980s. The glacier boundaries were determined using the Second Chinese Glacier Inventory (CGI2). All of the images were geometrically corrected using Landsat Benchmark data provided by the University of Maryland.
Table 1. Details of the remote sensing data used (data source: http://glovis.usgs.gov/). The relevant satellite sensors are Landsat-2 MSS, Landsat-5 TM, Landsat-7 ETM, and Landsat-8 OLI.
4. Methodology
Given the spectral characteristics of glaciers, two bands between which there is a strong difference in the amount of reflection are usually used to enhance the glacier-related information in remote sensing imagery. At present, the Normalized Difference Snow Index (NDSI) and the band ratio are the main indexes used to define appropriate threshold values for glacier extraction and have been widely used in studies in this field. However, subsequent correction of the corrected glacier boundaries is still needed. Manual visual interpretation is still one of the best methods for interpreting glacier information within a small area and can be used to determine glacier boundaries in remote sensing images based on the textural features of glaciers, to determine glacier areas, and to extract other related information. However, this method depends on the professional knowledge and experience of interpreters. In this study, manual delineation was used to produce the glacier dataset. The details of the method used are shown in .
Figure 2. Flowchart showing details of the method used to produce the glacier and proglacial lake dataset.
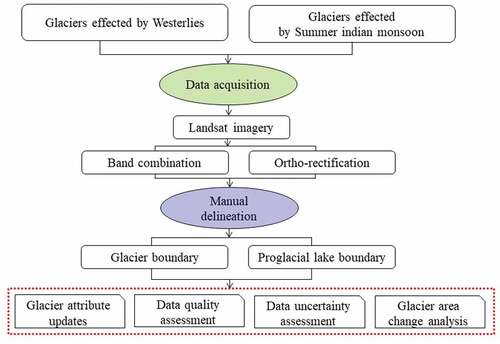
To better separate the glaciers from other land-cover types, different combinations of Landsat bands were used. The following combinations were used 4-3-2 (Landsat-2), 5-4-3 (Landsat-5), and 7-5-4 (Landsat-7 and Landsat-8). For band combinations 5-4-3 and 7-5-4, the glaciers appear as light blue areas, which makes it easier to define their boundaries.
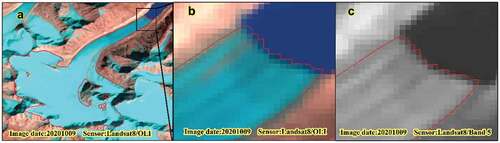
In addition, because of the strong absorption of water that occurs in the near-infrared band (band 5), this band can be used to improve the delineation of the boundaries separating glaciers from proglacial lakes. Therefore, when defining the glacier boundaries, we referenced both the Landsat near-infrared band and the Google Earth imagery to ensure that the boundaries between the glaciers and proglacial lakes had the highest possible accuracy: the error in the delineated boundaries was kept to less than one pixel. Most of the modifications to the glacier outlines were made near the glacier terminuses.
Taking the Chema Yongdrong Glacier as an example, the extent of the glacier can be seen in the 7-5-4 band combination (). An enlarged image of the glacier terminus is shown in part (b); part (c) is an enlarged version of the near-infrared image of the same area. It can be seen from these images that the extracted boundary of the glacier terminal is within the acceptable error range.
Figure 3. Images showing the boundary of the Chema Yongdrong Glacier terminus: (a) 7-5-4 band combination showing the glacier border, (b) enlarged vector image of the glacier terminus, and (c) enlarged near-infrared image of the glacier terminus.
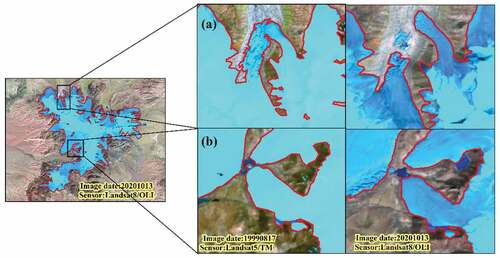
From , it can clearly be seen that the interpretation of the vector image of the Purok Khangri is quite consistent with the glacier boundary derived from the satellite imagery. The boundaries of the glacier in zones A and B in 1999 and 2020 are shown. The extent of the melting that occurred between these two years can be seen.
Figure 4. Enlarged view of the fragmented Purok Khangri Glacier: (a) northern and (b) western part (band combination: 7-5-4).
5. Mapping of glaciers and proglacial lakes
The dataset that was produced in this study was based on 66 Landsat images of glaciers and proglacial lakes that had been acquired during the period 1976–2020. This dataset consisted of 118 files in shape file format that had been evaluated for their accuracy, and one excel table which covered glacier area information; for all of the glaciers and proglacial lakes covered by the dataset, data had been acquired at least every five years. All data were saved using a Name_YearDate format: for example, Shene_Glacier_19761217 denoted the data for the Shene Glacier that had been acquired on 17 December 1976. The Excel table consisted of five sheets; the data for the Shene, Shenmo, and Zeng glaciers were entered on the same sheet.
The glacier attributes had 12 fields (), glacier type, glacier name, glacier area, longitude/latitude of glacier, main image of glacier, altitude, mountain range, administrative region, interpreter glacier area and glacier perimeter.
Table 2. Details of the glacier attributes in the dataset.
The final glacier dataset included details of the projection that was used and updates to the glacier attributes. The projection was the Asia North Albers Equal Area Conic projection, which has a central meridian of 105°, a standard parallel 1 of 25°, and a standard parallel 2 of 47°.
6. Data evaluation
6.1. Data quality evaluation
According to the method of Hanshaw (Hanshaw & Bookhagen, Citation2014; Ran, Wang, & Guo, Citation2021), the error in the glacier area derived from remote sensing data is closely related to the spatial resolution of the imagery used. The number of pixels in the glacier boundary depends on the length of the glacier perimeter and the spatial resolution of the imagery. Assuming that the size of the error in the area follows a Gaussian (normal) distribution, the error resulting from the interpretation of the imagery is given by
and the relative error, E, is given by
Here, P is the glacier perimeter (m), G is the spatial resolution of the remote sensing imagery with the highest resolution, and ð denotes the random error weight. Assuming that 69% of the pixels are subject to errors, the value of ð is 0.6872 (Hanshaw & Bookhagen, Citation2014; Ran, Wang, & Guo, Citation2021). A is the total area of the glacier.
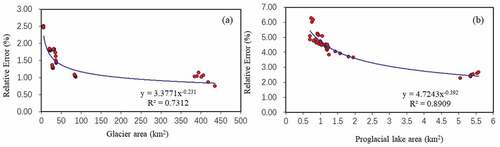
The results show that the relative errors in the areas of individual glaciers are less than 3% and the relative errors in the areas of the proglacial lakes are in the range 0%–7%. These relative errors have significant exponential relationships with the sizes of the glaciers (E = 3.3771A‒0.231, R2 = 0.69, P < 0.01) and the sizes of the proglacial lakes (E = 4.7243A‒0.392, R2 = 0.94, P < 0.01) ().
Figure 5. The size of the relative error in the areas of individual glaciers(a) and proglacial lakes(b).
6.2. Uncertainty evaluation
As the solar elevation angle varies with the season, mountain shadow, snow cover and the spatial resolution of the remote sensing imagery are the main factors affecting the accuracy of glacier interpretation. In this study, only the error due to the image resolution was considered, and the errors in the glacier area and glacier area change were evaluated. The glacier interpretation error results mainly from the calculation of the number of pixels through which the glacier boundary passes (Jia, Hou, & Wang, Citation2020; Ye et al., Citation2017). The interpretation error due to the image resolution can be calculated as
where N is the number of pixels through which the glacier boundary passes and λ L is the image resolution (60 m for Landsat MSS data, 30 m for TM and ETM + data, and 15 m for OLI data). The error in the glacier area for the imagery acquired on each date during the period 1976–2020 shown in was calculated in this way.
For data acquired on two different dates, the interpretation errors for both dates contribute to the glacier area change error:
Here, Uchange represents the glacier change error and U1 and U2 represent the glacier interpretation error for the data acquired on two different dates.
The calculations of the uncertainty in the glacier area due to the resolution of the remote sensing imagery made in this study showed that the size of the error in the boundary gradually decreases as the spatial resolution of the imagery increases (). The smallest uncertainties in the area are for the Purok Khangri and Changyong glaciers (around ±0.01 km2). The greatest uncertainties are for the area of the Chema Yongdrong Glacier (±0.11 km2) and that of its proglacial lake (±2.83 km2), based on data from the 1970s. It can be seen from these results that the glacier and proglacial lake boundaries in the dataset are quite accurate.
Table 3. Changes in glacier and proglacial lake areas (GA: glacier area, PLA: proglacial lake area; + means glacier/proglacial lake increase, – means glacier/proglacial lake decrease).
7. Data analysis
We grouped the glaciers in our dataset based on the different climate systems that affect them. The Purok Khangri Glacier is mainly affected by the westerlies, whereas the other glaciers are mainly affected by the Indian summer monsoon.The Purok Khangri Glacier is a continental glacier. The Mikdui Glacier is a marine glacier, and the remaining glaciers are subcontinental glaciers.
Both the glaciers affected by the westerlies and those affected by the Indian summer monsoon are retreating but have different characteristics. Generally, in earlier studies, the changes in glaciers affected by the westerlies were not obvious: the West Kunlun, Karakoram, and East Pamir glaciers have been investigated and been shown to be stable or even advancing slightly in area (Brun, Berthier, Wagnon, Kääb, & Treichler, Citation2017; Gardner et al., Citation2013; Kääb, Treichler, Nuth, & Berthier, Citation2015). In the present study, the area of the Purok Khangri glacier was found to have decreased by 11.66% during the 1976–2020 – this is in sharp contrast to the situation for the other glaciers affected by the westerlies. The results also demonstrate that the amount of glacier retreat declines from west to east as the influence of the westerlies becomes weaker. Therefore, the Purok Khangri Glacier can be considered as a representative of retreating subcontinental glaciers in the northern part of the Tibetan Plateau.
Among the glaciers affected by the Indian summer monsoon, over the past 40 years, the rate of change in glacier area in the western Himalayas (for example, in the Chema Yongdrong Glacier) has been greater than that in the central Himalayas (for example, in the Shene, Shenmo, and Zeng glaciers). The rate of change in the area of glaciers that have associated proglacial lakes (such as the Shene and Shenmo glaciers) has been greater than that of glaciers without associated proglacial lakes (such as the Zeng Glacier). These glaciers can be considered representative of retreating subcontinental glaciers on the plateau.
The Changyong Glacier and Mikdui Glacier, which are also affected by the Indian summer monsoon, have also retreated over the past 30 years. These glaciers can be considered representative of subcontinental glaciers and marine glaciers, respectively, on the Tibetan plateau.
7.1. Change in area of glaciers affected by the westerlies
7.1.1. Purok Khangri Glacier
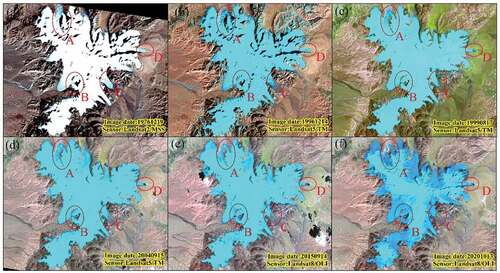
Located in the north of the Tibetan Plateau, the Purok Khangri Glacier is an ideal example for investigating the response of glaciers to climate change. The average area of the Purok Khangri Glacier during the period 1976–2020 was 404.92 ± 0.004 km2. This area decreased from 435.5 ± 0.01 km2 in 1976 to 384.74 ± 0.004 km2 in 2020, which is equivalent to a decrease of 11.66%. It can also be seen that the glacier terminus retreated during this period (). The areas of significant glacier retreat are marked as zones A–D in the figure. As can be seen from , a large part of the glacier in zone A has almost melted; in zone B, what was originally a complete glacier block broke up to form a small lake after 2015. It can also be seen from a comparison with the 1976 satellite image that significant melting had occurred near the glacier terminus (zone C) by 2020; there is a risk of a break occurring in this area in the foreseeable future as well. In zone D, a small ice lake gradually formed at the glacier terminus over the period from 1999 to 2020.
Figure 6. Maps showing details of changes in the Purok Khangri Glacier (Areas where notable changes have occurred are circled.) the band combination for (a) is 4-3-2. (The glacier appears white in this image because no Landsat MSS band 5 in 1976 image). The band combination for (b), (c), and (d) is 5-4-3; and the band combination for (e) and (f) is 7-5-4.
7.2. Change in area of glaciers affected by the Indian summer monsoon
7.2.1. Chema Yongdrung Glacier
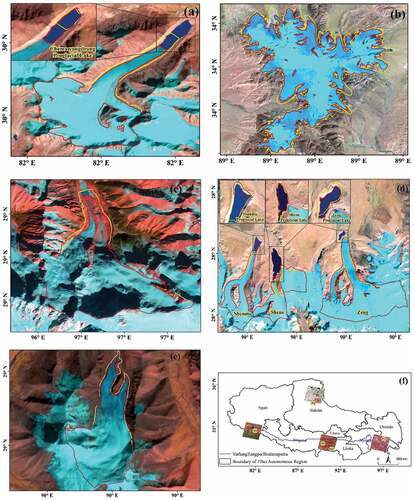
As shown in , between 1976 and 2020, the area of the Chema Yongdrung Glacier decreased by 1.96 km2 from 22.98 km2 to 21.02 km2. The average area of the glacier during this 44-year period was 21.73 ± 0.03 km2, and the glacier had a negative area anomaly after 2006. In more detail, the glacier area decreased by 0.43 km2, 0.59 km2, and 0.65 km2 during the periods 1976–1990, 2000–2010, and 2010–2020, respectively, corresponding to rates of change of 3.04%, 2.65%, and 2.90%. The spatial variations in the Chema Yongdrung Glacier show that the glacier terminus retreated and the width of the glacier decreased over the 44-year period 1976–2020. The average area of the Chema Yongdrung glacier’s proglacial lake during the period 1976–2020 was 1.05 ± 0.46 km2, and the area of the lake tended to increase during this time. The area increased from 0.7 ± 2.83 km2 in 1976 to 1.21 ± 0.10 km2 in 2020, an increase of 0.51 km2. These changes show clear evidence of the retreat of the terminus of the Chema Yongdrung Glacier and the expansion of its proglacial lake.
Figure 7. Maps showing changes in the boundaries of seven typical glaciers: (a) Chema Yongdrong Glacier and proglacial lake, (b) Purok Khangri Glacier, (c) Mikdui Glacier, (d) Shene, Shenmo and Zeng glaciers and their proglacial lakes, and (e) Changyong Glacier, the yellow lines mark the 1976 boundaries and the red lines the 2020 boundaries; in parts (c) and (e), the yellow lines mark the 1989 boundaries and the red lines for the 2020 boundaries. (f) shows the distribution of these glaciers.
7.2.2. Mikdui Glacier
Located in the Nyainchen Tanglha Mountains, the Mikdui Glacier is one of eastern Tibet’s typical marine glaciers (). The average area of the glacier over the period 1989–2020 was 29.39 ± 0.02 km2, and there was a decrease of 1.42 km2 from 29.93 ± 0.07 km2 to 28.51 ± 0.01 km2 over this period, equivalent to a change of −4.74%. In recent years, the area of the glacier covered by surface moraine has expanded and the area of the proglacial lake has increased.
7.2.3. Shene, Shenmo and Zeng Glaciers
Three further glaciers selected for study (the Shene, Shenmo and Zeng Glaciers) are located in the Himalaya Mountains. There are lakes in front of these glaciers: the Shene and Shenmo glacier lakes are glacier contact lakes, whereas the proglacial lake of Zeng glacier is not in contact with the glacier terminal ().
Although these three glaciers are located in the same mountain range and lie close to each other, it was found that the Shene and Shenmo glaciers are shrinking and their proglacial lakes expanding, whereas the Zeng Glacier appears to be stable and did not expand over the study period. The average areas of the Shenmo, Shene, and Zeng glaciers were determined to be 32.01 ± 0.03 km2, 37.53 ± 0.02 km2, and 85.33 ± 0.01 km2, respectively. Over the period 1976–2000, the areas of these glaciers decreased by 6.57%, 7.70%and 3.36%, respectively.
The average areas of the Shenmo Glacier and Shene Glacier proglacial lakes were 1.39 ± 0.67 km2 and 5.38 ± 0.22 km2, respectively; these lakes were found to have expanded by 226.67% and 10.08%, respectively. In contrast, the Zeng Glacier’s proglacial lake shrank by 24.04% from 1.04 ± 1.72 km2 in 1976 to 0.79 ± 0.61 km2 in 2020.
7.2.4. Changyong Glacier
The Changyong Glacier is located in the Tibet’s Nangkartse County and is a famous tourist attraction.The average area of the Changyong Glacier during the period 1989–2020 was 6.38 ± 0.09 km2. The area of the glacier decreased by 4.31% from 6.5 ± 0.13 km2 in 1989 to 6.22 ± 0.003 km2 in 2020. The glacier melt was concentrated at the glacier terminus ().
The glaciers selected for detailed study were tending to retreat, and the retreat of glaciers connected to lakes was significant. In addition to the break-up of the Purok Khangri Glacier and the formation of a new proglacial lake, there is a risk of rapid melt and collapses in the near future against the background of climate change.
8. Conclusion
This work involved the production of a dataset that covered seven representative glaciers on the Tibetan Plateau and their associated proglacial lakes. The dataset had a high spatial and temporal resolution and included data from most years during 1976–2020. From the dataset, the change in the area of the selected glaciers over this 40-year period could easily be found. These changes in area help with understanding the changes in glaciers and proglacial lakes that are occurring due to the effects of the westerlies and the Indian summer monsoon as well as the global climate. In addition, the retreat of glacier terminuses can be seen from the dataset. The information that can be gained from these data can be used as the basis for research into glacier changes, in the evaluation and rational utilization of glacier water resources, and in disaster prevention and reduction. It can also contribute to the improvement of climate prediction models and to further glacier and climate change research. Finally, these data can help to increase awareness of the importance of glacier protection.
The artificial visual interpretation method used in this study is one of the most accurate methods available for extracting the boundary vectors of glaciers and proglacial lakes. However, the extraction is easily affected by the interpreter’s experience and subjective judgment. Generally, the most difficult areas to interpret are mixed pixels, shadows, and snow-covered areas. Therefore, in order to obtain highly accurate interpretation results, in this study, images affected by clouds, snow, and shadows were not selected; the selected images were also free of snow cover, at least in the glacier areas. In winter, as the solar altitude angle decreases, many glaciers are affected by shadow. In order to avoid the difficulties that this causes to the image interpretation, as far as possible, we selected imagery acquired in September or October. The results show that the relative errors in the areas of individual glaciers were less than 3% and the relative errors in the areas of the proglacial lakes were in the range of 0%–7%.
In this study, the boundaries and areas of glaciers and proglacial lakes were extracted from remote sensing imagery and the changes that occurred over different periods were analyzed. It was found that, after 2000, there was a significant increase in the rate of change in the areas of the glaciers and proglacial lakes in the study area. This was associated with significant glacier retreats and an expansion of the proglacial lakes. It was also found that this retreat was concentrated at the glacier terminuses and that the proglacial lakes in front of the glaciers were clearly expanding. Among the glaciers studied, the Purok Khangri Glacier, which is located within a nature reserve on the Tibetan Plateau, exhibited the greatest losses. Fractures could be observed in some corners of this glacier, and lakes could be seen were some glaciers have retreated. In some corners of the glaciers that were studied, the rate of ablation is accelerating and the ice is tending to break up or disappear. The Zeng Glacier, which is located in the Himalayas, is relatively stable, and there is no obvious expansion of the proglacial lake that lies in front of the glacier. It may be that this proglacial lake is not connected with the front of the glacier and that this inhibits further melting of the glacier, or the lack of any expansion may be due to the geomorphic and environmental characteristics of the glacier itself. This should be investigated in the future.
Open scholarship
 This article has earned the Center for Open Science badge for Open Data. The data are openly accessible at http://doi.org/10.57760/sciencedb.j00076.00131.
Disclosure statement
No potential conflict of interest was reported by the author(s).
Data availability statement
The data that support the findings of this study are openly available in http://doi.org/10.57760/sciencedb.j00076.00131.
Additional information
Funding
References
- Bo, S., Cx, A., Dc, B., Yi, H. A., Yc, C., Hz, A., & Yao, T. (2022). Glacier change in China over past decades: Spatiotemporal patterns and influencing factors. Earth-Science Reviews, 226, 103926. doi:10.1016/j.earscirev.2022.103926
- Brun, F., Berthier, E., Wagnon, P., Kääb, A., & Treichler, D. A. (2017). Spatially resolved estimate of High Mountain Asia glacier mass balances from 2000 to2016. Nature Geoscience, 10(9), 668–673. doi:10.1038/ngeo2999
- Gardner, A. S., Moholdt, G., Cogley, J. G., Wouters, B., Arendt, A. A., Wahr, J., & Paul, F. (2013). A reconciled estimate of glacier contributions to sea level rise: 2003 to 2009. Science, 340(6134), 852–857. doi:10.1126/science.1234532
- Hanshaw, M. N., & Bookhagen, B. (2014). Glacial areas, lake areas, and snow lines from 1975 to 2012: Status of the Cordillera Vilcanota, including the Quelccaya Ice Cap, northern central Andes, Peru. The Cryosphere, 8(2), 359–376. doi:10.5194/tc-8-359-2014
- Immerzeel, W. W., Lutz, A. F., Andrade, M., Bahl, A., Baillie, J., Bolch, T., & Baillie, J. E. M. (2020). Importance and vulnerability of the world’s water towers. Nature, 577(7790), 7790. doi:10.1038/s41586-019-1822-y
- IPCC. 2019. Summary for Policymakers. In: IPCC [Pörtner, H.-O., Roberts, D. C., Masson Delmotte, V., Zhai, P., Tignor, M., Poloczanska, E., Mintenbeck, K., Alegría, A., . , Okem, A., Petzold, J., Rama, B., N. M. Weyer (eds.)]. Cambridge University Press, pp. 3–35. https://doi.org/10.1017/9781009157964.001.
- Jia, B., Hou, S., & Wang, Y. T. (2020). Variation of glaciers at Zangser Kangri on the Qiangtang Plateau during 1971-2015. Journal of Glaciology and Geocryology, 42(2), 307–317.
- Jia, B., Hou, S., & Wang, Y. (2021). A surging glacier recognized by remote sensing on the Zangser kangri ice field, central Tibetan plateau. Remote Sensing, 13(6), 1220. doi:10.3390/rs13061220
- Kääb, A., Treichler, D., Nuth, C., & Berthier, E. (2015). Brief communication: Contending estimates of 2003–2008 glacier mass balance over the Pamir–Karakoram–Himalaya. Cryosphere, 9(2), 557–564. doi:10.5194/tc-9-557-2015
- Ke, L., Ding, X., Li, W., & Qiu, B. (2017). Remote sensing of glacier change in the Central Qinghai-Tibet Plateau and the relationship with changing climate. Remote Sensing, 9(114), 3–19. doi:10.3390/rs9020114
- Khromova, T., Nosenko, G., Kutuzov, S., Muraviev, A., & Chernova, L. (2014). Glacier area changes in Northern Eurasia. Environmental Research Letters, 9(1), 468–475. doi:10.1088/1748-9326/9/1/015003
- Laba, Z. M., Qiu, Y. B., & Chu, D. (2017). A dataset of glacier distribution and glacier changes at Kharola (1972 - 2017). China Scientific Data, 2(2), 12–19.
- Li, G., & Lin, H. (2017). Recent decadal glacier mass balances over the Western Nyainqentanglha Mountains and the increase in their melting contribution to Namco Lake measured by differential bistatic SAR interferometry. Global and Planetary Change, 149, 177–190. doi:10.1016/j.gloplacha.2016.12.018
- Lin, L., Jiang, L., Jiang, H., Wang, H., Xu, H., & Xu, H. (2019). Accelerated glacier mass loss (2011–2016) over the puruogangri ice field in the inner Tibetan plateau revealed by bistatic insar measurements. Remote Sensing of Environment, 231, 111241. doi:10.1016/j.rse.2019.111241
- Liu, S. Y., Guo, W. Q., & Xu, J. L. (2019). The second glacial catalog data set of China (v1.0). National glacial and frozen desert scientific data center. http://www.ncdc.ac.cn/
- Liu, J., et al, Yao, X., & Cao, J., et al (2020). A dataset of glacial vector in the Gangdisê Mountains in 2016. China Scientific Data, 5(1), 1–10. https://doi.org/10.11922/csdata.2019.0020.zh
- Lu, J. Y., Qiu, Y. B., Wang, X. X., Liang, W. S., Xie, P. F., Shi, L. J. … Zhang, D. S. (2020). Constructing dataset of classified drainage areas based on surface water-supply patterns in High Mountain Asia. Big Earth Data, 4(3), 225–241. doi:10.1080/20964471.2020.1766180
- Maurer, J. M., Schaefer, J. M., Rupper, S., & Corley, A. (2019). Acceleration of ice loss across the Himalayas over the past 40 years. Science Advances, 5(6). doi:10.1126/sciadv.aav7266
- Meier, M. F., Dyurgerov, M. B., Rick, U. K., O’Neel, S., Pfe?er, W. T., Anderson, R. S. … Glazovsky, A. F. (2007). Glaciers dominate eustatic sea-level rise in the 21st century. Science, 5841(317), 1064–1067. doi:10.1126/science.1143906
- Muhammad, S., Li, J., Jakob, F. S., Shrestha, F., Ghulam, M. S., Etienne, B. … Tian, L. D. (2021). A holistic view of Shisper Glacier surge and outburst floods: From physical processes to downstream impacts. Geomatics, Natural Hazards and Risk, 12(1), 2755–2775. doi:10.1080/19475705.2021.1975833
- Muhammad, S., & Thapa, A. (2020). An improved Terra-Aqua MODIS snow cover and Randolph Glacier Inventory 6.0 combined product (MOYDGL06*) for high-mountain Asia between 2002 and 2018. Earth System Science Data, 12(1), 345–356. doi:10.5194/essd-12-345-2020
- Pandey, P., Ali, S. N., & Ray, P. (2021). Glacier-Glacial Lake interactions and Glacial Lake development in the Central Himalaya, India (1994-2017). Journal of Earth Science, 32(6), 1563–1574. doi:10.1007/s12583-020-1056-9
- Qiu, Y., Lu, J., Shi, L., Xie, P., Liang, W., & Wang, X. (2019). Passive microwave remote sensing data of snow water equivalent in High Asia. China Scientific Data, 4(1), 1–16.
- Qiu, Y., Massimo, M., Li, X., Birendra, B., Joni, K., Narantuya, D., & Zhao, T. (2017). Observing and understanding High Mountain and cold regions using Big Earth Data. Bulletin of Chinese Academy of Sciences, 32(Z1), 82–94.
- Ran, W. J., Wang, X. I., & Guo, W. Q. (2021). A dataset of glacier inventory of West China in 2018. China Scientific Data 6(2) , 1–10.
- Raup, B. H., Racoviteanu, S. S., Khalsa, C., Helm, R., Armstrong, R., & Arnaud, Y. (2007). The GLIMS geospatial glacier database: A new tool for studying glacier change. Global and Planetary Change, 56(1–2), 101–110. doi:10.1016/j.gloplacha.2006.07.018
- RGI Consortium. (2017). Randolph Glacier Inventory-A dataset of global glacier outlines: Version 6.0: Technical report, global land ice measurements from space, Colorado, USA: Digital Media.
- Tian, L. D., Yao, T. D., Gao, Y., Thompson, L., Mosley-Thompson, E., Muhammad, S. … Li, Z. (2017). Two glaciers collapse in western Tibet. Journal of Glaciology, 63(237), 194–197. doi:10.1017/jog.2016.122
- Wang, X., Qiu, Y., Zhang, Y., Lemmetyinen, J., Cheng, B., Liang, W., & Leppäranta, M. (2021). A lake ice phenology dataset for the Northern Hemisphere based on passive microwave remote sensing. Big Earth Data, 1–19 doi:10.1080/20964471.2021.1992916.
- Wu, K., Liu, S., Guo, W., Wei, J., Xu, J., Bao, W., & Yao, X. (2016). Glacier change in the western Nyainqentanglha Range,Tibetan Plateau using historical maps and Landsat imagery: 1970-2014. Journal of Mountain Science, 13(8), 1358–1374. doi:10.1007/s11629-016-3997-0
- Wu, K., Liu, S., Jiang, Z., Xu, J., Wei, J., & Guo, W. (2018). Recent glacier mass balance and area changes in the Kangri Karol Mountains from DEMs and glacier inventories. The Cryosphere, 12(1), 103–121. doi:10.5194/tc-12-103-2018
- Yagoub, Y., Li, Z., Siddig, A. A. H., Musa, O., & Anjum, M. (2018). Glacier mass-balance variation in China during the past half century. Journal of Geoscience and Environment Protection, 6(05), 37–58. doi:10.4236/gep.2018.65004
- Ye, Q., Zong, J., Tian, L., Cogley, J. G., Song, C., & Guo, W. (2017). Glacier changes on the Tibetan Plateau derived from Landsat imagery: Mid-1970s – 2000–13. Journal of Glaciology, 63(238), 273–287. doi:10.1017/jog.2016.137
- Zhang, T., Wei, J. F., Zhang, Y., Wang, X., & Zheng, Y. J. (2021, December 27). A dataset for annual changes of Longbasaba Glacier in the Central Himalayas during 1988-2018. Science Data Bank, 6(4), 1–10.
- Zhou, Y., Lia, Z., Lia, J., Zhao, R., & Ding, X. (2018). Glacier mass balance in the Qinghai–Tibet Plateau and it surroundings from the mid-1970s to 2000 based on Hexagon KH-9 and SRTM DEMs. Remote Sensing of Environment, 210, 96–112. doi:10.1016/j.rse.2018.03.020