

 ?Mathematical formulae have been encoded as MathML and are displayed in this HTML version using MathJax in order to improve their display. Uncheck the box to turn MathJax off. This feature requires Javascript. Click on a formula to zoom.
ABSTRACT
Standardized Precipitation Index (SPI) and Standardized Precipitation Evapotranspiration Index (SPEI), traditionally derived at a monthly scale, are widely used drought indices. To overcome temporal-resolution limitations, we have previously developed and published a well-validated daily SPI/SPEI in situ dataset. Although having a high temporal resolution, this in situ dataset presents low spatial resolution due to the scarcity of stations. Therefore, based on the China Meteorological Forcing Dataset, which is composed of data from more than 1,000 ground-based observation sites and multiple remote sensing grid meteorological dataset, we present the first high spatiotemporal-resolution daily SPI/SPEI raster datasets over China. It spans from 1979 to 2018, with a spatial resolution of 0.1° × 0.1°, a temporal resolution of 1-day, and the timescales of 30-, 90-, and 360-days. Results show that the spatial distributions of drought event characteristics detected by the daily SPI/SPEI are consistent with the monthly SPI/SPEI. The correlation between the daily value of the 12-month scale and the monthly value of SPI/SPEI is the strongest, with linear correlation, Nash-Sutcliffe coefficient, and normalized root mean square error of 0.98, 0.97, and 0.04, respectively. The daily SPI/SPEI is shown to be more sensitive to flash drought than the monthly SPI/SPEI. Our improved SPI/SPEI shows high accuracy and credibility, presenting enhanced results when compared to the monthly SPI/SPEI. The total data volume is up to 150 GB, compressed to 91 GB in Network Common Data Form (NetCDF). It can be available from Figshare (https://doi.org/10.6084/m9.figshare.c.5823533) and ScienceDB (https://doi.org/10.57760/sciencedb.j00076.00103).
1. Introduction
Drought is a periodic climate anomaly, which is mainly driven by the natural variability of the climate and is characterized by slow development, long duration, and a wide range of influences (Zeng et al., Citation2022; Zhang et al., Citation2022c). As a consequence of global climate change, the occurrence of extreme weather phenomena, such as drought, have gradually intensified (Qi et al., Citation2019; Wang et al., Citation2020, Citation2020, Citation2021; Wang, Citation2014). Indeed, severe meteorological droughts have been reported all over the world during the past few decades (Hao et al., Citation2020; Moravec et al., Citation2021; Wilcox et al., Citation2020; Zeng et al., Citation2020). China has been plagued by meteorological drought disasters since ancient times, causing serious impacts on society and economy (Chen et al., Citation2019; Leng et al., Citation2022; Lin et al., Citation2020; Wang et al., Citation2017; Zhang et al., Citation2022). It is reported that southern China experienced a once-in-a-century extreme drought event accompanied by a heatwave in 2013 (Yuan et al., Citation2016). However, due to the complexity, randomness, multiple causes, and complicated spatiotemporal characteristics of drought (Hao et al., Citation2018), our understanding of drought mechanisms is still limited. Therefore, it is urgent to improve drought monitoring efforts to advance the understanding of drought disasters with the aim of mitigating the impact of meteorological drought.
Drought indices are the basis for describing and quantifying drought conditions, and are helpful tools for early warning, monitoring, and assessment of drought (Wu et al., Citation2022; Zargar et al., Citation2011). Since the triggers to drought occurrences are complex and related to multiple factors, drought indices are usually calculated by assimilating one or more climatic, hydrological, and meteorological parameters, such as precipitation, streamflow, radiation, temperature, among others (Hao & Singh, Citation2015). Currently, there are a large number of different drought indices, including some of the most commonly used, such as the Palmer Drought Severity Index (PDSI) (Palmer, Citation1965), the Standardized Precipitation Index (SPI) (Mckee et al., Citation1993), and the Standardized Precipitation Evapotranspiration Index (SPEI) (Vicente-Serrano et al., Citation2010). Several studies focused on the development and improvement of various drought indices, achieving promising results (Brown et al., Citation2008; Liu et al., Citation2020; Zeng et al., Citation2022). Among them, SPI and SPEI can be calculated based on longer time scales to reflect agricultural and hydrological drought conditions (Russo et al., Citation2013; Wang et al., Citation2021).
SPI mainly quantifies drought by reflecting accumulated precipitation deficits (Mckee et al., Citation1993). Its simplicity and multi-time scale calculation method have made SPI one of the meteorological drought indices officially recommended by many national meteorological service agencies (Dabanlı et al., Citation2017; Patel et al., Citation2007). Several studies have adapted SPI to improve and/or develop new drought indices (Koutroulis et al., Citation2010; Tsakiris et al., Citation2007). Nevertheless, SPI is still one of the first-choice indices used for state-of-the-art studies. SPEI is an adaptation of SPI, which, besides precipitation, considers the effects of temperature, adding a term of potential evapotranspiration (Vicente-Serrano et al., Citation2010). Studies have shown that SPEI and SPI can better reflect regional drought conditions at different scales than PDSI (Yao et al., Citation2018). The monitoring capability of SPEI is slightly improved compared to SPI (Chen et al., Citation2019). SPEI has been widely used in research fields such as ecology, agriculture, and hydrology (Kayiranga et al., Citation2021). To avoid the one-month time resolution limitation of SPEI/SPI, we developed an in situ daily multi-scale SPEI/SPI dataset based on the meteorological station data over the mainland China (Wang et al., Citation2015, Citation2021, Citation2022). However, we found that solving the problem of time-resolution created a new problem regarding spatial-resolution, since station data is still limited and scarce over the country. The existent public SPEI/SPI raster datasets only 90 have a monthly time resolution and a spatial resolution of lower than 0.5° × 0.5° (Peng et al., Citation2020; Spinoni et al., Citation2019). This brings challenges to small-scale high-precision drought monitoring and analysis. Moreover, there are currently no published daily SPI or SPEI raster datasets. Therefore, it is essential to further develop and update the SPEI/SPI raster datasets with high spatial and temporal resolution.
Therefore, the main purpose of this study is to develop the first SPEI and SPI dataset with high spatiotemporal resolution in China. Firstly, based on the China Meteorological Forcing Dataset (CMFD), we explored the differences of drought event characteristics detected by traditional monthly SPI/SPEI under different probability distribution functions (PDFs). Appropriate PDFs were then selected to develop daily SPI and SPEI datasets of 30-day, 90-day, and 360-day with a spatial resolution of 0.1° × 0.1°. We compared and analyzed the differences between monthly and daily SPI/SPEI to demonstrate the monitoring ability of the daily SPI/SPEI. Overall, our study overcomes the limitations of traditional drought indices in terms of time and space resolution and lays a solid data foundation for the research of drought characteristics and mechanisms.
2. Methods
2.1. Study area
China has a complex and diverse geography, with mountainous areas covering about more than 2/3 of the land. There is significant seasonal, inter-annual, and monthly variability in precipitation and temperature over the largest parts of continental China located in the East Asia monsoon region (Wu et al., Citation2011). Due to diverse climate conditions and complicated topographic influences, drought is one of the most frequent natural disasters in China and drought condition varies unequally with seasons and its geographical location (Chen & Sun, Citation2017). With climate change and human activities, these abnormal drought characteristics are prominent, with obvious changes of drought intensity, frequency, and duration in China. Accordingly, a systematic study of drought change in China is urgently needed.
2.2. Data sources
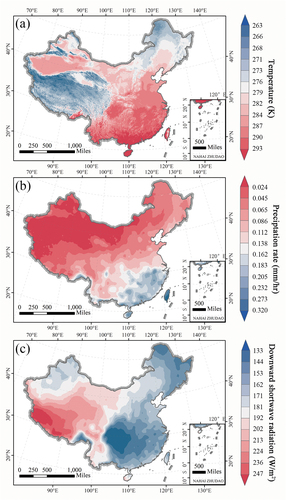
In this study, we used the CMFD developed by He et al. (Citation2020) spanning from 1979 to 2018. The CMFD was calculated based on multiple remote sensing products, existing climate reanalysis datasets, and Chinese meteorological station datasets (https://doi.org/10.6084/m9.figshare.c.4557599). It includes 7 common meteorological parameters, such as temperature, precipitation rate, downward shortwave radiation, downward longwave radiation, among others, with a spatial resolution of 0.1° × 0.1° and a temporal resolution of 3 hours. Compared with other commonly used assimilated meteorological datasets, CMFD presents higher spatial resolution and stricter data quality control. The dataset was first downloaded as a free trial in 2012 and was updated to the latest version in 2020. It is one of the key datasets of the China Qinghai-Tibet Plateau Science Data Center and has been widely used in hydrology, ecology, climatology, and many other fields (Chen et al., Citation2021; Jin et al., Citation2021; Zuo et al., Citation2021). This stable and reliable dataset can provide accurate meteorological parameters for the drought index calculation of this study. The spatial distribution of the multi-year average temperature, precipitation rate, and downward shortwave radiation in this dataset is shown in .
Figure 1. Distribution of the mean value of temperature (a), precipitation rate (b), and downward shortwave radiation (c) in the China Meteorological Forcing Dataset (CMFD) from 1979 to 2018.
2.3. SPI calculation
SPI is the standardized precipitation distribution probability, which quantitatively characterizes the degree of precipitation deficit over different time periods. The traditional monthly SPI assumes that the accumulated precipitation in a given month follows a certain probability distribution (Mckee et al., Citation1993). The normalized probability and cumulative density functions of accumulated precipitation are computed over an N-month timescale. Choosing an appropriate PDF can effectively improve the accuracy of the index (Zhao et al., Citation2020). We have estimated monthly SPI using five different distributions and then compared them based on the detection of drought events. Since SPI is calculated based on the cumulative precipitation time series and to avoid the truncated distribution when the cumulative precipitation is 0, we selected the following five PDFs: Gamma, Gumbel, Logistic, Log-Logistic, and Normal. The processes of fitting and calculating SPI using these distributions are detailed in Stagge et al. (Citation2013).
Our results show that the effects of different PDFs on drought event characteristics are limited (see details in Section 3.1). Moreover, previous studies have shown that the parameters of the Gamma distribution are flexible and suitable for SPI calculations over multiple regions (Zhao et al., Citation2020; Stagge et al., Citation2013). Therefore, we adopted the Gamma distribution to calculate the daily SPI. Before fitting the gamma distribution, the monthly accumulated precipitation can be refined to daily accumulated precipitation for different scales (e.g. 30 days) referring to our previously improved daily SPEI calculation process (Wang et al., Citation2021):
where ,
, and k represent the year, day of the year, and the time scale, respectively.
is the monthly accumulated precipitation, and
is the daily accumulated precipitation.
Then, we adopted the Gamma distribution to fit the accumulated precipitation time series. It is common for accumulated precipitation to be zero on a certain time scale, particularly on shorter time scales. In that case, it is not appropriate to use the Gamma distribution for fitting. Hence, we introduced the Weibull plotted position function to quantify the probability distribution when the accumulated precipitation is 0:
where refers to the proportion of 0 precipitation in the historical period.
is the probability distribution for samples with detectable accumulated precipitation. The parameters
and
are the total number of samples and the number of samples where total precipitation equals zero, respectively.
The detailed fitting process and calculation method can be found in the traditional monthly SPI and our improved daily SPEI algorithm (Mckee et al., Citation1993; Wang et al., Citation2021). All these monthly and daily SPI datasets developed by us can be freely obtained from the website (https://doi.org/10.6084/m9.figshare.c.5823533).
2.4. SPEI calculation
SPEI fits and normalizes the PDF of the cumulative water deficit, i.e. the difference between precipitation and potential evapotranspiration (PET) time series, to quantify regional wet and dry conditions (Vicente-Serrano et al., Citation2010). This index considers the influence of precipitation and temperature on drought, which combines the advantages of PDSI and SPI (Paulo et al., Citation2012). The most commonly used PET calculation methods include Penman-Monteith (Penman & Keen, Citation1948), Thornthwaite (Thornthwaite, Citation1948), and Hargreaves (Hargreaves & Samani, Citation1982) equations. Considering the availability of meteorological variables and the need for daily values, we selected the Hargreaves model to estimate monthly and daily PET. Studies have shown that temperature and radiation can explain most of the variability in surface evapotranspiration (Martí et al., Citation2015). The Hargreaves model has strong applicability in different regions (Tomer & Schilling, Citation2009; Vangelis et al., Citation2013).
The optimal PDF of SPEI is still controversial, and the same distribution function performs differently in different regions (Beguería et al., Citation2014; Stagge et al., Citation2013; Vicente-Serrano & Beguería, Citation2015). Firstly, we calculated monthly SPEI with four different PDFs based on monthly PET. Considering that SPEI fits a time series of cumulative water deficit that may have negative values, we chose the following four distributions: Log-Logistic, Generalized Extreme Value (GEV), Normal, and Pearson type III, to explore drought event detection ability of monthly SPEI under different PDFs. The fitting formula and detailed calculation process of monthly SPEI under these PDFs can be found in Stagge et al. (Citation2013).
Then, we calculated the daily SPEI based on daily PET. It is reported that the GEV distribution has strong stability and is superior to the widely used generalized logistic distribution in the calculation of short-time-scale SPEI in many regions (Khadka et al., Citation2021; Tabari et al., Citation2021). Therefore, combining our findings (see Section 3.1) with previous experience, we calculated daily SPEI based on the GEV distribution. The detailed fitting process and calculation method can be found in Wang et al. (Citation2021). Generally, according to the value of SPI/SPEI, we can classify wet and dry conditions into 9 levels (). The characteristics of drought events are calculated as follows:
Table 1. Classification of SPI and SPEI.
where, and
represent the beginning and end of a drought event. Drought frequency refers to the number of droughts (Haile et al., Citation2020).
As with SPI, the traditional monthly SPEI datasets fitted by difference distributions, together with our high temporal and spatial resolution daily SPI/SPEI datasets, are freely available to the public for further analysis and application by researchers.
2.5. Statistical metrics
To verify the reliability of our improved daily SPI/SPEI, we calculated the Correlation coefficient (R) (Parajuli, Citation2012), Normalized Root Mean Square Error (NRMSE) (Zhou, Citation2016), Nash- Sutcliffe efficiency (NS) (Nash & Sutcliffe, Citation1970) between daily and monthly SPI/SPEI.
where, and
are observed and simulated values, respectively; and
and
are the average of the observed and simulated values, respectively.
In addition, Pettitt’s test was used to detect the abrupt change-points in daily and monthly SPI/SPEI time series. Pettitt’s test is a non-parametric mutation point monitoring method, which has been widely used in time series change point detection in hydrology, drought, vegetation, meteorology and other fields (Ma et al., Citation2008; Zuo et al., Citation2016). Furthermore, Theil–Sen (TS) and Mann–Kendall (MK) have been known for their robustness in detecting trend changes (Kendall, Citation1948; Mann, Citation1945; Sen et al., Citation1968; Theil, Citation1992). Therefore, they were used here to evaluate temporal changes of daily and monthly SPI/SPEI time series and changes in drought event characteristics, such as severity, duration, and frequency. Finally, to investigate the performance of our improved daily SPI/SPEI in drought event detection, we used the run theory to calculate severity, duration, and frequency of drought events (Zhang et al., Citation2022c). A sequence with SPI/SPEI continuously below a certain threshold is regarded as a drought event; the sum of the absolute values of SPI/SPEI for this sequence is the drought severity; the length of this sequence is the drought duration. Drought frequency is the number of drought events within our study period.
3. Datasets attributes
Datasets developed here contain daily values of SPI and SPEI for three timescales (i.e. 30 days, 90 days, and 360 days) over China from 1979 to 2018. It is organized in Network Common Data Form (NetCDF) files according to its time scales. Traditional monthly SPI and SPEI are also available in NetCDF files according to the different fitted probability distributions. Filenames are organized in the format of “A_B_C_D_E-F.nc”, where “A” represents the dataset temporal resolution; “B” is the name of drought index; “C” is the name of the probability distribution function; “D” is the timescale; “E-F” is the start- and end- time of the dataset (e.g. Daily_SPEI_GEV_30D_1979–2018.nc). Simultaneously, we also provide the daily SPI and SPEI at the 270-day time scale, as well as the traditional monthly SPI/SPEI datasets of different PDFs to facilitate the comparative study. All NetCDF datasets are published in figshare (Zhang et al., Citation2022) and can be found at https://doi.org/10.6084/m9.figshare.c.5823533.
4. Technical validation
4.1. Drought event detected by SPI and SPEI using different distributions
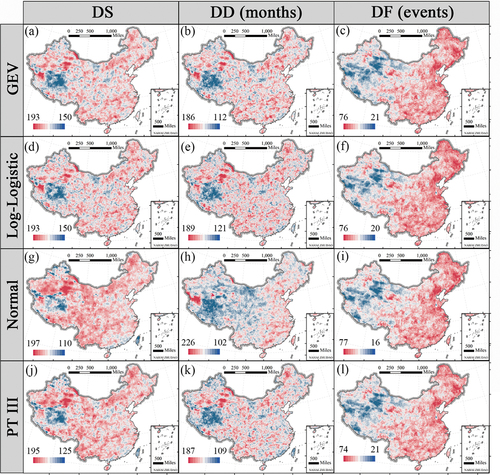
The spatial distribution of drought severity, duration, and frequency detected from monthly SPI on different distribution functions are shown in . Although the values of drought severity, duration, and frequency detected by SPI on different distribution functions are slightly different, the overall spatial patterns are consistent. Drought severity and drought duration detected by SPI fitted by the distributions (except Gumbel) had similar spatial characteristics. Generally, different distribution functions for SPI estimation have similar detection ability of drought event characteristics. Compared with SPI, the spatial distribution of drought event detected by SPEI under the four distribution functions is more consistent (). Different distribution functions have little effect on the feature detection of drought events in SPI/SPEI.
Figure 2. Spatial distribution of drought severity (DS), duration (DD), and frequency (DF) extracted from the 3-month-scale monthly SPI on Gamma, Gumbel, Logistic, Log-Logistic, and Normal distributions.
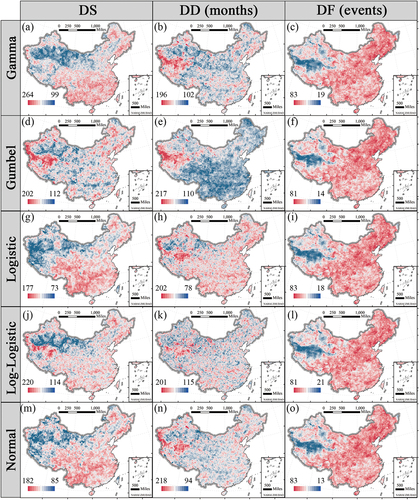
Figure 3. Spatial distribution of drought severity (DS), duration (DD), and frequency (DF) extracted from the 3-month-scale monthly SPEI on GEV, Log-Logistic, Normal, and Pearson Type III distributions.
4.2. Relationship between daily and monthly SPI and SPEI time series
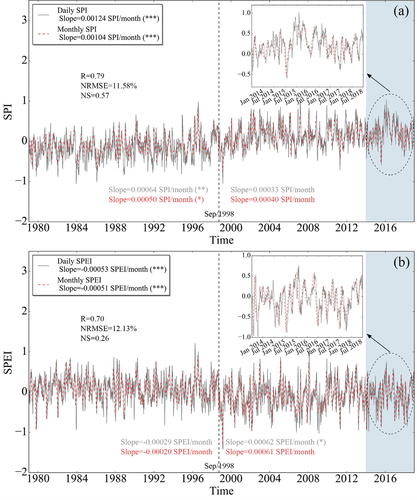
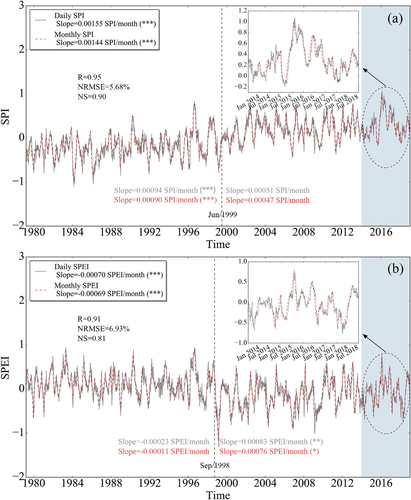
shows the differences between the improved daily SPI/SPEI for 30-day scale and the traditional monthly SPI/SPEI for 1-month scale averaged over China from 1979 to 2018. The results show that the R value between the improved daily SPI for 30-day scale and the traditional monthly SPI for 1-month scale is 0.79, which is slightly higher than the R value (0.70) between the daily and the monthly SPEI for 1-month scale. From 1979 to 2018, the daily and monthly SPI have a significant upward trend, with slopes of 0.00124 (daily) and 0.00104 (monthly) SPI/month, which means that the precipitation gradually increased from 1980 to 2018 in China. However, SPEI shows a significant drying trend, with slopes of −0.00053 (daily) and −0.00051 (monthly) SPEI/month. The abrupt change in September 1998 may be related with the different precipitation data used by CMFD. The improved daily SPEI/SPI not only restores more dry and wet details, but also keeps the general trend consistent with the traditional monthly SPEI/SPEI.
Figure 4. The relationship between the daily and monthly SPI (a) or SPEI (b) time series on 1-month scale. The dashed line perpendicular to the x-axis is the turning point of the time series. The gray (daily SPI or SPEI) and red (monthly SPI or SPEI) text before and after the dashed line are the slope and significance of the time series before and after the turning point.
The relationships between the daily SPI/SPEI at the 90-day scale and the monthly SPI/SPEI at the 3-month scale are shown in . The R values between daily and monthly SPI/SPEI on the 3-month scale are substantially higher than those obtained with the 1-month scale, with R values of 0.95 (SPI) and 0.91 (SPEI). Furthermore, the daily and monthly SPI at the 3-month scale show a significant upward trend, with slopes of 0.00155 and 0.00144 SPI/month. The 3-month scale SPI shows a turning point in June 1999. The daily and monthly SPI before the turning point have a significant upward trend, while they have no obvious trend after the turning point. Moreover, the daily and monthly SPEI at the 3-month scale show a significant downward trend, with slopes of −0.00070 and −0.00069 SPEI/month. Here, the turning point coincides with that of the 1-month scale SPEI, occurring in September 1998. Even though the daily and monthly SPEI show a downward trend before the turning point, this is not significant. Results also show that there is a slight upward trend after the turning point.
Figure 5. The relationship between the daily and monthly SPI (a) or SPEI (b) time series on 3-month scale. The dashed line perpendicular to the x-axis is the turning point of the time series. The gray (daily SPI or SPEI) and red (monthly SPI or SPEI) text before and after the dashed line are the slope and significance of the time series before and after the turning point.
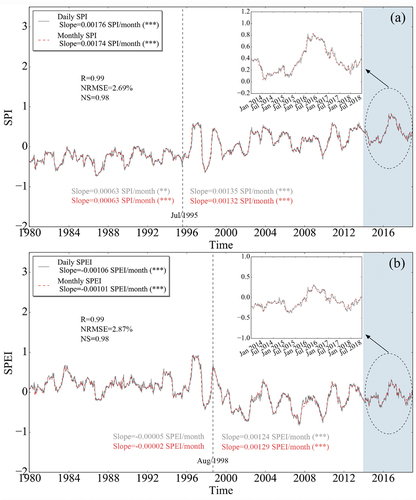
shows the relationship between daily SPI/SPEI for the 360-day scale and monthly SPI/SPEI for the 12-month scale. As the time scale increases, the correlation between the improved daily SPI/SPEI and the traditional monthly SPI/SPEI became stronger. The correlation coefficients R and NS for the 12-month scale are 0.99 and 0.98 for both daily and monthly SPI/SPEI. Both the daily and monthly SPI show a significant upward trend, with slopes of 0.00176 and 0.00174 SPI/month. The turning point of the 12-month scale SPI occurs in July 1995, prior to the turning points shown at the 1- and 3-month scales. Before and after the turning point, both daily and monthly SPI show a significant upward trend. Daily and monthly SPEI show a significant downward trend with slopes of −0.00106 and −0.00101 SPEI/month. The turning point of the SPEI at the 12-month scale is close to those at the 1- and 3-month scales, occurring in August 1998. Before the turning point, the SPEI shows a not significant downward trend, while after the turning point showed a significant upward trend.
Figure 6. The relationship between the daily and monthly SPI (a) or SPEI (b) time series on 12-month scale. The dashed line perpendicular to the x-axis is the turning point of the time series. The gray (daily SPI or SPEI) and red (monthly SPI or SPEI) text before and after the dashed line are the slope and significance of the time series before and after the turning point.
4.3. Spatial distribution of drought characteristics and its changing trend
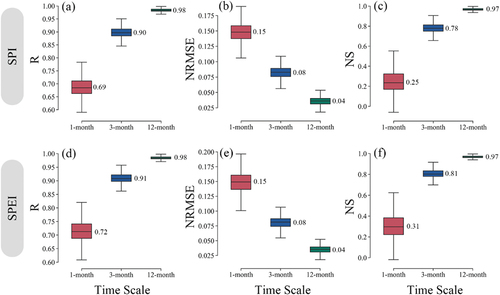
The distribution of R, NRMSE, and NS values between the daily and monthly SPI/SPEI at different timescales over the grid points is also presented in . As previously stated, the correlation between the improved daily SPI/SPEI and the traditional monthly SPI/SPEI increases with the time scale. The average R between the daily and monthly SPI/SPEI values of each grid point on the 12-month scale is about 0.98 (both SPI and SPEI), while that of the 1-month scale is about 0.69 (SPI) and 0.72 (SPEI). The average NRMSE between daily and monthly SPI/SPEI for the 12-month scale is 0.04, being the error smaller than that for 1- and 3-month time scales (0.15 and 0.08, respectively). The average NS and R of the 1- and 3-month SPEI were slightly larger than those of SPI, while NRMSE was similar for the three-time scales of SPI and SPEI.
Figure 7. Boxplots of R, NRMSE, NS values between daily and monthly SPI or SPEI time series for each grid point.
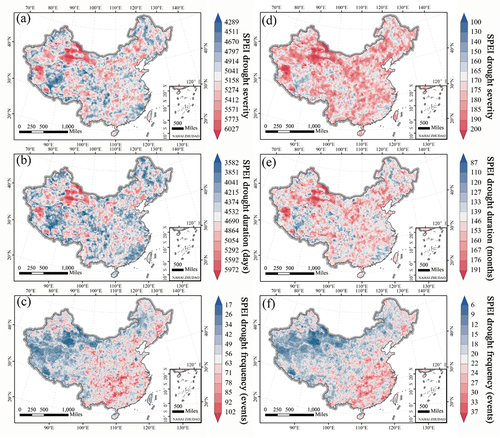
Taking the 12-month scale as an example, the spatial distributions of drought severity, duration, and frequency in China from 1979 to 2018 detected by the daily and monthly SPI and SPEI are shown in . The spatial distribution of drought severity, duration, and frequency based on the daily and monthly SPI is consistent. However, the absolute value of each of these three characteristics in the daily SPI was higher than that of the monthly SPI. Indeed, daily SPI detected 18 to 204 drought events, while monthly SPI only detected between 5 and 38 events. The daily SPI detected about five times as many drought events compared to the monthly SPI in the eastern and southern China, where drought events are frequent. The characteristics of drought events detected by daily SPEI and monthly SPEI also have consistent spatial distribution. As with SPI, characteristics detected by daily SPEI are higher than those detected by monthly SPEI. Among them, the number of drought events in China detected by daily SPEI is between 17 and 102, while the number of these events detected by the traditional monthly SPEI is between 6 and 37. Hence, the number of drought events detected by daily SPEI is about three times higher than that detected by the monthly SPEI in the southern regions where mild and moderate droughts are frequent.
Figure 8. Spatial distribution of drought severity, duration, and frequency extracted from daily and monthly SPI at 12-month scale.
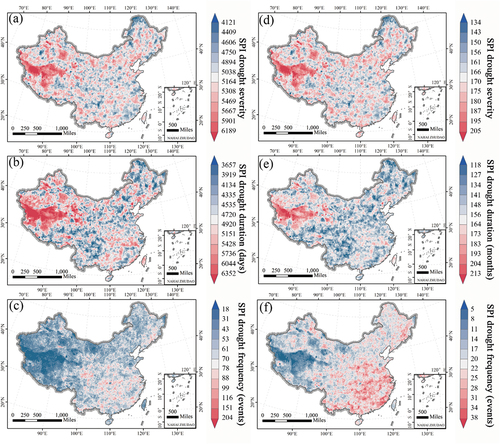
Figure 9. Spatial distribution of drought severity, duration, and frequency extracted from daily and monthly SPEI at 12-month scale.
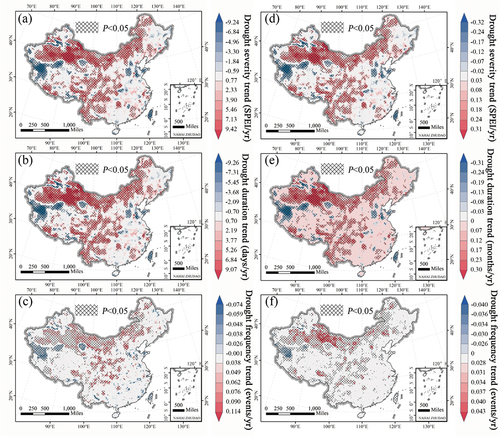
Taking the 12-month scale as an example, the spatial distributions of the change trends in drought severity, duration, and frequency based on daily and monthly SPI and SPEI from 1979 to 2018 are shown in . The spatial distribution of the variation trend of drought event characteristics is consistent between the cases of using the daily and monthly SPI. Both daily and monthly SPI detect significant increases in drought severity, duration, and frequency in the Southwest and a small part of the Northeast China, while significant improvements in drought are detected in the Northwest. The variation trend of drought characteristics detected by daily SPI is slightly larger than that detected by monthly SPI. Daily SPEI is also consistent with monthly SPEI in the detection of change trends in drought event characteristics. Similar to SPI, both daily and monthly SPEI detect a significant increase in drought in southwestern China. However, SPI and SPEI detect completely opposite trends in drought characteristics in the Northwest. Generally, our improved daily SPI/SPEI is comparable to the traditional monthly SPI/SPEI in detecting the characteristics of drought events and their trends. It improves the temporal resolution while ensuring the accuracy of drought detection, being more effective in detecting short-term drought events. Besides high drought detection accuracy, the high temporal resolution of the daily dataset presents an improved capability in detecting short-term drought events.
Figure 10. Spatial distribution of trends in drought severity, duration, and frequency extracted from daily and monthly SPI on 12-month scale.
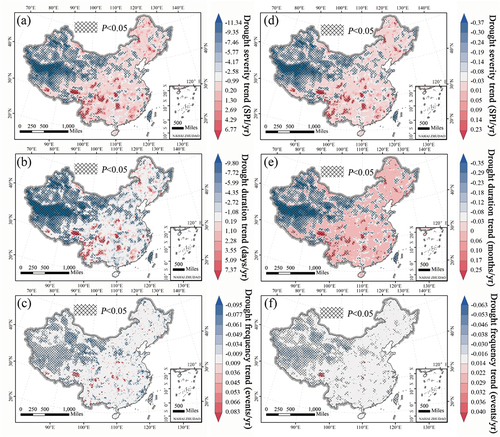
Figure 11. Spatial distribution of trends in drought severity, duration, and frequency extracted from daily and monthly SPEI on 12-month scale.
5. Summary of the data validation
Previous studies have shown that a suitable PDF can improve the accuracy of drought detection (Zhao et al., Citation2020; Stagge et al., Citation2013; Vicente-Serrano & Beguería, Citation2015). However, we found that although the characteristics of drought events detected by monthly SPI/SPEI fitted by different PDFs were different, the overall spatial patterns were consistent (). The monthly SPI/SPEI under different PDFs could all effectively reflect the regional drought characteristics. The choice of PDF has limited impact on the ability to detect drought events. Therefore, referring to the study of Stagge et al. (Citation2013), we adopted the Gamma and GEV distribution to fit the improved daily SPI and SPEI time series, respectively. The main purpose of this study is to develop a set of high spatial and temporal resolution SPI and SPEI datasets. Future work will focus on further exploring the validity and accuracy of daily SPI/SPEI under different distribution functions, with the aim of continuing to update both datasets.
According to the analysis results of daily and monthly SPI/SPEI time series on different time scales, we found that the change detected by the daily indices is slightly higher than that of the monthly indices. This may be a result of higher sensitivity to short-term flash droughts by daily SPI/SPEI than by monthly SPI/SPEI. From 1979 to 2018, SPEI had a significant downward trend, while SPI had a significant upward trend. This implies that although the precipitation in China increased significantly from 1979 to 2018, the PET also increased sharply, resulting in inconsistent trends between SPEI and SPI (Feng & Zhao, Citation2015; Li et al., Citation2020). In addition, both daily and monthly SPI/SPEI detected a significant change point around 1998. This may be due to the CMFD data using different precipitation datasets prior to 1998.
The comparison and verification results of daily and monthly SPI/SPEI at different time scales show that they have the strongest correlation at the 12-month scale, with R, NRMSE, and NS being 0.98, 0.04, and 0.97, respectively. The longer the timescales, the higher the correlation between our improved daily SPI/SPEI and the traditional monthly SPI/SPEI. This indicates that our improved daily SPI/SPEI performs well in detecting long-term severe droughts, being consistent with the traditional monthly value of SPI/SPEI. Generally, the shorter the time scale, the more sensitive the SPI/SPEI is to short-term drought, resulting in more dramatic fluctuations in the SPI/SPEI time series (Mckee et al., Citation1993). Therefore, on short time scales, the poor correlation between the daily and monthly SPI/SPEI may not imply lower precision, but may be due to the fact that the daily SPI/SPEI is more sensitive to short-term flash droughts.
Taking the 12-month scale as an example, we further analyzed the differences between daily and monthly SPI/SPEI in detecting drought severity, duration, and frequency and analyzed their trends. The daily and monthly SPI/SPEI showed that drought events have gradually increased in the southwest of China. This is consistent with previous studies (Li et al., Citation2015; Wang et al., Citation2015). The difference between SPI and SPEI in the Northwest may be due to the fact that SPEI considers the contribution of temperature to drought in the Northwest (Deng et al., Citation2022). Daily SPI/SPEI in the eastern and southern regions detected more drought events than the monthly SPI/SPEI, which may be due to shorter-term droughts in the eastern and southern regions (Li & Huang, Citation2021). Moreover, the improved daily SPI and SPEI detected short-term drought significantly better than the traditional monthly SPI/SPEI. Therefore, the number of droughts detected by the daily indices in the east and south is higher than that detected by the monthly indices.
In conclusion, our improved daily SPI/SPEI can not only effectively detect the changes of severe drought events, but also effectively improve the detection capability of flash drought, making it a powerful tool for the relevant authorities and researchers for drought study and related policy-making.
6. Dataset value
In this study, we developed the first high-spatial-resolution daily SPI/SPEI dataset over China from 1979 to 2018. This dataset not only refines the traditional monthly SPI/SPEI to a daily scale, but also has a high spatial resolution (0.1° × 0.1°), which can meet the needs of drought researches in different scenarios. Our validation results show that the improved daily SPI/SPEI performs well in identifying both long-term and short-term droughts. The characteristics of drought events detected by the improved daily SPI/SPEI were consistent with the monthly SPI/SPEI, with the advantage that mild drought events can be more accurately identified. In conclusion, this high temporal and spatial resolution SPI/SPEI dataset can help to effectively monitor the characteristics of different types of droughts, especially flash droughts. To better serve researchers in different fields and promote in-depth research on drought, the dataset is freely available to the public and will be continuously updated. Moreover, to facilitate further comparative analysis by researchers, we also made the traditional monthly SPI dataset available, estimated with five probability distribution functions (Gamma, Gumbel, Logistic, Log-Logistic, and Normal), as well as the traditional monthly SPEI dataset estimated with four probability distribution functions (Log-Logistic, GEV, Normal, and Pearson type III).
Open Scholarship

This article has earned the Center for Open Science badge for Open Data. The data are openly accessible at http://www.doi.org/10.11922/sciencedb.j00076.00085.
Acknowledgement
Special thanks to Prof. Yang Kun’s team for the China meteorological forcing dataset. Thanks to the Natural Science Foundation of Fujian Province (No. 2021J01627; No. 2020J01465) and the National Natural Science Foundation of China (No. 41601562; No. 32071776) for their financial support.
Disclosure statement
No potential conflict of interest was reported by the author(s).
Data availability statement
The data described in this article are openly available on Figshare (https://doi.org/10.6084/m9.figshare.c.5823533) or on ScienceDB (https://doi.org/10.57760/sciencedb.j00076.00103).
Correction Statement
This article has been corrected with minor changes. These changes do not impact the academic content of the article.
Additional information
Funding
Notes on contributors

Rongrong Zhang
Rongrong Zhang received a bachelor’s degree in human geography and urban and rural planning from Fuzhou University in 2019. She is currently pursuing a master’s degree in geography at Fuzhou University. Her main research interests are global drought and vegetation dynamics.

Virgílio A. Bento
Virgílio A. Bento is currently a Scientific Researcher at the Instituto Dom Luiz (IDL), Faculty of Sciences, University of Lisbon (FCUL). He received his (1) first degree in Meteorology, Oceanography, and Geophysics from FCUL in 2011; (2) M.Sc. in Geophysical Sciences from FCUL in 2013; and (3) Ph.D. in Geophysical and Geoinformation Sciences also from FCUL in 2018. His main areas of interest are remote sensing and radiation theory, climatology, drought assessment and its implications on vegetation and agricultural crops, as well as its relationship with different climate modes of variability (e.g. El Niño-Southern Oscillation, Atlantic Multidecadal Oscillation), wildfires, and heatwaves. He has worked with the aim of international projects such as the EUMETSAT Satellite Applications Facilities on Land Surface Analysis (LSA SAF) and Climate Monitoring (CM-SAF) and the Brazilian System Fire-Land-Atmosphere (BrFLAS). Currently, he is working in the scope of the National Roadmap for Adaptation XXI - Portuguese Territorial Climate Change Vulnerability Assessment for XXI Century (RNA2100).

Junyu Qi
Junyu Qi 's research emphasizes uncovering the interconnections between climate, landscape, and hydrological and biogeochemical processes of complex ecosystem systems using physical, mathematical, and biological modeling approaches. His research is focused primarily on 1) developing improved representations of physical/biogeochemical processes in terrestrial and aquatic ecosystems, and 2) integrating field observation, remote sensing, and watershed/regional models to advance numerical simulation.

Feng Xu
Rongrong Zhang received a bachelor’s degree in human geography and urban and rural planning from Fuzhou University in 2019. She is currently pursuing a master’s degree in geography at Fuzhou University. Her main research interests are global drought and vegetation dynamics.
Feng Xu received her Bachelor’s degree in human geography and urban and rural planning from Fuzhou University in 2021. She is currently studying for a master’s degree in geography at Fuzhou University. Her research interests include climate change, drought disasters, and agro-hydrological model improvement.

Jianjun Wu
Jianjun Wu is professor and is the director of the Key Laboratory of Environmental Remote Sensing and Digital City of Beijing, and the director of Drought Mitigation Center at Beijing Normal University as well. He is a member of expert committee of Chinese National Committee for Disaster Reduction. Dr. Jianjun Wu has much experience in the research and education on natural disasters based on remote sensing and GIS. He has developed a serial of methods for disaster monitoring base upon remote sensing, and the method for evaluating the impact on crop by drought. He has coordinated or participated in more than 20 research projects on natural disasters. From 2017 to 2021, he had coordinated a project of National Key R&D Program of China, which is Natural Disaster Monitoring and Emergency Response Services by space information.

Jianxiu Qiu
Jianxiu Qiu is an associate professor in the Department of Land Resources and Environment, School of Geography and Planning, Sun Yat-sen University. She is mainly engaged in remote sensing inversion of key elements of global water cycle, simulation and prediction of surface water-thermal process, development and application of land surface assimilation system, and occurrence mechanism and early warning of natural disasters related to water-carbon cycle. She has presided over and participated in many scientific research projects, including NSFC general projects, NSFC Youth projects, NSFC key projects, etc.

Jianwei Li
Jianwei Li is currently an associate researcher and deputy director of the Department of Digital Media in the School of Physics and Information Engineering, Fuzhou University. He has long been engaged in the research and development of computer graphics, digital media technology and geographic information system related interdisciplinary subjects.

Wei Shui
Wei Shui was gradually promoted to instructor, associate professor and professor in agronomy college at Sichuan Agricultural University in 1997–2012. From 2009–2010, he was a visiting professor and visiting scholar at Western Michigan University and Michigan State University. Since 2013, Wei Shui is a professor of geography in college of environment & safety engineering at Fuzhou University, and has research interests in regional sustainable development, ecogeography, LUCC and ecological effects, Remote sensing and GIS applications, city and regional planning.

Qianfeng Wang
Qianfeng Wang is currently an associate professor at the College of Environmental & Safety Engineering, Fuzhou University. He is mainly engaged in the research of resource ecological remote sensing, and agricultural-hydrological model improvement, monitoring and evaluating of drought.
References
- Beguería, S., Vicente-Serrano, S., Reig, F., & Latorre, B. (2014). Standardized precipitation evapotranspiration index (SPEI) revisited: Parameter fitting, evapotranspiration models, tools, datasets and drought monitoring. International Journal of Climatology, 34(10), 3001–3023. https://doi.org/10.1002/joc.3887
- Brown, J. F., Wardlow, B. D., Tadesse, T., Hayes, M. J., & Reed, B. C. (2008). The vegetation drought response index (VegDRI): A new integrated approach for monitoring drought stress in vegetation. GIScience & Remote Sensing, 45(1), 16–46. https://doi.org/10.2747/1548-1603.45.1.16
- Chen, S., Gan, T. Y., Tan, X., Shao, D., & Zhu, J. (2019). Assessment of CFSR, ERA-Interim, JRA-55, MERRA-2, NCEP-2 reanalysis data for drought analysis over China. Climate Dynamics, 53(1), 737–757. https://doi.org/10.1007/s00382-018-04611-1
- Chen, Y., Liang, S., Ma, H., Li, B., He, T., & Wang, Q. (2021). An all-sky 1 km daily land surface air temperature product over mainland China for 2003–2019 from MODIS and ancillary data. Earth System Science Data, 13(8), 4241–4261. https://doi.org/10.5194/essd-13-4241-2021
- Chen, H., & Sun, J. (2017). Characterizing present and future drought changes over eastern China. International Journal of Climatology, 37, 138–156. https://doi.org/10.1002/joc.4987
- Chen, W. Z. E. A., Zhu, D., Huang, C., Ciais, P., Yao, Y., Friedlingstein, P., Sitch, S., Haverd, V., Jain, A. K., Kato, E., Kautz, M., Lienert, S., Lombardozzi, D., Poulter, B., Tian, H., Vuichard, N., Walker, A. P., & Zeng, N. (2019). Negative extreme events in gross primary productivity and their drivers in China during the past three decades. Agricultural and Forest Meteorology, 275, 47–58. https://doi.org/10.1016/j.agrformet.2019.05.002
- Dabanlı, İ., Mishra, A. K., & Şen, Z. (2017). Long-term spatio-temporal drought variability in Turkey. Journal of Hydrology, 552, 779–792. https://doi.org/10.1016/j.jhydrol.2017.07.038
- Deng, H., Tang, Q., Yun, X., Tang, Y., Liu, X., Xu, X., Sun, S., Zhao, G., Zhang, Y., & Zhang, Y. (2022). Wetting trend in Northwest China reversed by warmer temperature and drier air. Journal of Hydrology, 613, 128435. https://doi.org/10.1016/j.jhydrol.2022.128435
- Feng, Y., & Zhao, X. (2015). Changes in spatiotemporal pattern of precipitation over China during 1980–2012. Environmental Earth Sciences, 73(4), 1649–1662. https://doi.org/10.1007/s12665-014-3517-x
- Haile, G. G., Tang, Q., Hosseini-Moghari, S.-M., Liu, X., Gebremicael, T. G., Leng, G., Kebede, A., Xu, X., & Yun, X. (2020). Projected impacts of climate change on drought patterns over East Africa. Earth’s Future, 8(7), e2020EF001502. https://doi.org/10.1029/2020EF001502
- Hao, Z., Li, W., Singh, V. P., Xia, Y., Zhang, X., & Hao, F. (2020). Impact of dependence changes on the likelihood of hot extremes under drought conditions in the United States. Journal of Hydrology, 581, 124410. https://doi.org/10.1016/j.jhydrol.2019.124410
- Hao, Z. C., & Singh, V. P. (2015). Drought characterization from a multivariate perspective: A review. Journal of Hydrology, 527, 668–678. https://doi.org/10.1016/j.jhydrol.2015.05.031
- Hao, Z. C., Singh, V. P., & Xia, Y. L. (2018). Seasonal drought prediction: Advances, challenges, and future prospects. Reviews of Geophysics, 56(1), 108–141. https://doi.org/10.1002/2016rg000549
- Hargreaves, G. H., & Samani, Z. A. (1982). Estimating Potential Evapotranspiration. Journal of the Irrigation and Drainage Division, 108(3), 225–230. https://doi.org/10.1061/JRCEA4.0001390
- He, J., Yang, K., Tang, W., Lu, H., Qin, J., Chen, Y., & Li, X. (2020). The first high-resolution meteorological forcing dataset for land process studies over China. Scientific Data, 7(1), 25. https://doi.org/10.1038/s41597-020-0369-y
- Jin, H., Chen, X., Zhong, R., Wu, P., & Li, D. (2021). Spatio-temporal changes of precipitation in the Hanjiang River Basin under climate change. Theoretical and Applied Climatology, 146(3), 1441–1458. https://doi.org/10.1007/s00704-021-03801-y
- Kayiranga, A., Chen, B., Zhang, H., Nthangeni, W., Measho, S., & Ndayisaba, F. (2021). Spatially explicit and multiscale ecosystem shift probabilities and risk severity assessments in the greater Mekong subregion over three decades. The Science of the Total Environment, 798, 149281. https://doi.org/10.1016/j.scitotenv.2021.149281
- Kendall, M. G. (Ed.). (1948). Rank correlation methods. In Rank correlation methods. Griffin. 146–163.
- Khadka, D., Babel, M. S., Shrestha, S., Virdis, S. G. P., & Collins, M. (2021). Multivariate and multi-temporal analysis of meteorological drought in the northeast of Thailand. Weather and Climate Extremes, 34, 100399. https://doi.org/10.1016/j.wace.2021.100399
- Koutroulis, A., Vrochidou, A.-E., & Tsanis, I. (2010). Spatiotemporal characteristics of meteorological drought for the island of crete. Journal of Hydrometeorology, 12(2), 206–226. https://doi.org/10.1175/2010JHM1252.1
- Leng, S., Huete, A., Cleverly, J., Yu, Q., Zhang, R., & Wang, Q. (2022). Spatiotemporal variations of dryland vegetation phenology revealed by satellite-observed fluorescence and greenness across the North Australian tropical transect. Remote Sensing, 14(13), 2985. https://doi.org/10.3390/rs14132985
- Li, X., He, B., Quan, X., Liao, Z., & Bai, X. (2015). Use of the Standardized Precipitation Evapotranspiration Index (SPEI) to characterize the drying trend in Southwest China from 1982–2012. Remote Sensing, 7(8), 10917–10937. https://doi.org/10.3390/rs70810917
- Li, X., & Huang, W.-R. (2021). How long should the pre-existing climatic water balance be considered when capturing short-term wetness and dryness over China by using SPEI? The Science of the Total Environment, 786, 147575. https://doi.org/10.1016/j.scitotenv.2021.147575
- Lin, K. H. E., Wang, P. K., Pai, P. L., Lin, Y. S., & Wang, C. W. (2020). Historical droughts in the Qing dynasty (1644–1911) of China. Climate of the Past, 16(3), 911–931. https://doi.org/10.5194/cp-16-911-2020
- Li, L., She, D., Zheng, H., Lin, P., & Yang, Z.-L. (2020). Elucidating diverse drought characteristics from two meteorological drought indices (SPI and SPEI) in China. Journal of Hydrometeorology, 21(7), 1513–1530. https://doi.org/10.1175/JHM-D-19-0290.1
- Liu, X. F., Feng, X. M., Ciais, P., Fu, B. J., Hu, B. Y., & Sun, Z. L. (2020). GRACE satellite-based drought index indicating increased impact of drought over major basins in China during 2002–2017. Agricultural and Forest Meteorology, 291, 11. https://doi.org/10.1016/j.agrformet.2020.108057
- Ma, Z., Kang, S., Zhang, L., Tong, L., & Su, X. (2008). Analysis of impacts of climate variability and human activity on streamflow for a river basin in arid region of northwest China. Journal of Hydrology, 352(3), 239–249. https://doi.org/10.1016/j.jhydrol.2007.12.022
- Mann, H. B. (1945). Nonparametric tests against trend. Econometrica, 13(3), 245–259. https://doi.org/10.2307/1907187
- Martí, P., Zarzo, M., Vanderlinden, K., & Girona, J. (2015). Parametric expressions for the adjusted Hargreaves coefficient in Eastern Spain. Journal of Hydrology, 529, 1713–1724. https://doi.org/10.1016/j.jhydrol.2015.07.054
- Mckee, T., Doesken, N., & Kleist, J. (1993). The relationship of drought frequency and duration to time scales. American Meteorological Society.
- Mckee, T., Doesken, N., & Kleist, J. (1993). The relationship of drought frequency and duration to time scales. 179–184.
- Moravec, V., Markonis, Y., Rakovec, O., Svoboda, M., Trnka, M., Kumar, R., & Hanel, M. (2021). Europe under multi-year droughts: How severe was the 2014–2018 drought period? Environmental Research Letters, 16(3), 13. https://doi.org/10.1088/1748-9326/abe828
- Nash, J. E., & Sutcliffe, J. V. (1970). River flow forecasting through conceptual models part I — a discussion of principles. Journal of Hydrology, 10(3), 282–290. https://doi.org/10.1016/0022-1694(70)90255-6
- Palmer, W. C. (1965). Meteorological drought. n. 30: US Department of Commerce,
- Parajuli, P. (2012). Comparison of potential bio-energy feedstock production and water quality impacts using a modeling approach. Journal of Water Resource and Protection, 4(09), 763–771. https://doi.org/10.4236/jwarp.2012.49087
- Patel, N. R., Chopra, P., & Dadhwal, V. K. (2007). Analyzing spatial patterns of meteorological drought using standardized precipitation index. Meteorological Applications, 14(4), 329–336. https://doi.org/10.1002/met.33
- Paulo, A. A., Rosa, R. D., & Pereira, L. S. (2012). Climate trends and behaviour of drought indices based on precipitation and evapotranspiration in Portugal. Nat Hazards Earth Syst Sci, 12(5), 1481–1491. https://doi.org/10.5194/nhess-12-1481-2012
- Peng, J., Dadson, S., Hirpa, F., Dyer, E., Lees, T., Miralles, D. G., Vicente-Serrano, S. M., & Funk, C. (2020). A pan-African high-resolution drought index dataset. Earth System Science Data, 12(1), 753–769. https://doi.org/10.5194/essd-12-753-2020
- Penman, H. L., & Keen, B. A. (1948). Natural evaporation from open water, bare soil and grass. Proceedings of the Royal Society of London Series A, Mathematical and Physical Sciences, 193(1032), 120–145. https://doi.org/10.1098/rspa.1948.0037
- Qi, J., Zhang, X., & Wang, Q. (2019). Improving hydrological simulation in the Upper Mississippi River Basin through enhanced freeze-thaw cycle representation. Journal of Hydrology, 571, 605–618. https://doi.org/10.1016/j.jhydrol.2019.02.020
- Russo, S., Dosio, A., Sterl, A., Barbosa, P., & Vogt, J. (2013). Projection of occurrence of extreme dry-wet years and seasons in Europe with stationary and nonstationary Standardized Precipitation Indices. Journal of Geophysical Research-Atmospheres, 118(14), 7628–7639. https://doi.org/10.1002/jgrd.50571
- Sen, Sen, P. K., & Kumar, P. (1968). Estimates of the regression coefficient based on Kendall’s Tau. Publications of the American Statal Association, 63(324), 1379–1389. https://doi.org/10.2307/2285891
- Spinoni, J., Barbosa, P., De Jager, A., Mccormick, N., Naumann, G., Vogt, J. V., Magni, D., Masante, D., & Mazzeschi, M. (2019). A new global database of meteorological drought events from 1951 to 2016. Journal of Hydrology: Regional Studies, 22, 100593. https://doi.org/10.1016/j.ejrh.2019.100593
- Stagge, J. H., Tallaksen, L. M., Gudmundsson, L., Loon, A. F. V., & Stahl, K. (2013). Candidate distributions for climatological drought indices (SPI and SPEI). International Journal of Climatology, 35(13), 4027–4040. https://doi.org/10.1002/joc.4267
- Tabari, H., Hosseinzadehtalaei, P., Thiery, W., & Willems, P. (2021). Amplified drought and flood risk under future socioeconomic and climatic change. Earth’s Future, 9(10), e2021EF002295. https://doi.org/10.1029/2021EF002295
- Theil, H. (1992). A rank-invariant method of linear and polynomial regression analysis. Springer. https://doi.org/10.1007/978-94-011-2546-8_20
- Thornthwaite, C. W. (1948). An approach toward a rational classification of climate. Soil science, 66(1), 55–94. https://doi.org/10.1097/00010694-194807000-00007
- Tomer, M. D., & Schilling, K. E. (2009). A simple approach to distinguish land-use and climate-change effects on watershed hydrology. Journal of Hydrology, 376(1), 24–33. https://doi.org/10.1016/j.jhydrol.2009.07.029
- Tsakiris, G., Pangalou, D., & Vangelis, H. (2007). Regional drought assessment based on the Reconnaissance Drought Index (RDI). Water Resources Management, 21(5), 821–833. https://doi.org/10.1007/s11269-006-9105-4
- Vangelis, H., Tigkas, D., & Tsakiris, G. (2013). The effect of PET method on Reconnaissance Drought Index (RDI) calculation. Journal of Arid Environments, 88, 130–140. https://doi.org/10.1016/j.jaridenv.2012.07.020
- Vicente-Serrano, S., & Beguería, S. (2015). Comment on ‘Candidate distributions for climatological drought indices (SPI and SPEI)’ by James H. Stagge et al. Stagge et al. International Journal of Climatology, 36(4), 2120–2131. https://doi.org/10.1002/joc.4474
- Vicente-Serrano, S. M., Begueria, S., & Lopez-Moreno, J. I. (2010). A multiscalar drought index sensitive to global warming: the standardized precipitation evapotranspiration index. Journal of Climate, 23(7), 1696–1718. https://doi.org/10.1175/2009jcli2909.1
- Wang, Q. E. A. (2014). Temporal-spatial characteristics of severe drought events and their impact on agriculture on a global scale. Quaternary International, 349, 10–21. https://doi.org/10.1016/j.quaint.2014.06.021
- Wang, Q., Qi, J., Li, J., Cole, J., Waldhoff, S. T., & Zhang, X. (2020). Nitrate loading projection is sensitive to freeze-thaw cycle representation. Water Research, 186, 116355. https://doi.org/10.1016/j.watres.2020.116355
- Wang, Q., Qi, J., Qiu, H., Li, J., Cole, J., Waldhoff, S., & Zhang, X. (2021). Pronounced increases in future soil erosion and sediment deposition as influenced by Freeze–Thaw cycles in the Upper Mississippi River Basin. Environmental Science & Technology, 55(14), 9905–9915. https://doi.org/10.1021/acs.est.1c02692
- Wang, Q., Qi, J., Wu, H., Zeng, Y., Shui, W., Zeng, J., & Zhang, X. (2020). Freeze-Thaw cycle representation alters response of watershed hydrology to future climate change. CATENA, 195, 104767. https://doi.org/10.1016/j.catena.2020.104767
- Wang, Q., Shi, P., Lei, T., Geng, G., Liu, J., Mo, X., Li, X., Zhou, H., & Wu, J. (2015). The alleviating trend of drought in the Huang-Huai-Hai Plain of China based on the daily SPEI. International Journal of Climatology, 35(13), 3760–3769. https://doi.org/10.1002/joc.4244
- Wang, Q., Wu, J., Li, X., Zhou, H., Yang, J., Geng, G., An, X., Liu, L., & Tang, Z. (2017). A comprehensively quantitative method of evaluating the impact of drought on crop yield using daily multi-scale SPEI and crop growth process model. International Journal of Biometeorology, 61(4), 685–699. https://doi.org/10.1007/s00484-016-1246-4
- Wang, Q., Zeng, J., Qi, J., Zhang, X., Zeng, Y., Shui, W., Xu, Z., Zhang, R., Wu, X., & Cong, J. (2021). A multi-scale daily SPEI dataset for drought characterization at observation stations over mainland China from 1961 to 2018. Earth System Science Data, 13(2), 331–341. https://doi.org/10.5194/essd-13-331-2021
- Wang, Q., Zhang, R., Qi, J., Zeng, J., Wu, J., Shui, W., Wu, X., & Li, J. (2022). An improved daily standardized precipitation index dataset for mainland China from 1961 to 2018. Scientific Data, 9(1), 124. https://doi.org/10.1038/s41597-022-01201-z
- Wang, W., Zhu, Y., Xu, R., & Liu, J. (2015). Drought severity change in China during 1961–2012 indicated by SPI and SPEI. Natural Hazards, 75(3), 2437–2451. https://doi.org/10.1007/s11069-014-1436-5
- Wilcox, K. R. E. A., Koerner, S. E., Hoover, D. L., Borkenhagen, A. K., Burkepile, D. E., Collins, S. L., Hoffman, A. M., Kirkman, K. P., Knapp, A. K., Strydom, T., Thompson, D. I., & Smith, M. D. (2020). Rapid recovery of ecosystem function following extreme drought in a South African savanna grassland. Ecology, 101(4), e02983. https://doi.org/10.1002/ecy.2983
- Wu, Z. Y., Lu, G. H., Wen, L., & Lin, C. A. (2011). Reconstructing and analyzing China’s fifty-nine year (1951–2009) drought history using hydrological model simulation. Hydrology and Earth System Sciences, 15(9), 2881–2894. https://doi.org/10.5194/hess-15-2881-2011
- Wu, X., Zhang, R., Bento, V. A., Leng, S., Qi, J., Zeng, J., & Wang, Q. (2022). The effect of drought on vegetation gross primary productivity under different vegetation types across China from 2001 to 2020. Remote Sensing, 14(18), 4658. https://doi.org/10.3390/rs14184658
- Yao, N., Li, Y., Lei, T., & Peng, L. (2018). Drought evolution, severity and trends in mainland China over 1961–2013. The Science of the Total Environment, 616-617, 73–89. https://doi.org/10.1016/j.scitotenv.2017.10.327
- Yuan, W. E. A., Cai, W., Chen, Y., Liu, S., Dong, W., Zhang, H., Yu, G., Chen, Z., He, H., Guo, W., Liu, D., Liu, S., Xiang, W., Xie, Z., Zhao, Z., & Zhou, G. (2016). Severe summer heatwave and drought strongly reduced carbon uptake in Southern China. Scientific reports, 6(1), 18813. https://doi.org/10.1038/srep18813
- Zargar, A., Sadiq, R., Naser, B., & Khan, F. I. (2011). A review of drought indices. Environmental Review, 19(NA), 333–349. https://doi.org/10.1139/a11-013
- Zeng, J., Zhang, R., Lin, Y., Wu, X., Tang, J., Guo, P., Li, J., & Wang, Q. (2020). Drought frequency characteristics of China, 1981-2019, based on the vegetation health index. Climate Research, 81, 131–147. https://doi.org/10.3354/cr01616
- Zeng, J., Zhang, R., Qu, Y., Bento, V. A., Zhou, T., Lin, Y., Wu, X., Qi, J., Shui, W., & Wang, Q. (2022). Improving the drought monitoring capability of VHI at the global scale via ensemble indices for various vegetation types from 2001 to 2018. Weather and Climate Extremes, 35, 100412. https://doi.org/10.1016/j.wace.2022.100412
- Zhang, R., Bento, V. A., Junyu, Q., Feng, X., & Wang, Q. (2022). The first high spatial resolution multi-scale daily SPI and SPEI raster dataset over China from 1979 to 2018. FIGSHARE.
- Zhang, R., Qi, J., Leng, S., & Wang, Q. (2022). Long-Term vegetation phenology changes and responses to preseason temperature and precipitation in Northern China. Remote Sensing, 14(6), 1396. https://doi.org/10.3390/rs14061396
- Zhang, R., Wu, X., Zhou, X., Ren, B., Zeng, J., & Wang, Q. (2022c). Investigating the effect of improved drought events extraction method on spatiotemporal characteristics of drought. Theoretical and Applied Climatology, 147(1), 395–408. https://doi.org/10.1007/s00704-021-03838-z
- Zhao, R., Wang, H., Zhan, C., Hu, S., Ma, M., & Dong, Y. (2020). Comparative analysis of probability distributions for the Standardized Precipitation Index and drought evolution in China during 1961–2015. Theoretical and Applied Climatology, 139(3), 1363–1377. https://doi.org/10.1007/s00704-019-03050-0
- Zhou, Z. (2016). Machine Learning. Tsinghua University Press.
- Zuo, D. E. A., Han, Y., Xu, Z., Li, P., Ban, C., Sun, W., Pang, B., Peng, D., Kan, G., Zhang, R., & Yang, H. (2021). Time-lag effects of climatic change and drought on vegetation dynamics in an alpine river basin of the Tibet Plateau, China. Journal of Hydrology, 600, 126532. https://doi.org/10.1016/j.jhydrol.2021.126532
- Zuo, D., Xu, Z., Yao, W., Jin, S., Xiao, P., & Ran, D. (2016). Assessing the effects of changes in land use and climate on runoff and sediment yields from a watershed in the Loess Plateau of China. The Science of the Total Environment, 544, 238–250. https://doi.org/10.1016/j.scitotenv.2015.11.060