
ABSTRACT
Changes in temperature and precipitation have a profound effect on the ecological environment and socioeconomic systems. In this study, we focus on the major Belt and Road Initiative (BRI) regions and develop a dataset of temperature and precipitation at global temperature rise targets of 1.5°C, 2°C, and 3°C above pre-industrial levels under the Representative Concentration Pathway (RCP) 8.5 emission scenario using 4 downscaled global model datasets data at a fine spatial resolution of 0.0449147848° (~5 km) globally from EnviDat. The temperature variables include the daily maximum (Tmax), minimum (Tmin) and average (Tmp) surface air temperatures, and the diurnal temperature range (DTR). We first evaluate the performance of the downscaled model data using CRU-observed gridded data for the historical period 1986–2005. The results indicate that the downscaled model data can generally reproduce the pattern characteristics of temperature and precipitation variations well over the major BRI regions for 1986–2005. Furthermore, we project temperature and precipitation variations over the major BRI regions at global temperature rise targets of 1.5°C, 2°C, and 3°C under the RCP8.5 emission scenario based on the dataset by adopting the multiple-model ensemble mean. Our dataset contributes to understanding detailed the characteristics of climate change over the major BRI regions, and provides data fundamental for adopting appropriate strategies and options to reduce or avoid disadvantaged consequences associated with climate change over the major BRI regions. The dataset is available at https://doi.org/10.57760/sciencedb.01850.
1. Introduction
The changes and anomalies of temperature and precipitation, as the basic meteorological elements, are of far-reaching significance to the ecological environment and socioeconomic development. Under the background of global warming, the more frequently occurring extreme events caused by temperature and precipitation changes result in more severe climate change risks and challenges (Bao et al., Citation2022; Ren et al., Citation2020; Yang & Zhang, Citation2020; Zhong et al., Citation2020; Zhuang et al., Citation2018). Zhao and Dai (Citation2021) indicated that the frequency of drought events will increase significantly in the late 21st century (2070–2099), together with large increases in drought duration and areas under different Shared Socioeconomic Pathways (SSPs). Qin (Citation2022) investigated changes in population exposure to wet, dry, heat and cold extremes at 1.5°C and 2.0°C temperature rise targets and revealed that more than two-thirds of the global population will be exposed to wet, dry and heat extremes. To combat increasing climate-related risks, nearly 200 countries in the world agreed with “the Paris Agreement” and adopted the temperature rise targets of 1.5°C and 2°C in relation to pre-industrial levels.
Over the last several decades, many studies on global and regional climate change have been conducted at different temperature rise targets under future emission scenarios (Aihaiti et al., Citation2021; Hu et al., Citation2017; Huang et al., Citation2017; Joshi et al., Citation2011; Ullah et al., Citation2020; Wang et al., Citation2018; Zhai et al., Citation2017; Zhang, Zhuang, et al., Citation2018, Citation2021). The IPCC issued “the special report on global warming at 1.5°C” in 2018, which pointed out that the extreme weather and climate events led by temperature and precipitation changes, such as heat waves, floods and drought, will be more frequent and stronger with the enhancement of global temperature rise targets, causing the climate-related risks to become substantially higher (Intergovernmental Panel on Climate Change (IPCC), Citation2018).
Approximately 70% of the world’s population lives in the major Belt and Road Initiative (BRI) regions (United Nations, Department of Economic and Social Affairs, Population Division (United Nations, Department of Economic and Social Affairs (UN–DESA–PD), Citation2014). The human system and ecological environment of the major BRI areas are sensitive and fragile to climate change and complex and varied weather and climate disasters, and they are expected to face more severe climate risks in the future (Guo, Citation2018; Liu, Song, et al., Citation2018, Citation2020; Wu et al., Citation2018; Zhang, Zhuang, et al., Citation2018, Citation2019). Previous studies on climate change over the major BRI regions have also made some progress (Dong et al., Citation2018; Jing et al., Citation2019; Zhuang & Zhang, Citation2020; Dong et al., Citation2021; Peng et al., Citation2022). Lv et al. (Citation2021) used the five Coupled Model Intercomparison Project phase 6 (CMIP6) model data to analyse the future changes in temperature, precipitation and evaporation over the BRI regions. The results show that the temperature, precipitation and evaporation over the BRI regions will generally display an increasing trend, and the magnitudes will continue to increase with the increase of emission scenarios and the extension of time. Zhuang et al. (Citation2021) indicated that compared to the pre-industrial period of 1850–1900, global temperature rise targets of 1.5°C and 2°C will occur during the middle and late 2020s and approximately 2040, respectively. Under the two temperature rise targets, the temperature will be significantly warmer over the major BRI regions with the warming magnitude in high latitudes generally larger than that in low and middle latitudes, whilst there are obvious regional differences in precipitation.
Future projections are essential for adapting to climate change and effectively managing related disaster risks. However, most of the previous climate change projection studies are based on the global coupled model (GCM) at coarse resolutions (approximately 50–250 km), which makes it difficult to provide detailed information on climatic change at a local to regional scale (Ji et al., Citation2019; King & Karoly, Citation2017; Liu, Song, et al., Citation2018; Mitchell et al., Citation2016; Schleussner et al., Citation2016; Tian et al., Citation2017; Ullah et al., Citation2020; Xu et al., Citation2017). In this study, we used the downscaled data for four CMIP5 global circulation models (CMIP5-GCMs) at a fine spatial resolution of 0.0449147848° (~5 km) to develop a dataset of temperature and precipitation changes over the major BRI regions at global temperature rise targets of 1.5°C, 2°C, and 3°C for the Representative Concentration Pathway (RCP) 8.5 emission scenario. The performance of the 4 downscaled GCMs in simulating daily maximum (Tmax), minimum (Tmin) and average temperature (Tmp), diurnal temperature range (DTR) and precipitation (Pre) over the major BRI regions for the historical period 1986–2005 were first evaluated using observed gridded data. Then, we developed a dataset of temperature and precipitation changes under 1.5°C, 2°C, and 3°C temperature rise targets and analyzed the temperature and precipitation changes at different temperature rise targets for the RCP8.5 emission scenario over the major BRI regions.
2. Data and methods
2.1. Data sources
In this dataset, the major BRI regions were defined as including the areas ranging from 10°S to 72°N in latitude and from 18°W to 146°E in longitude, which cover most of Asia, Europe, Central and Northern Africa. The monthly observed temperature data were obtained from the Climatic Research Unit (CRU) gridded dataset Version 4.05 (CRU TS4.05). The CRU TS4.05 data were generated at a resolution of 0.5° based on historical records worldwide for the period of 1901–2018 (Harris et al., Citation2020).
The downscaled data at a high spatial resolution of 0.0449147848° (~5 km) used to produce the dataset were taken from EnviDat (https://doi.org/10.16904/envidat.124) for a total of three variables including daily maximum and minimum temperature (Tmax and Tmin) and precipitation (Pre) from four global circulation models of CMIP5 (CMIP5-GCMs) for the historical (1850–2005) period and the future (2006–2100) period under the future Representative Concentration Pathway (RCP) 8.5 emission scenario. The 4 CMIP5-GCMs were ACCESS1–3, CESM1-BGC, CMCC-CM and MIROC5. The reason for choosing these four CMIP5-GCMs for downscaling is that they are relatively independent from each other, which can better represent the uncertainty in climate prediction, and will be conducive to reducing the interdependency in the MME mean (Karger et al., Citation2020).
2.2. Methodology
These downscaled data were generated by using the four CMIP5-GCMs model outputs and a semi-mechanical CHELSA downscaling algorithm method (Karger et al., Citation2017), which provides a more accurate representation of temperature and precipitation in highly complex terrain. Based on monthly CHELSA V1.2 time series temperature data, a monthly climatological aided interpolation method (Hunter & Meentemeyer, Citation2005; Mosier et al., Citation2014) was firstly applied to downscale the observed Tmax and Tmin. Then, temperature anomalies were optimized to a 5 km grid resolution by using multilevel B-spline interpolation with 14 error levels (Lee et al., Citation1997). Finally, the optimized anomaly was added to the interpolated observation to obtain high-resolution temperature data. For Pre, the multilevel B-spline interpolation and semi-mechanistic CHELSA downscaling algorithm, as explained in Karger et al. (Citation2017), was adopted for high-resolution Pre data. Previous studies indicate that these downscaling model data provide a better representation of precipitation and temperature estimates and offer a higher resolution estimate of GCM output for future climate projections (Karger et al., Citation2020). In our dataset, the five variables of Tmax, Tmin, Tmp (daily mean surface air temperature), DTR (diurnal temperature range) and Pre were adopted. Note that the Tmp was calculated from the average of Tmax and Tmin, and the DTR is equal to Tmax minus Tmin.
We first used a Taylor diagram (Taylor, Citation2001) and the box-plot diagram methods to evaluate the four CMIP5-GCMs and MME mean simulations in five temperature and precipitation indicators for the historical period over the major BRI regions based on the CRU observations. Note that CRU-observed data are bilinearly interpolated to the same resolution as the four CMIP5-GCMs data before evaluation. Then, we calculated a skill score for each model for Tmp, Tmax, Tmin, DTR and Pre for the period of 2006–2020 by using the approach of Hargreaves (Citation2010). Finally, the four-member MME mean projections were employed to estimate future changes relative to the historical period in Tmax, Tmin, Tmp, DTR and Pre over the major BRI regions at the 1.5°C, 2°C, and 3°C temperature rise targets for the RCP8.5 emission scenario. As the temperature rise targets relative to the pre-industrial period, we defined the period of 1850–1900 as the pre-industrial period in this study, because it is the earliest period of sufficiently globally complete observations to estimate global surface temperature, which can be used as an approximation for pre-industrial conditions (Intergovernmental Panel on Climate Change (IPCC), Citation2021). In terms of the determination of the temperature rise year, we first performed an 11-year running average of the 1850–2100 global annual mean temperature anomaly series relative to the pre-industrial period to reduce or remove the influence of interannual variability. Then, the first year when the global annual mean temperature anomaly greater than 1.5°C, 2°C, and 3°C is defined as the year of 1.5°C, 2°C, and 3°C. In this study, the statistical significance of the future temperature and precipitation changes was assessed by Student’s t–test.
3. Data records
The domain of this dataset includes the land areas of the major BRI extending from 10°S to 72°N in latitude and from 18°W to 146°E in longitude, at a spatial resolution of 0.0449147848° (~5 km). For the historical evaluation in the five variables of Tmax, Tmin, Tmp, DTR and Pre, there are 25 files of model data yearly for the period of 1986–2005, all of which are in NetCDF format. Each file corresponds to one variable of an individual model or Multi-Model Ensemble (MME). For example, the file CHELSAcmip5ts_Tmax.MME.1986–2005.year.BRI.nc refers to the Tmax data for the four-member MME mean simulations, and the file named CHELSAcmip5ts_Tmax.ACCESS1–3.1986–2005.year.BRI.nc represents the Tmax data over the major BRI regions for the ACCESS1–3 model. The files of other variables (Tmin, Tmp, DTR and Pre) and models (CESM1-BGC, CMCC-CM, MIROC5 and MME) are all provided. The size of each file is approximately 514 MB. For global temperature rise targets of 1.5°C, 2°C, and 3°C above pre-industrial levels, 75 files of model data yearly under the RCP8.5 emission scenario are presented. The name of the individual file bears a similarity to that of the historical period.
4. Technical validation
displays the evaluation between the four-member MME mean and the CRU observations in Tmax, Tmin Tmp, DTR and Pre over the major BRI regions for the historical period (1986–2005). As shown in the Taylor diagram, the spatial correlation coefficients between the results simulated by each individual model and CRU observations are all greater than 0.8 with a smaller difference range (). In comparison, the largest spatial correlation coefficients between CRU and the four-member MME mean simulation are the Tmax, Tmin and Tmp, which are above 0.99, followed by Pre, whilst the spatial correlation coefficient related to DTR is the smallest. For MAE and RMSE, the maximum value is also the DTR, with difference of more than 1.5°C (). Compared to the individual models, the spatial correlation coefficients associated with the four-member MME mean are higher, and the standard deviation ratio is closer to 1 (). The above results indicate that the spatial structure patterns of the four-member MME mean simulations are more in agreement with those of the CRU-observed Tmax, Tmin, Tmp, DTR and Pre over the major BRI regions for the historical period.
Figure 1. Taylor diagram for the annual mean (a) Tmax, (b) Tmin, (c) Tmp, (d) DTR and (e) Pre over the major BRI regions between the four-member MME mean and CRU observations for the historical period of 1986–2005.The four-member MME mean is calculated from four-member downscaled CMIP5-GCMs.
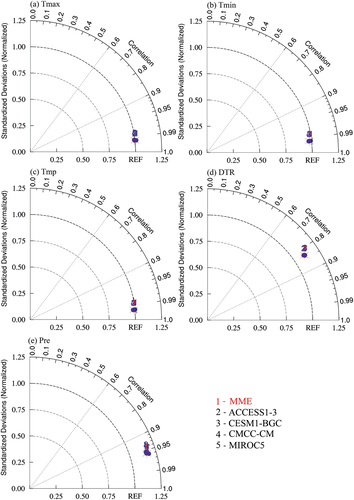
Table 1. The Spatial correlation coefficient, root mean square error (RMSE) and mean absolute error (MAE) for the annual mean daily maximum temperature (Tmax), daily minimum temperature (Tmin), daily average temperature (Tmp), diurnal temperature range (DTR) and Precipitation (Pre) over the major BRI regions between the four-member MME mean and CRU observations for the historical period of 1986–2005 (units: °C for Tmax, Tmin, Tmp and DTR, and mm/d for Pre).
Both the CRU observations and the four-member MME mean simulation for Tmax, Tmin and Tmp results show that, except for the Qinghai-Tibet Plateau, Tmax, Tmin and Tmp generally decrease from low to high latitudes, with the maximum value occurring from the Sahara Desert to East Africa, followed by the southern Arabian Peninsula, South Asia and Southeast Asia. The minimum value is located over Northeast Asia and the Qinghai-Tibet Plateau (). For the 1986–2005 mean DTR in both the observations and the MME mean simulations, the high DTR values mainly appear over the regions from the Sahara Desert through West and Central Asia northwest extending to the eastern part of North Asia (). Compared with the CRU observations, the four-member MME mean simulation usually underestimates the strong centre of Tmax (except for the southern Arabian Peninsula) and overestimates the strong centre of Tmin. For Tmp, the positive deviations are mainly located over Northeast Asia and Central Asia, whilst the negative deviations are focused over the Qinghai-Tibet Plateau (). This is mainly due to the overestimation of Tmax over Northeast Asia and Central Asia () and the underestimation of Tmin over the Qinghai-Tibet Plateau (). For the DTR, the four-member MME mean simulations generally have negative biases over the major BRI regions except for the southern Arabian Peninsula ().
Figure 2. Spatial distribution of Tmax (1st row), Tmin (2nd row), Tmp (3rd row), DTR (4th row) and Pre (5th row) averaged over 1986–2005 for the CRU observations and four-memble MME mean simulations and their differences (MME minus CRU) over the major BRI regions. The units in (a)–(l) and (m)–(o) are °C and mm/d, respectively. The four-member MME mean is calculated from four-member downscaled CMIP5-GCMs. The slash areas are significant at the 95% confidence level.
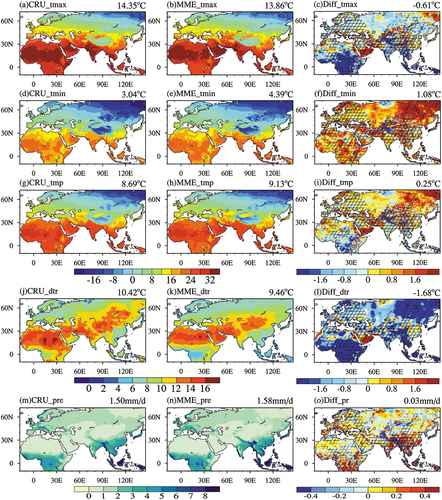
The spatial distribution in 1986–2005 mean Pre of CRU observations over the major BRI regions shows obvious regional differences with the largest values existing over Central Africa, the Malay Islands over Southeast Asia and the southern Qinghai-Tibet Plateau and the lowest values occurring over the arid/semiarid areas of Northern China and Mongolia extending southwest through central and western Asia to the Sahara desert in Africa (). Those spatial distribution characteristics of Pre can be reproduced by the four-member MME mean (). Comparatively speaking, the Pre results simulated by the four-member MME mean overestimate those of CRU observations over most parts of the major BRI regions, especially in areas with large precipitation such as southern China and central Africa ().
We then employed a box-plot to analyse and compare the historical output of the downscaled model data with the CRU observations of temperature and precipitation over the major BRI regions and some subregions including the Indian Peninsula (6°N–35°N, 61°E–97°E), Central Asia (35°N–55°N, 50°E–80°E), West Asia (12°N–32°N, 26°E–61°E) and the Mediterranean (32°N–52°N, −10°W–50°E). As shown in , the simulation values of the four downscaled models are very close to the observed values. Averaged over the major BRI regions, the four-member MME mean Tmax, Tmin and Tmp are 13.86°C, 4.39°C and 9.13°C, respectively, and the CRU-observed values are 14.35°C, 3.04°C and 8.69°C, respectively (). For DTR, the four-member MME mean underestimates the CRU observation with a difference range of approximately 2°C (). For Pre, the CRU observations and four-member MME means are 1.50 mm/d and 1.58 mm/d, respectively (), and the difference is approximately 0.1 mm/d ().
Figure 3. Box-plot diagram for the annual mean (a) Tmax, (b) Tmin, (c) Tmp, (d) DTR and (e) Pre over the major BRI regions, Indian Peninsula (6°N–35°N, 61°E–97°E), Central Asia (35°N–55°N, 50°E–80°E), West Asia (12°N–32°N, 26°E–61°E) and Mediterranean (32°N–52°N, −10°W–50°E) between the four-member MME mean and CRU observations for the historical period of 1986–2005. The four-member MME mean is calculated from four-member downscaled CMIP5-GCMs. The Box-plot diagram from top to bottom is that the upper edge is the maximum value of the variables studied in this paper, the upper edge of the rectangular box is the upper quartile (25% quantile), the horizontal bar inside the rectangular box is the median line, the lower edge of the rectangular box is the lower quartile (75% quantile), and the lower edge is the minimum value of the variables studied in this paper.
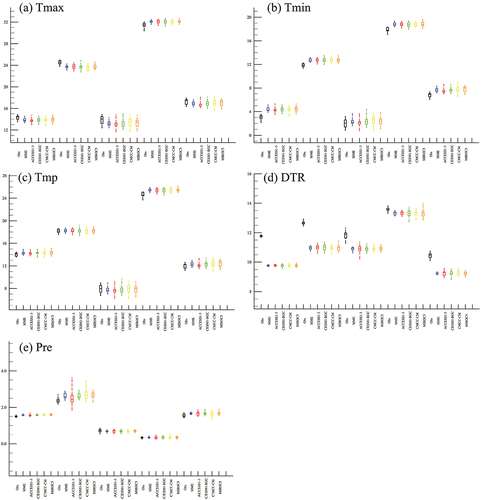
In terms of subregions, there are some differences. For example, the maximum, median, upper quartile, lower quartile and minimum values of Tmax, Tmin and Tmp simulated by individual models are all slightly higher than the observation data over West Africa (). We also found that compared with other subregions, the four downscaled models overestimate Pre over the Indian Peninsula, and the difference range in maximum and minimum values of Pre over the Indian Peninsula is large (). The above results indicate that the four CMIP5-GCMs downscaled model data can generally reproduce the pattern characteristics of temperature and precipitation variations over the major BRI regions for 1986–2005.
5. Characteristics analysis using this dataset
The dataset produced in this study can be used to project detailed characteristics and various impacts of temperature and precipitation changes at local-to-regional scales over the major BRI regions under the temperature rise targets of 1.5°C, 2°C, and 3°C. In this study, we define the first year when the 11-year moving global annual average temperature anomaly relative to the pre-industrial period (1850–1900) is more than 1.5°C, 2°C, and 3°C as the year of each temperature rise target (1.5°C, 2°C, and 3°C). and show the time series of annual global average temperature change from 1850 to 2100 simulated by four downscaled CMIP5–GCMs compared with the pre-industrial period (1850–1900). Result shows that the 1.5°C, 2°C, and 3°C temperature targets occurred before the mid-1930s and around the mid-1950s and 1960s–1970s, respectively.
Figure 4. Time series of (a) the original and (b) 11–year moving global mean annual temperature changes for four downscaled CMIP5-GCMs models and their MME mean under the RCP8.5 emission scenario relative to the pre-industrial period 1850–1900. The horizontal dashed lines represent 1.5°C, 2°C and 3°C, respectively.
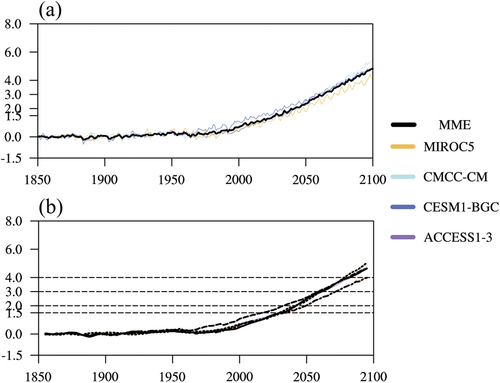
Table 2. The years of 1.5°C, 2°C and 3°C temperature rise targets for individual downscaled CMIP5-GCMs under the RCP8.5 emission scenario.
As in the above analysis for the historical period, the spatial distribution characteristics of Tmax, Tmin, Tmp, DTR and Pre over the major BRI regions in the pre-industrial period are relatively similar to those in the historical period, but there are differences in values (, ). Compared with those of the pre-industrial period, Tmax, Tmin and Tmp over the major BRI regions for the historical period are higher than those of the pre-industrial period, whilst the DTR and Pre are lower than those of the pre-industrial period. Quantitatively, the area-averaged Tmax, Tmin, Tmp, DTR and Pre for the historical period and the pre-industrial period are 18.61°C, 8.68°C, 13.64°C, 9.89°C and 2.01 mm/d (19.19°C, 9.42°C, 14.30°C, 9.73°C and 1.94 mm/d), respectively.
Figure 5. Spatial distribution of four-member MME mean Tmax for (a) the pre-industrial period (1850–1900); (b) the historical period (1986–2005); at global temperature rise targets of (c) 1.5°C, (e) 2°C and (g) 3°C under the RCP8.5 emission scenario and (d, f, h) their differences relative to the historical period over the major BRI regions (Units: ℃). The slash areas are significant at the 95% confidence level.
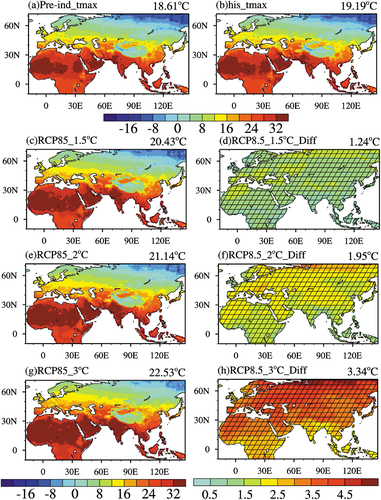
Figure 6. Spatial distribution of four-member MME mean Tmin for (a) the pre-industrial period (1850–1900); (b) the historical period (1986–2005); at global temperature rise targets of (c) 1.5°C, (e) 2°C and (g) 3°C under the RCP8.5 emission scenario and (d, f, h) their differences relative to the historical period over the major BRI regions (Units: °C). The slash areas are significant at the 95% confidence level.
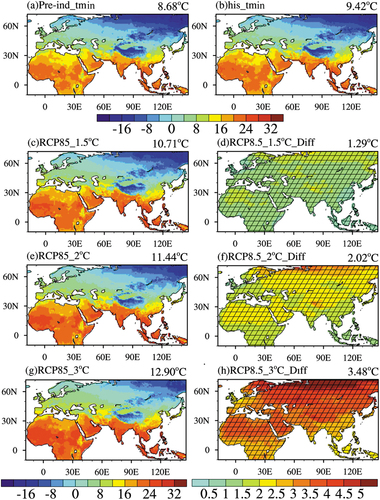
Figure 7. Spatial distribution of four-member MME mean Tmp for (a) the pre-industrial period (1850–1900) and (b) the historical period (1986–2005) at global temperature rise targets of (c) 1.5°C, (e) 2°C and (g) 3°C under the RCP8.5 emission scenario and (d, f, h) their differences relative to the historical period over the major BRI regions (Units: °C). The slash areas are significant at the 95% confidence level.
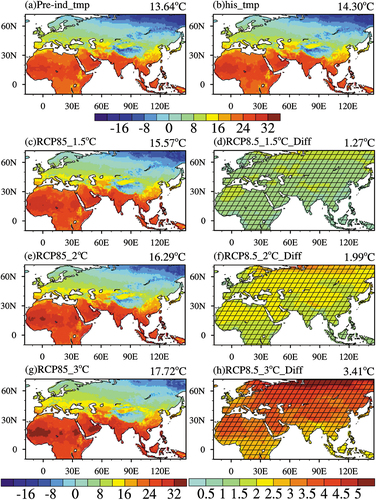
Figure 8. Spatial distribution of four-member MME mean DTR for (a) the pre-industrial period (1850–1900) and (b) the historical period (1986–2005) at global temperature rise targets of (c) 1.5°C, (e) 2°C and (g) 3°C under the RCP8.5 emission scenario and (d, f, h) their differences relative to the historical period over the major BRI regions (Units: °C).The slash areas are significant at the 95% confidence level.
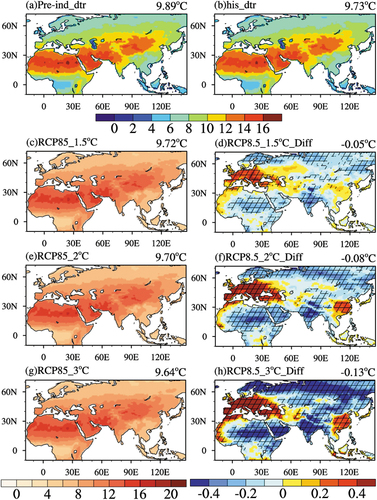
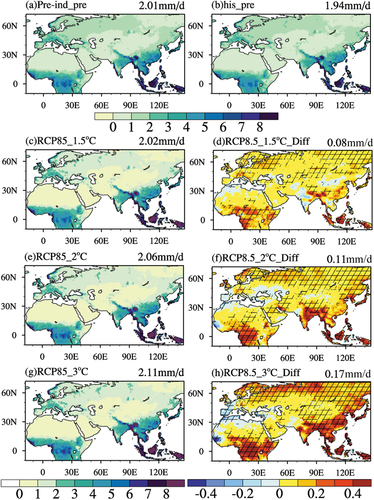
Figure 9. Spatial distribution of four-member MME mean Pre for (a) the pre-industrial period (1850–1900) and (b) the historical period (1986–2005) at global temperature rise targets of (c) 1.5°C, (e) 2°C and (g) 3°C under the RCP8.5 emission scenario and (d, f, h) their differences relative to the historical period over the major BRI regions (Units: mm/d).The slash areas are significant at the 95% confidence level.
In this study, we focus on the temperature and precipitation changes over the major BRI regions under the temperature rise targets of 1.5°C–3°C. The four high-resolution models used in this paper are 3°C higher than the pre-industrial period only under the RCP8.5 scenario. Therefore, we only display and analyse the projection results under the RCP8.5 emission scenario by averaging four-member CMIP5-GCMs for a window of 11 years centred on the year of 1.5°C, 2°C, and 3°C temperature rise targets. As shown in , the spatial patterns of Tmax, Tmin and Tmp over the major BRI regions at the temperature rise targets of 1.5°C, 2°C, 3°C under the RCP8.5 emission scenario bear a similarity with those of the pre-industrial and historical periods, but there are existing differences in amplitude (); ); and )). The four-member MME mean projections show that Tmax, Tmin and Tmp will significantly and consistently increase over the major BRI regions at 1.5°C–3°C temperature rise targets for the RCP8.5 emission scenario with regard to the historical period with the increase at high latitudes generally larger than that at low latitudes. The maximum warming region will exist over the north of the 30°N in Eurasia with a warming range higher than 1°C, especially in Eurasia north of 60°N, where the maximum warming magnitude will be greater than 5°C at the 3°C temperature rise target (). The warming magnitude in Central Africa, South Asia, India and Southeast Asia is slower (; ; and ).
There are asymmetric increases in Tmax and Tmin over different areas of the BRI regions according to four-member MME mean projections. Under the RCP8.5 emission scenario, the significantly increased DTR is expected to appear over Southern and Central Europe, many areas surrounding the Black Sea and the Caspian Sea, and Southeastern China as the warming magnitude in Tmax is more rapid than that in Tmin. In contrast, the larger increase in Tmin than in Tmax over the regions north of 55°N and other areas will result in a significant decrease in DTR (). The DTR changes are projected to be strongest at the temperature target of 3°C for the RCP8.5 emission scenario in the major BRI regions with a maximum amplitude of variation higher than 0.4°C ().
The four-member MME mean projections show that the spatial patterns of Pre over the major BRI regions at the temperature rise targets of 1.5°C, 2°C, and 3°C under the RCP8.5 emission scenario are similar to those of the pre-industrial and historical periods with obvious spatial differences (). Compared with historical periods, the spatial distributions of Pre changes generally present that wet regions will become wetter, whilst dry regions will be much drier over the major BRI regions (). The increase in amplitude of Pre over large precipitation amounts such as the Congo Basin in central Africa, the Malay Islands in Southeast Asia, Southern China and some areas north of 60°N, will be bigger with the enhancement of the temperature rise targets. While Pre over the surrounding Mediterranean and Black Sea regions with less precipitation amounts will decrease, and even Pre will become significantly reduced at the 3°C temperature rise target (). However, there are some differences. For example, Pre over western of China will decrease at the 1.5°C temperature rise target, whilst under the 2°C temperature rise target, the area with negative Pre variations over western of China will become smaller, even will be transformed into a positive increase at the 3°C temperature rise target ().
Averaged over the major BRI regions, Tmax, Tmin and Tmp are projected to significantly increase at 1.5°C–3°C temperature rise targets relative to 1986–2005 for the RCP8.5 emission scenario. The regional average Tmax, Tmin and Tmp incremental values are 1.24°C, 1.29°C and 1.27°C at 1.5°C temperature rise targets (). With the increase of temperature rise targets, the increases in Tmax, Tmin and Tmp are larger with magnitudes of 1.95°C, 2.02°C and 1.99°C at 2°C temperature rise targets (), and 3.34°C, 3.48°C and 3.41°C at 3°C temperature rise targets (). Averaged over the whole major BRI regions, the increases in Tmin are of slightly greater magnitudes than those in Tmax, leading to the decreased DTR (). For Pre variation relative to the historical period, the results show that the regional average Pre in the major BRI regions has an increasing trend: 0.08 mm/d at the 1.5°C temperature rise targets; Pre increases more at the 2°C and 3°C temperature rise targets with increments of 0.11 mm/d and 0.17 mm/d ().
6. Conclusions
Based on the downscaled model data at a high spatial resolution of 0.0449147848° (~5 km), we first employ a Taylor program method to evaluate the performance of the downscaled model data using CRU-observed gridded data for the historical period 1986–2005. The results indicate that the downscaled model data can capture the spatial patterns of CRU-observed Tmax, Tmin, Tmp, DTR and Pre variations well over the major BRI regions for 1986–2005. Furthermore, we develop a temperature and precipitation dataset over the major BRI regions under the RCP8.5 emission scenario at the global temperature rise targets of 1.5°C, 2°C, and 3°C at the fine resolution of 0.0449147848° (~5 km).
The dataset developed in this study will contribute to understanding the detailed characteristics of temperature and precipitation changes over the major BRI regions under different global temperature rise targets particularly those of “the Paris Agreement”. Compared with the historical period, the four-member MME mean projections indicate that Tmax, Tmin and Tmp are expected to significantly increase over the major BRI regions under the RCP8.5 emission scenario at global temperature rise targets of 1.5°C, 2°C, and 3°C with existing differences in magnitude. For Pre, there are obvious regional differences with the significantly decreased Pre mainly located over the Mediterranean and Black Seas, South Asian India and Inner Mongolia of China, whilst the increased Pre is mainly located in the Congo Basin area of Central Africa, the Malay Archipelago of Southeast Asia, Southern China and some areas north of 60°N.
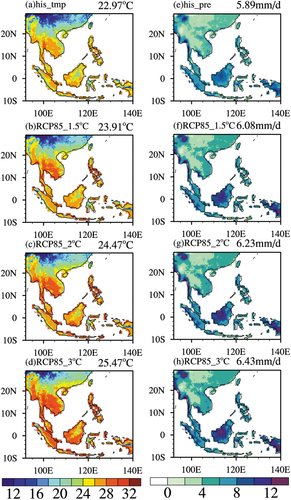
Many climate-related risks are major challenges that the world should jointly address at present and in the future, and seriously threaten the construction of the global ecological environment and sustainable development. Mitigation and adaptation are two important aspects in coping with climate change and promoting the process of climate governance. Mitigation of climate change requires substantially reducing greenhouse gas emissions in the future, whilst adaptation strategies and policies are determined by specific regions and climatic conditions (Fu et al., Citation2003; Xu et al., Citation2013; Intergovernmental Panel on Climate Change (IPCC), Citation2021; Liu et al., Citation2013). Therefore, it is urgent to deepen our understanding of future climate change at local-to-regional scales over the globe. At present, most climate projection studies are carried out with global model with a spatial resolution of 50–250 km. Compared with coarse spatial resolution (Dong et al., Citation2021; Hasson et al., Citation2016), the downscaled model data are generally better capable of capturing the characteristics of temperature and precipitation variations over island regions or complex terrain (for example, indicate that the detailed characteristics of temperature and precipitation changes over the complex terrain of the Pamirs Plateau and Southeast Asia can be displayed by our dataset). Moreover, the dataset developed in this study will contribute to the research of climatic estimation and projection, to provide a fundamental scientific data basis for the formulation of coping with and adapting to climate change and sustainable green development. In the future, we will further downscale the simulation results of more climate models to enrich the dataset developed in this study. This will allow us to more comprehensively analyse and understand climatic change over the major BRI regions under different temperature rise scenarios.
Figure 10. Spatial distribution of Tmp (1st column) and Pre (2nd column) for (a, e) the historical period (1986–2005); at global temperature rise targets of (b, f) 1.5°C, (c, g) 2°C and (d, h) 3°C under the RCP8.5 emission scenario over the Pamir Plateau regions (34°N–45°N, 73°E–80°E). The units in (a)–(d) and (e)–(h) are °C and mm/d, respectively. The four–member MME mean is calculated from four-member downscaled CMIP5-GCMs.
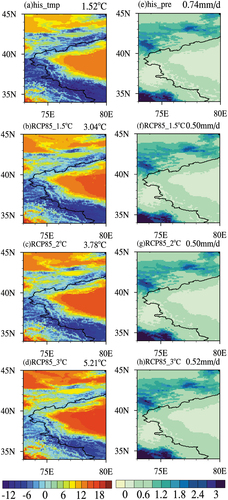
Figure 11. Spatial distribution of Tmp (1st column) and Pre (2nd column) for (a, e) the historical period (1986–2005); at global temperature rise targets of (b, f) 1.5°C, (c, g) 2°C and (d, h) 3°C under the RCP8.5 emission scenario over the Southeast Asia regions (10°S–29°N, 92°E–140°E). The units in (a)–(d) and (e)–(h) are °C and mm/d, respectively. The four-member MME mean is calculated from four-member downscaled CMIP5-GCMs.
Disclosure statement
No potential conflict of interest was reported by the authors.
Data availability statement
The dataset is openly available at https://doi.org/10.57760/sciencedb.01850 in Science Data Bank in NetCDF format.
Additional information
Funding
Notes on contributors

Yuanhuang Zhuang
Yuanhuang Zhuang PhD., is currently working at Tianjin Meteorological Observatory, China. She works on climate change over the major BRI regions with a particular focus on future projections and risk assessment under different temperature scenarios. Furthermore, her research interest also includes hydro-meteorology in the Haihe River Basin.

Jingyong Zhang
Jingyong Zhang received his Ph.D. in Meteorology from the Institute of Atmospheric Physics (IAP), Chinese Academy of Sciences (CAS) in 2005. He conducted research in Seoul National University, Korea as a visiting scientist during 2004–2005 and then worked in the State University of New York at Albany, as a postdoctoral associate (2005–2008) and research scientist (2008–2009). He is currently a professor in IAP/CAS and University of Chinese Academy of Sciences. His research work focuses on coupled human-natural systems, land–atmosphere interactions, seasonal climate prediction, regional climate modeling, and climate change.
References
- Aihaiti, A., Jiang, Z., Zhu, L., Li, W., & You, Q. (2021). Risk changes of compound temperature and precipitation extremes in China under 1.5°C and 2°C global warming. Atmospheric Research, 264, 105838. https://doi.org/10.1016/j.atmosres.2021.105838
- Bao, T., Jia, G., & Xu, X. (2022). Warming enhances dominance of vascular plants over cryptogams across northern wetlands. Global Change Biology, 28(13), 4097–4109. https://doi.org/10.1111/gcb.16182
- Dong, Z., Wang, L., Sun, Y., Hu, T., Limsakul, A., Singhruck, P., & Pimonsree, S. (2021). Heatwaves in Southeast Asia and their changes in a warmer world. Earth’s Future, 9(7), e2021EF001992. https://doi.org/10.1029/2021EF001992
- Dong, T., Wen, Y., J., D., Guo, Y., Chou, J., Yang, M., S., L., Tian, D., & Yan, D. (2018). Future temperature changes over the critical Belt and Road region based on CMIP5 models. Advances in Climate Change Research, 9(1), 57–65.
- Fu, C., Dong, W., Wen, G., & Ye, D. (2003). Regional response and adaption to global change. Acta Meteorologica Sinica, 61(2), 245–250.
- Guo, H. (2018). Steps to the digital silk road. Nature, 554(7690), 25–27. https://doi.org/10.1038/d41586-018-01303-y
- Hargreaves, J. C. (2010). Skill and uncertainty in climate models. Wiley Interdisciplinary Reviews Climate Change, 1(4), 556–564. https://doi.org/10.1002/wcc.58
- Harris, I., Osborn, T. J., Jones, P. D., & Lister, D. H. (2020). Version 4 of the CRU TS monthly high-resolution gridded multivariate climate dataset. Scientific Data, 7(1), 109. https://doi.org/10.1038/s41597-020-0453-3
- Hasson, S., Pascale, S., Lucarini, V., & Böhner, J. (2016). Seasonal cycle of precipitation over major river basins in South and Southeast Asia: A review of the CMIP5 climate models data for present climate and future climate projections. Atmospheric Research, 180, 42–63. https://doi.org/10.1016/j.atmosres.2016.05.008
- Huang, J., Yu, H., Dai, A., Yun, W., & Kang, L. (2017). Drylands face potential threat under 2°C global warming target. Nature Climate Change, 7(6), 417–422. https://doi.org/10.1038/nclimate3275
- Hunter, R. D., & Meentemeyer, R. K. (2005). Climatologically aided mapping of daily precipitation and temperature. Journal of Applied Meteorology, 44(10), 1501–1510. https://doi.org/10.1175/JAM2295.1
- Hu, T., Sun, Y., & Zhang, X. (2017). Temperature and precipitation projection at 1.5 and 2°C increase in global mean temperature. Chinese Science Bulletin, 62(26), 3098–3111. https://doi.org/10.1360/N972016-01234
- Intergovernmental Panel on Climate Change (IPCC). (2018). Special report on global warming of 1.5°C. Cambridge University Press.
- Intergovernmental Panel on Climate Change (IPCC). (2021). Summary for Policymakers In Climate Change 2021: The Physical Science Basis. Contribution of Working Group I to the Sixth Assessment Report of the Intergovernmental Panel on Climate Change. Cambridge University Press. In Press.
- Ji, D., Liu, L., Li, L., Sun, C., Yu, X., Li, R., Zhang, C., & Wang, B. (2019). Uncertainties in th e simulation of 1.5℃ and 2℃ warming threshold crossing time arising from model internal variability based on CMIP5 models. Climate Change Research (In Chinese), 15(4), 343–351.
- Jing, C., Su, B., Chao, Q., Huo, J., Wang, Y., Tao, H., & Jiang, T. (2019). Projection of urbanization and economy in the ‘Belt and Road’ countries based on the shared socioeconomic pathways. China Population, Resources and Environment (In Chinese), 29(1), 21–31.
- Joshi, M., Hawkins, E., Sutton, R., Lowe, J., & Frame, D. (2011). Projections of when temperature change will exceed 2 °C above pre-industrial levels. Nature climate change, 1(8), 407–412. https://doi.org/10.1038/nclimate1261
- Karger, D. N., Conrad, O., Böhner, J., Kawohl, T., Kreft, H., Soria–auza, R. W., Zimmermann, N. E., Linder1, H. P., & Kessler1, M. (2017). Climatologies at high resolution for the earth’s land surface areas. Scientific Data, 4(1), 170122. https://doi.org/10.1038/sdata.2017.122
- Karger, D. N., Schmatz, D. R., Dettling, G., & Zimmermann, N. E. (2020). High–resolution monthly precipitation and temperature time series from 2006 to 2100. Scientific Data, 7(1), 248. https://doi.org/10.1038/s41597-020-00587-y
- King, A., & Karoly, D. (2017). Climate extremes in Europe at 1.5 and 2 degrees of global warming. Environmental Research Letters, 12(11), 114031. https://doi.org/10.1088/1748-9326/aa8e2c
- Lee, S., Wolberg, G., & Shin, S. Y. (1997). Scattered data interpolation with multilevel B-splines. IEEE Transactions on Visualization and Computer Graphics, 3(3), 228–244. https://doi.org/10.1109/2945.620490
- Liu, Y., Geng, X., Hao, Z., & Zheng, J. (2020). Changes in climate extremes in Central Asia under 1.5 and 2°C global warming and their impacts on agricultural productions. Atmosphere, 11(10), 1076. https://doi.org/10.3390/atmos11101076
- Liu, Y., Qian, F., Wang, W., Ge, Q., Ma, C., Zhang, J., & He, X. (2013). Research of adaptive technology framework of addressing climate change. China Population, Resource and Environment, 23(5), 1–6.
- Liu, W., Song, Z., Liu, Z., Wuzhati, Y., Song, T., Niu, F., & Han, M. (2018). Progress in research on the belt and road initiative. Acta Geographica Sinica (In Chinese), 73(4), 620–636.
- Lv, Y., Jiang, R., Wang, T., Y., J., Su, B., Huang, D., J., L., & Tao, H. (2020). Simulation and projection of climate change using CMIP6 Muti-models in the Belt and Road Region. Sciences in Cold and Arid Regions, 12(6), 389–403.
- Mitchell, D., James, R., Forster, P., Betts, R., Shiogama, H., & Allen, M. (2016). Realizing the impacts of a 1.5°C warmer world. Nature Climate Change, 6(8), 735–737. https://doi.org/10.1038/nclimate3055
- Mosier, T. M., Hill, D. F., & Sharp, K. V. (2014). 30–arcsecond monthly climate surfaces with global land coverage. International Journal of Climatology, 34(7), 2175–2188. https://doi.org/10.1002/joc.3829
- Peng, J., Dan, L., Tang, X., & Yang, F. (2022). Trends in carbon sink along the Belt and Road in the future under high emission scenario. Atmospheric and Oceanic Science Letters, 15(3), 100149.
- Qin, P. (2022). More than six billion people encountering more exposure to extremes with 1.5°C and 2.0°C warming. Atmospheric Research, 273, 106165. https://doi.org/10.1016/j.atmosres.2022.106165
- Ren, H., Huang, Y., Chadwick, R., & Deng, Y. (2020). Decomposing East–Asian winter temperature and monsoonal circulation changes using timeslice experiments. Climate Dynamics, 54(3–4), 2297–2315. https://doi.org/10.1007/s00382-019-05114-3
- Schleussner, C., Lissner, T., Fischer, E., Wohland, J., Schaeffer, M., Golly, A., Rogelj, J., Childers, K., Schewe, J., Frieler, K., Mengel, M., Hare, W., & Schaeffer, M. (2016). Differential climate impacts for policy-relevant limits to global warming: The case of 1.5 °C and 2 °C. Earth System Dynamics, 7(2), 327–351. https://doi.org/10.5194/esd-7-327-2016
- Taylor, K. E. (2001). Summarizing multiple aspects of model performance in a single diagram. Journal of Geophysical Research Atmospheres, 106(D7), 7183–7192. https://doi.org/10.1029/2000JD900719
- Tian, D., Dong, W., Zhang, H., Guo, Y., Yang, S., & Dai, T. (2017). Future changes in coverage of 1.5°C and 2°C warming thresholds. Science Bulletin, 62(21), 1455–1463. https://doi.org/10.1016/j.scib.2017.09.023
- Ullah, S., You, Q., Zhang, Y., Bhattic, A., Ullah, W., Hagan, D., Ali, A., Ali, G., Jan, M., Khan, S., & Ali, A. (2020). Evaluation of CMIP5 models and projected changes in temperatures over South Asia under global warming of 1.5°C, 2°C and 3°C. Atmospheric Research, 246, 105122. https://doi.org/10.1016/j.atmosres.2020.105122
- United Nations, Department of Economic and Social Affairs (UN–DESA–PD). (2014). Population division, world urbanization prospects: The 2014 revision, highlights, ST/ESA/SER.A/352.
- Wang, X., Jiang, D., & Lang, X. (2018). Climate change of 4°C global warming above pre-industrial levels. Advances in Atmospheric Sciences, 35(7), 757–770. https://doi.org/10.1007/s00376-018-7160-4
- Wu, S., Liu, L., Liu, Y., Gao, J., Dai, E., & Feng, A. (2018). Geographical patterns and environmental change risks in terrestrial areas of the belt and road. Acta Geographica Sinica (in Chinese), 73(7), 1214–1225.
- Xu, G., H., G., Q., S., Gong, P., Fang, X., Cheng, Q., B., B., Luo, Y., Xu, B., & He, B. (2013). Societal response to challenges of global change and human sustainable development. Chin Sci Bull, 58(21), 2100–2106.
- Xu, Y., Zhou, B., Wu, J., Han, Z., Zhang, Y., & Jia, W. (2017). Asian climate change in response to four global warming targets. Climate Change Research (In Chinese), 13(4), 306–315.
- Yang, Z., & Zhang, J. (2020). Dataset of high temperature extremes over the major land areas of the belt and road for 1979–2018. Big Earth Data, 4(2), 128–141. https://doi.org/10.1080/20964471.2020.1718993
- Zhai, P., Yu, R., Zhou, B., Yang, C., Guo, J., & Lu, Y. (2017). Research progress in impact of 1.5°C global warming on global and regional scales. Climate Change Research (In Chinese), 13(5), 465–472.
- Zhang, W., Zeng, G., Yang, X., & Jiang, Z. (2021). Future changes in extreme high temperature over China at 1.5°C–5°C global warming based on CMIP6 simulations. Advances in Atmospheric Sciences, 38(2), 253–267. https://doi.org/10.1007/s00376-020-0182-8
- Zhang, J., Zhuang, Y., Li, K., Li, C., Gu, B., & Tan, X. (2019). Future projections of weather and climate extremes in major belt and road regions (in Chinese). China Meteorological Press.
- Zhang, J., Zhuang, Y., Li, C., Wang, Y., Gu, B., & Tan, X. (2018). Temporal and spatial analyses of climate change and extreme events over major areas of the belt and road (in Chinese). China Meteorological Press.
- Zhao, T., & Dai, A. (2021). CMIP6 model–projected hydroclimatic and drought changes and their causes in the 21st century. Journal of Climate, 35, 897–921. https://doi.org/10.1175/JCLI-D-21-0442.1
- Zhong, L., Hua, L., & Yan, Z. (2020). Datasets of meteorological drought events and risks for the developing countries in Eurasia. Big Earth Data, 4(2), 191–223. https://doi.org/10.1080/20964471.2019.1710383
- Zhuang, Y., & Zhang, J. (2020). Diurnal asymmetry in future temperature changes over the main belt and road regions. Ecosystem Health and Sustainability, 6(1), 1749530. https://doi.org/10.1080/20964129.2020.1749530
- Zhuang, Y., Zhang, J., & Liang, J. (2021). Projected temperature and precipitation changes over major land regions of the belt and road initiative under the 1.5°C and 2°C climate targets by the CMIP6 multi–model ensemble. Climatic and Environmental Research (In Chinese), 26(4), 374–390.
- Zhuang, Y., Zhang, J., & Wang, L. (2018). Variability of cold season surface air temperature over northeastern China and its linkage with large–scale atmospheric circulations. Theoretical and Applied Climatology, 132(3–4), 1261–1273. https://doi.org/10.1007/s00704-017-2166-x