
 ?Mathematical formulae have been encoded as MathML and are displayed in this HTML version using MathJax in order to improve their display. Uncheck the box to turn MathJax off. This feature requires Javascript. Click on a formula to zoom.
ABSTRACT
Open-access gridded climate products have been suggested as a potential source of data for index insurance design and operation in data-limited regions. However, index insurance requires climate data with long historical records, global geographical coverage and fine spatial resolution at the same time, which is nearly impossible to satisfy, especially with open-access data. In this paper, we spatially downscaled gridded climate data (precipitation, temperature, and soil moisture) in coarse spatial resolution with globally available long-term historical records to finer spatial resolution, using satellite-based data and machine learning algorithms. We then investigated the effect of index insurance contracts based on downscaled climate data for hedging spring wheat yield. This study employed county-level spring wheat yield data between 1982 and 2018 from 56 counties overall in Kazakhstan and Mongolia. The results showed that in the majority of cases (70%), hedging effectiveness of index insurances increases when climate data is spatially downscaled with a machine learning approach. These improvements are statistically significant . Among other climate data, more improvements in hedging effectiveness were observed when the insurance design was based on downscaled temperature and precipitation data. Overall, this study highlights the reasonability and benefits of downscaling climate data for insurance design and operation.
1. Introduction
Extreme weather events are major drivers of volatility of agricultural production (Powell & Reinhard, Citation2016). Drought in particular causes low crop yields that can lead to substantial financial instability (Webber et al., Citation2018). Climate change is expected to increase the frequency and magnitude of extreme weather events, resulting also in increased agricultural production risks (FAO, Citation2015; IPCC, Citation2022). Therefore, coping with droughts is essential for safeguarding against volatility in agricultural production and guaranteeing farmers’ income stability. Activities such as using drought-tolerant crops, crop diversification and rotation, improving irrigation systems, and minimum tillage may mitigate some drought risks. However, they may still fail during wide-spread extreme drought events (Olesen et al., Citation2011). Complementary to these adaptation measures, crop insurances offer the opportunity of risk-sharing and hedging against the risk of yield defaults caused by drought, hail, flood, etc. However, traditional crop insurances are challenged by a high administrative cost of crop loss assessment, adverse selection and moral hazard issues. As an alternative, weather index-based insurance (from here onwards used as “index insurance”), formally known as weather derivatives or parametric insurance (Collier et al., Citation2009; Vedenov & Barnett, Citation2004; Xu et al., Citation2008), has been recognized as a promising financial risk management tool (Collier et al., Citation2009; Giné et al., Citation2010; World Bank, Citation2011). In index insurance, the payout is based on a pre-determined index, and when the value falls below or exceeds a certain threshold value, insurers make a payment without any physical check-up. This approach is intended to reduce administrative costs, reduce the problem of information asymmetry, and promises rapid and efficient determination of payouts (Fisher et al., Citation2019; Greatrex et al., Citation2015; World Bank, Citation2015).
Commonly, index insurances for crops draw on climate data from weather stations for the calculation of precipitation and temperature aggregates. However, the performance of index insurance based on weather stations significantly decreases when the distance between farm and weather station is higher than 20–25 kilometers (Gommes & Göbel, Citation2013; Osgood et al., Citation2007). Thus, index insurances based on data from weather stations are, particularly in developing countries, inhibited by the low density of weather stations. Installment of new weather stations might be a solution, but installing and maintaining a new weather station every 10–20 kilometers would significantly affect the price of the insurance premium and also still not provide the historical data required for index design.
Besides data from weather stations, gridded climate data can also be used for index insurance. Its suitability for index design was confirmed for precipitation data (Black et al., Citation2016; Brahm et al., Citation2019; Osgood et al., Citation2018; Tarnavsky et al., Citation2018), temperature data (Bokusheva et al., Citation2016; Hellmuth et al., Citation2009; Kölle et al., Citation2020; Möllmann et al., Citation2019), soil moisture data (Enenkel et al., Citation2017, Citation2018; Vroege et al., Citation2021) and evapotranspiration indices (Coleman et al., Citation2018; Enenkel et al., Citation2018; Ndegwa et al., Citation2022). In contrast to weather station data, gridded climate data are mostly open source and near-real time. However, the vast majority of gridded climate data with fine resolution is only available for limited land areas or time periods (Eltazarov et al., Citation2021), which significantly limits their applicability for index design. For instance, Climate Hazards Group InfraRed Precipitation with Station Data (CHIRPS) provides a gridded precipitation data since 1982, but it only snaps latitudes between 50° S–50° N (Funk et al., Citation2015). Global Satellite Mapping of Precipitation (GSMaP) and Integrated Multi-satellite Retrievals for GPM (IMERG) cover the whole earth, but have only provided data since 2000 (Mega et al., Citation2019). Tropical Application of Meteorology Using Satellite Data (TAMSAT) and NOAA-based African Rainfall Climatology Version 2 (ARC2) do provide gridded climate data since 1983, but only for the African continent (Maidment et al., Citation2014; Novella & Thiaw, Citation2012). Moreover, Global Land Data Assimilation System (GLDAS) provides gridded temperature data across the globe, but only since 2000 (Rodell et al., Citation2004). Modern-Era Retrospective analysis for Research and Applications version 2 (MERRA-2) provides long-term temperature data since 1980, but the spatial resolution is around 60 km. Furthermore, NASA-USDA Enhanced SMAP Global soil moisture data provides soil moisture information for the whole world at 10-km spatial resolution, but only since 2015.
All in all, there is a need for long historical climate records with fine spatial resolution covering the whole earth in index insurance industry, in order to assess the risk and design well-functioning crop insurances. There is some potential re-analysis based climate data for index insurance design such as ERA5-based climate data from the European Centre for Medium-Range Weather Forecasts (ECMWF) (Hersbach et al., Citation2020). Similarly, satellite base climate data from the European Space Agency (ESA) fed into the Climate Change Initiative (CCI)-based soil moisture data (Dorigo et al., Citation2017) that covers the whole earth and has available data from the 1980s onwards. Nevertheless, the spatial resolution of these datasets is very low, approximately 25–30 kilometers, which significantly decreases the potential of these data sources in their application for index design and implementation. Especially designing index insurance based on such coarse-resolution climate data may lead to an increase of basis risk.
One potential and so far under-researched method to deal with the issue of spatial resolution could be to spatially downscale gridded climate data using statistic methods. A number of studies have investigated and demonstrated the ability and accuracy of downscaling the spatial resolution of gridded climate data sources using regression and machine learning methods (Bai et al., Citation2019; Hu et al., Citation2020; Im et al., Citation2016; Liu et al., Citation2020; Zhang et al., Citation2021; Zhu et al., Citation2017). For instance, Shen and Yong (Citation2021) and Yan et al. (Citation2021) systematically compared the accuracy of various machine learning methods to downscale gridded precipitation data from 10 km to 1 km and were able obtain a significant agreement between downscaled and gauge observations. Meanwhile, Alexakis and Tsanis (Citation2016) and Sharifi et al. (Citation2019) compared multiple linear regression, machine learning models and interpolation techniques to downscale gridded precipitation data, and have concluded that machine learning methods slightly outperform other methods in downscaling precipitation data. Moreover, Bai et al. (Citation2019) and Liu et al. (Citation2020) compared various downscaling methods and various combination of features to find optimal setups to downscale low-resolution (10 km and 35 km) soil moisture data to fine resolution (1 km). dos Santos (Citation2020) and Zhang et al. (Citation2021) compared machine learning and regression models to downscale temperature data and were able to create 1-km long-term daily temperature data.
In general, the existing literature mainly focuses on the accuracy of various downscaling methods and combination of features. Only a few studies have worked on real-world applications of downscaled climate data. For example, López López et al. (Citation2018) used the downscaled gridded precipitation data for river discharge modelling and found a better agreement with ground observations when the model was run using the downscaled precipitation data. Seyyedi et al. (Citation2014) demonstrated improvements in runoff simulations and flood modelling when downscaled precipitation data compared to the coarse precipitation product. Bastola and Misra (Citation2014) studied the applicability of dynamically downscaled precipitation data for hydrological simulations and found that downscaled data was superior to other meteorological datasets. Ha et al. (Citation2013) did an extensive review of downscaling methods of coarse gridded evapotranspiration (ET) data for irrigation scheduling purposes and found that downscaled ET improves the estimation of crop water requirements. Srivastava et al. (Citation2013) found that downscaled soil moisture data improves the estimates of hydrological modelling for a local and regional scale compared to the original coarse resolution. Hrisko et al. (Citation2021) estimated heat storage in urban areas using multispectral satellite data and found that heat storage can be stably downscaled from lower to higher spatial resolution and monitored over time. Meanwhile, the potential of downscaled climate data for index insurance design, as well as the ability to detect shortfalls and their downside risk reduction capacity, has not yet been studied. Even so, downscaling is an effective approach to convert coarse climate data to a finer spatial resolution (Abbaszadeh et al., Citation2019), and downscaled climate data have a better accuracy than the original coarser resolution (Chu et al., Citation2011; Chen et al., Citation2019; Fang et al., Citation2022), which is essential to improve the quality of index insurance and decrease basis risk. Moreover, based on our literature review, there are only a few number of studies (Enenkel et al., Citation2018; Petropoulos & Islam, Citation2017; Vroege et al., Citation2021) that explore the potential of satellite-retrieved soil moisture data for index insurance design and operation.
We provide two key contributions to the literature. Firstly, we systematically evaluate and compare index insurance products with a design based on original coarse resolution and spatially downscaled climate data to reduce farmers’ financial downside risk exposure. We spatially downscale long-term and spatially coarse resolution soil moisture, precipitation and temperature data using machine learning algorithms. Second, for each county we identify the best source of climate data for index insurance products to maximize the climate risk reduction capacity. We test the robustness of our findings in the case of wheat produces in Kazakhstan and Mongolia. Since systematic drought is becoming more frequent and putting agricultural production at risk (de Beurs et al., Citation2018; Haag et al., Citation2019), there is an increased demand for financial instruments and social security mechanisms in these regions (Bobojonov et al., Citation2019).
This paper is structured as follows: In the second chapter, we report on the study area, machine learning methods and features for downscaling the gridded climate data. Moreover, we provide details on index insurance design and measuring the risk reduction capacity of index insurance based on original coarse resolution and downscaled climate data. The third chapter provides the results from our analyses and a comprehensive discussion. Lastly, we wrap up our article with conclusions retrieved from the study.
2. Methods and materials
2.1. Study area and yield data
Wheat is one of the most strategic crops for Kazakhstan and Mongolia, and it is grown mostly on rainfed lands (Fehér et al., Citation2017; Tuvdendorj et al., Citation2019). illustrates our case study consisting of rainfed spring wheat producing counties in Kazakhstan (34 counties) and Mongolia (22 counties). shows the cropping calendar of spring wheat in the study areas. The reasons for using these regions for our analysis are: (1) In these regions, spring wheat is steadily being cultivated, and they are the main wheat producing regions (FAO, Citation2020; Fehér et al., Citation2017); (2) Frequent drought events in the regions have happened in the beginning of the century and in recent years; (3) There is a homogenous climate, crop management and cropping calendar (FAO, Citation2020; Shamanin et al., Citation2016); (4) There is a low density of weather stations (NCEI, Citation2021); (5) In the region, climate-oriented financial instruments and social mechanisms are in high demand (Bobojonov et al., Citation2019); (6) There is a lack of traditional insurance markets due to a large land area and low population density. The study counties are located in a semi-arid climatic region (Trabucco et al., Citation2019).
Figure 1. Location of study regions and counties in Kazakhstan and Mongolia. Each number on the map refers to unique counties. County names are provided in Table A1.
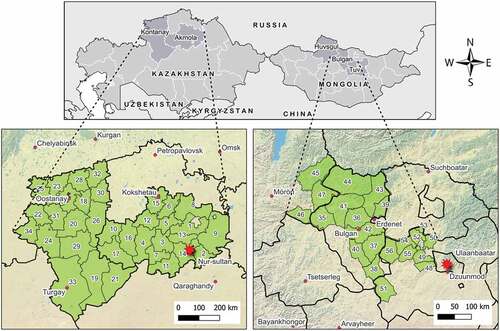
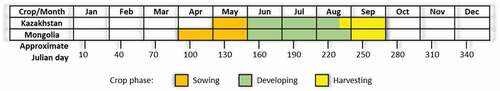
Figure 2. The cropping calendar of spring wheat in Kazakhstan and Mongolia. Source: Authors’ presentation based on data adapted from the FAO (Citation2021, Citation2020) and Shamanin et al. (Citation2016).
It is important to note that in our study we used county-scale spring wheat yield and index data, and we considered counties as farm co-operatives who purchase an insurance contract as a group of farmers. It’s true that the calibration of the index by county-scale yield data might omit farm-level management differences (Finger, Citation2013). However, typically commercial index insurances do not take these management differences into account anyway, in order to avoid moral hazard. Moreover, a recent study by Paliwal and Jain (Citation2020) reported that self-reported farm scale crop yield data is actually inaccurate for calibrating satellite-based remote sensing data. As a consequence, regional aggregation is practiced in particular in areas with relative spatial homogeneity (Kath et al., Citation2019).
In order to check the robustness of the proposed method to design index insurance, this paper uses spring wheat yield data from two countries and in total 56 counties, involving a total of 1337 yield observations (Table A1). Taking into account the technological progress in the wheat production industry between 1982 and 2018, and removing the deterministic trends in historical spring wheat yields, yield observations were de-trended. Failing to do so would have led to an overestimation of yield variability and biased the strike level and risk-reduction potentials for insurance applications. To capture technological trends, country-level yield data between 1991 and 2019 was employed (FAO, Citation2022). Following Finger (Citation2013) and Bucheli et al. (Citation2021), this approach applied an M-estimator to identify linear trends, which was found to equal in Kazakhstan and
in Mongolia. In the next step, county-individual de-trended yields were identified using the following equation by using slope coefficient for each country and
for counties in Kazakhstan and
for counties in Mongolia. Moreover,
refers to county and
indicates time.
2.2. Gridded climate data
After a systematic review of available gridded climate products based on geographical coverage and availability of long-term historical weather records, we selected two gridded climate products and three climate parameters to check the robustness of proposed method: ERA5 as a source of precipitation and temperature data, and ESA-CCI as a source of soil moisture data. ERA5 is the fifth generation ECMWF atmospheric reanalysis of the global climate (Hersbach et al., Citation2020). Reanalysis combines model data with in-situ and satellite observations from across the world into a globally complete and consistent dataset. ERA5 provides large numbers of atmospheric, ocean-wave and land-surface quantities on an hourly, daily and monthly scale with ≈30 km spatial resolution. We only used monthly temperature and precipitation data in this study. ESA-CCI was initiated by ESA to monitor the earth surface variables corresponding to climate change (Enenkel et al., Citation2018). Among others, the program aims at long-time monitoring soil moisture with ≈30 km spatial resolution by integrating and synthesizing both active and passive microwave remote sensing sensors. For our analyses, we used monthly aggregations and volumetric unit () of the version 03.3 of ESA-CCI SM.
As discussed earlier, only very few satellite products spatially cover the whole earth with long historical records at near-real time velocity. For downscaling ERA5 and ESA-CCI data, which is of coarser resolution, this study employs optical bands and indices from the NOAA Climate Data Record (CDR) of the Advanced Very High Resolution Radiometer (AVHRR), and the digital elevation model from The Shuttle Radar Topography Mission (SRTM). NOAA CDR of AVHRR is a dataset that contains gridded surface reflectance, brightness temperatures (BT) and NDVI derived from the AVHRR sensors onboard eight NOAA polar orbiting satellites. The dataset spans from 1981 to the present on a daily temporal scale with ≈5 km spatial resolution.
2.3. Spatial downscaling
In general, there are two types of spatial downscaling techniques, namely dynamic and statistic. Dynamic downscaling employs a regional climate model or a numerical climate model to produce climate parameters in finer spatial resolution by simulating the physical processes of the linked land-atmosphere system (Sharifi et al., Citation2019). The statistic technique, on the other hand, is modelling the statistical relationship between high and low scale covariates. This technique adopts climate parameters based on auxiliary data such as vegetation index, land surface temperature, elevation, soil type, etc. (Sharifi et al., Citation2019).
2.3.1. Random forest method
During the last decade, various statistical downscaling methods have been developed. According to the literature, random forest (RF) is a very suitable machine learning algorithm in terms of accuracy and simplicity for downscaling climate parameters is (Chen et al., Citation2021; Hu et al., Citation2020; Im et al., Citation2016; Liu et al., Citation2018, Citation2020; Yan et al., Citation2021). For instance, Shen and Yong (Citation2021), Yan et al. (Citation2021) and Chen et al. (Citation2021) investigated the accuracy of RF to downscale coarse precipitation data and came into conclusion that RF-based downscaled precipitation have high spatial correspondence with original coarse data. Yang et al. (Citation2017), Bartkowiak et al. (Citation2019) and Tang et al. (Citation2021) studied the applicability of RF to downscale coarse temperature and confirmed the strong potential of RF for producing improved and high spatial resolution temperature data. Hu et al. (Citation2020), Zhang et al. (Citation2022) and Chen et al. (Citation2020) examined the suitability of RF to downscale soil moisture and found that RF-based downscaling is able to capture the variation of soil moisture, even downscale soil moisture have higher correlation with in situ observations than the original coarse data.
RF is a tree-based ensemble method, meaning that data patterns are predicted according to an aggregation of the predictions of several decision trees, with each tree depending on a collection of random variables for classification and regression. Furthermore, the prediction performance is improved by bootstrap aggregation, which reduces the variance of predictions by drawing (with replacement) a fixed number of samples from the training set (Breiman, Citation2001). For the constructing of each tree, features are selected randomly at each decision node. For obtaining the final output, i.e. the classification or prediction output, RF uses a majority vote to aggregate the predictions of each individual tree.
2.3.2. Downscaling process
Initially, all satellite-based datasets used in this study were aggregated to a monthly scaleFootnote1 for comparability. In order to develop an RF-based downscaling model, NOAA and SRTM products with fine spatial resolution were reaggregated to a resolution of ≈30 km. Then, following Chen et al. (Citation2021) and Yan et al. (Citation2021), we used NDVI and BT obtained from NOAA AVHRR as well as elevation, slope and aspect data generated from SRTM to train RF model to estimate ERA5-based precipitation data.
Following Zhang et al. (Citation2021), we utilized the same features to train the RF model to estimate the ERA5-based temperature data.
In addition, NDVI, BT, Red, Near-Infrared (NIR) from NOAA AVHRR as well as elevation and slope from SRTM were employed to train a RF model to estimate the ESA-CCI-based soil moisture data, as also suggested by Hu et al. (Citation2020) and Liu et al. (Citation2018).
In the following, the RF models trained to estimate climate parameters at coarse spatial resolution were applied to feature at 5 km resolution to obtain climate data at fine resolution. The same procedure was repeated for each of June and July months from 1982 to 2015 for study sites in Kazakhstan and from 2000 to 2018 for study sites in Mongolia (reasons for the selection of these months are given in the results section). The training, estimating and downscaling processes were done for each selected month, study site and climate parameter separately, as combining them would assume the same marginal response of features to climate parameters in all months and study sites. A total of 2,264 and 780 samples (all pixels from study sites) were extracted from selected features for each of selected months and climate parameters for sites in Kazakhstan and Mongolia, respectively, and used to develop the RF models. In each RF model, we set the number of trees parameter to 50, as further increase in number of trees did not demonstrate significant improvement in the cross validation accuracy.
2.3.3. Cross validation
In order to assess the performance of the RF models, a cross-validation was conducted at the coarse spatial resolution. The trained RF models obtained from the coarse spatial resolution were used to estimate climate parameters at coarse spatial resolution. To measure the performance of the RF models in estimating the climate parameters for our sample, we used three accuracy measures, namely root mean square error (RMSE), percent bias (PBIAS) and correlation coefficient (CC) (Chen et al., Citation2021).
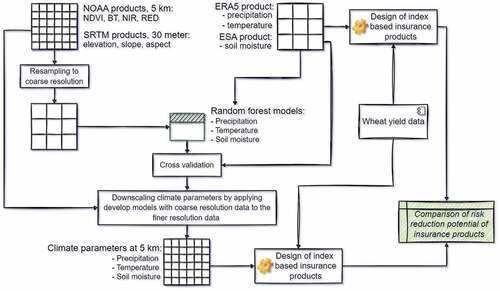
General stages of process flow are illustrated in . All of the gridded climate and satellite-based data processing and machine learning analysis within this study were carried out using the Google Earth Engine platform. For statistical analyses and graph visualization we used R Project (R Development Core Team, Citation2018).
Figure 3. Procedure of relevant data processing and climate data downscaling.
2.4. Design of index insurance products
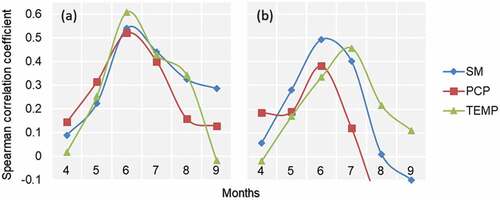
Intra-seasonal climate data typically outperform season-long data in detecting crop yield variation (Ortiz-Bobea et al., Citation2019; Schierhorn et al., Citation2021). The most critical vegetation period is in this case identified along the Spearman correlation coefficientFootnote2 between the respective climate parameter and spring wheat yield for each county (Möllmann et al., Citation2019). Climate parameters are then averaged over this most critical vegetation period.
For building the index, we combined indicators of original coarse resolution and downscaled precipitation, temperature and soil moisture data. Higher precipitation and soil moisture decrease the likeliness of drought events, while high temperature increases drought occurrence.
In the index insurance contract, the payout is determined based on whether the index falls below a certain threshold in county
, which is called strike level
as shown in EquationEquation 8
(8)
(8) . In our study, the strike level is determined by the 30% quantile of the index value (Bokusheva et al., Citation2016; Kölle et al., Citation2020).
where corresponds to the index of climate parameter calculated for time period
for county
. The relevant time periods were identified using time-series correlation analysis for each index and county.
represents the tick size, which determines the indemnity payout per unit of the difference between the strike level
. The tick size
corresponds to the slope coefficient
from the following regression model (8).
where is the wheat yield of the county
,
stands for the index value in period
,
is the slope coefficient of the regression equation,
is a constant, and error term
is the variation of wheat yield that cannot be explained by the index value. Following Bucheli et al. (Citation2021) and Conradt et al. (Citation2015), in order to estimate the
and
we applied quantile regression (QR). QR is typically reducing the basis risk of index insurance as compared to Ordinal Least Squares (OLS), due to its property of estimating coefficients separately for each quantile of the outcome variable rather than at the population mean. Thus, QR minimizes the sum of absolute residuals and is more robust to outliers (Koenker & Bassett, Citation1978). As we are focused on the lower tail of the yield distribution, we chose the 30% quantile, following literature (Bokusheva et al., Citation2016; Bucheli et al., Citation2021; Kölle et al., Citation2020, Citation2021; Möllmann et al., Citation2019). Furthermore, for this study we assume the case of an actuarily fair insurance, where premiums are calculated based on an average of payouts for each county over the time period, excluding surcharges resulting from administrative costs and business margins. Using this simplistic pricing method allows us to identify the risk-reduction potential of insurance products without being inhibited by any mis-specified insurance premiums (Bucheli et al., Citation2021).
2.5. Estimation of the hedging effectiveness
Due to this study’s focus on climate-related production risk, the indemnities and fair premiums are measured in quantity units of wheat yield. To assess the risk reduction potential of each insurance product based on original coarse resolution and downscaled climate parameters, the hedging effectiveness of insurance contracts (the degree to which yield losses are offset by the hedging instrument’s payouts) was estimated by comparing net incomes from uninsured vs. insured yields. According to Bokusheva (Citation2018), we calculated the insured wheat yield as follows:
where refers to the wheat yield for producer i at time t,
is the indemnity payout, and
indicates the fair premium.
Following Vedenov and Barnett (Citation2004), we estimate the hedging effectiveness of insurance contracts by comparing downside risk measure semi-variance (SV) of uninsured yields with the SV of insured yields. The downside risk measure SV is calculated as follows:
where indicates the insured or uninsured wheat yield,
stands for uninsured average wheat of the respective study area, and N denotes the number of yield observations. Consequently, we identify the hedging effectivenessFootnote3 (HE) of the index insurance product by comparing the SV of wheat yield without insurance contract with the SV of wheat yields with insurance contract, as shown in EquationEquation 12
(12)
(12) .
To test for significant differences between the hedging effectiveness of the designed index insurance based on original and downscaled climate data, we applied non-parametric Wilcoxon rank sum tests for improved cases. The Wilcoxon rank sum test examines the null hypothesis that ranks of paired two groups are not significantly different. In contrast to the t test, Wilcoxon rank sum test does not require the data to be normally distributed (Möllmann et al., Citation2019).
All statistical calculations have been developed using the R project (R Development Core Team, Citation2018). In order to support practical applications of this work, the authors developed an R package that includes calculation of hedging effectiveness and other statistical indicators to analyze the performance of index insurance. Details about the R package “climate-insurance” can be found under the following link https://github.com/klimalez/climate-insurance. Additionally, the authors developed an open-source web application based on this R package, the “Climate Risk Insurance Design and Performance Analysis” that helps to test the performance of selected index for insurance design: https://klimalez.org/climate-insurance.
3. Results and discussion
3.1. Climate data validation
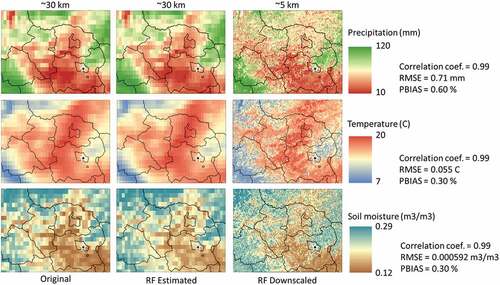
We find that RF estimated climate data at coarse spatial resolution has a good correlation with the climate data in original spatial resolution. The cross validation between original climate data and data estimated by the RF models at original spatial resolution demonstrates a good performance, with a 0.99 correlation coefficient for all climate parameters, which is in line with the performance achieved for instance by Shen and Yong (Citation2021) and Yan et al. (Citation2021). For study sites in Kazakhstan, we find average RSME of 0.59 mm, 0.058°C, 0.0006 m3/m3 and PBIAS 1.19%, 0.25%, 0.27% for precipitation, temperature and soil moisture, respectively, which are in line with the existing literature (Hu et al., Citation2020; Liu et al., Citation2020; Yan et al., Citation2021). Furthermore, we find similar results for study sites in Mongolia with average RMSE 0.72 mm, 0.059°C, 0.0006 m3/m3 and PBIAS 0.71%, 0.31% and 0.27% precipitation, temperature and soil moisture, respectively (see Table A2 and A3 for detailed information).
graphically illustrates differences between original coarse data (column 1 “Original”) and estimated climate data by RF model at original spatial resolution (RF Estimated) along one example region and year, as well as downscaled climate data at ~5 km spatial resolution (RF Downscaled). The column RF estimated shows the initial cross-validation of the performance of the RF models, where climate parameters are estimated at the same spatial resolution as the original coarse climate data sources.
Figure 4. Original coarse resolution, random forest based estimated and downscaled climate parameters, Northern Mongolia in June 2015.
3.2. Assessment of risk reduction potential of index insurance products
Moreover, primary tests of our study showed a slightly better performance of index insurance when they were designed based on monthly scale climate parameters rather than on 10-day scale (average for temperature and soil moisture, cumulative for precipitation). graphs the mean CC between wheat yield and climate parameters for each month by country. For both countries, spring wheat yields showed the highest correlation with all climate parameters in the months of June and July, which was also found by other recent studies (Möllmann et al., Citation2019; Schierhorn et al., Citation2021).
Figure 5. Dynamics of the spearman correlation coefficient between spring wheat yield and monthly scale ERA5-based precipitation and temperature, and ESA-based soil moisture. Counties in (a) Kazakhstan and (b) Mongolia.
summarizes the hedging effectiveness on a national level. For Kazakhstan, the hedging efficiency was 18% for soil moisture, 14% for precipitation, and 24% temperature, based on the original spatial resolution. For the same country, downscaled data increased the hedging efficiency to 18% for precipitation, and 25% for temperature-based index insurance, however, it had no notable effect on the hedging effectiveness of soil moisture. For Mongolia, indices based on original spatial resolution data delivered an average hedging effectiveness of 18% for soil moisture, 12% for precipitation, and 12% for temperature; downscaling increased these values to 22% for soil moisture, 21% for precipitation, and 14% for temperature-based index insurance. In summary, downscaled climate data improved the risk reduction capacity of index insurance for most index products. While hedging efficiency was higher on average in Kazakhstan, the improvements of downscaling were higher in Mongolia. In particular, we observed a noticeable improvement of downscaling for precipitation data. Overall, the hedging efficiency of index insurances based on both original coarse resolution and downscaled data was higher than the results obtained by Möllmann et al. (Citation2019).
Table 1. Mean hedging effectiveness of index insurance products based on original coarse resolution and downscaled climate data.
However, it should be pointed out that the hedging effectiveness fluctuates considerably among indices and regions. In particular the regional variation in the hedging effectiveness of wheat index insurance was already noted in previous studies (Bokusheva et al., Citation2016; Kölle et al., Citation2021). Figure A1 reports on the hedging effectiveness of index insurance based on the original coarse resolution and downscaled soil moisture, precipitation and temperature data across counties.
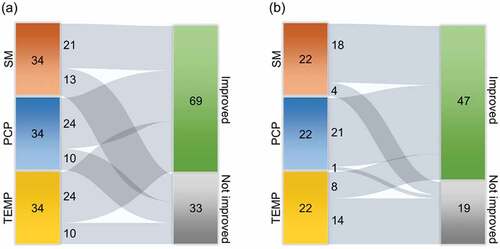
Our previous analysis demonstrated that designing index insurance based on downscaled climate data lowers the basis risk in the majority of our cases. presents the exact number of counties where hedging effectiveness of index insurances were improved and not improved due to use of downscaled climate data. In the case of Kazakhstan, designing an index insurance based on downscaled soil moisture increased hedging effectiveness in 21 counties out of 34, downscaled precipitation improved hedging effectiveness in 24 counties out of 34, and downscaled temperature enhanced hedging effectiveness in 24 counties out of 34. Meanwhile, in Mongolia, index insurance based on downscaled soil moisture improved hedging effectiveness in 18 counties out of 22, downscaled precipitation increased hedging effectiveness in 21 counties out of 22, and downscaled temperature increased hedging effectiveness in 8 counties out of 22.
Figure 6. Change of hedging effectiveness of index insurances after using downscaled climate data, counties in (a) Kazakhstan and (b) Mongolia. Numbers represent the number of counties.
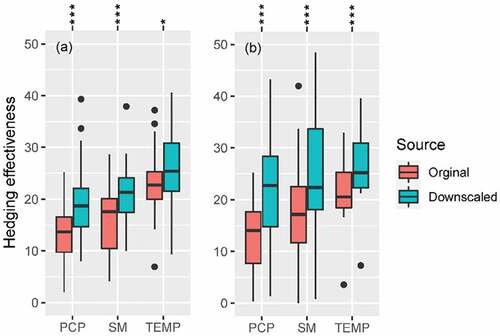
Consequently, Wilcoxon test’s results and boxplot of hedging effectiveness per country and index () also demonstrate that improvements in hedging effectiveness are significant in both countries after using downscaled climate data for index insurance design.
Figure 7. Boxplot and Wilcoxon test results for the hedging effectiveness of index insurance design based on original coarse resolution and downscaled climate data, counties in (a) Kazakhstan and (b) Mongolia. Note: Statistical significance is indicated by the following p-values: *, **
, ***
.
Since a higher hedging effectiveness corresponds to a lower basis risk and a higher potential for risk reduction, it can be concluded that index insurance products based on downscaled climate data have a lower basis risk and a higher potential for risk reduction than the original coarse spatial scale climate data. With reference to these results, the first objective of our study is addressed. With an increasing spatial resolution of gridded climate data using machine learning, the hedging effectiveness of index insurance increases. Earlier similar outcomes were assumed by Möllmann et al. (Citation2019), and similar results were obtained in the study conducted by Kölle et al. (Citation2021), in which hedging effectiveness of index insurance based on medium and high resolution NDVI data were compared. Due to the increased number of pixels per area, a more accurate representation of climate conditions is possible, which is important for lowering the basis risk.
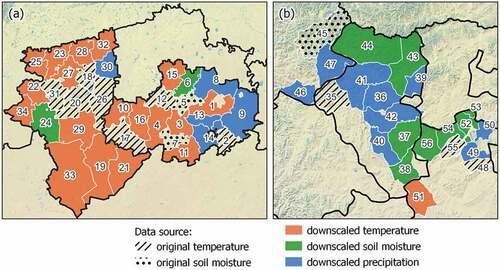
As noted above, the hedging effectiveness of our three indices fluctuated considerably on a county level despite similar environmental conditions, a phenomenon that was also observed by Bucheli et al. (Citation2021). These difference between the areas in term of most suitable index insurance can be due to variety of reasons, such as the type of farming systems, the intensity of crop management, management strategy and soil/seed quality (Kölle et al., Citation2021). demonstrates which source of climate data is the best for index insurance design to mitigate climate risk. According to our results, in Kazakhstan, the majority of counties have a higher hedging effectiveness when the index insurance design is based on downscaled temperature. Moreover, downscaled precipitation and original coarse resolution temperature have the highest hedging effectiveness in some cases, but the rest only in a few cases. In the case of Mongolia, index insurance design based on downscaled precipitation and soil moisture data have the highest risk reduction potential in the majority of counties. The remaining data sources have demonstrated their potential only in rare cases.
Figure 8. The best index insurance for each county according to hedging effectiveness, counties in (a) Kazakhstan and (b) Mongolia.
We see a potential to further refine the procedure of downscaling climate data for increasing hedging efficiency illustrated in this paper. For instance, including land cover/use information into index insurance design can obtain a significantly higher risk reduction capacity. However, the non-existence of long-term and open source land cover/use information limits any potential benefits that might be obtained. Actually, there is a MODIS-based global scale land cover/use product. However, it has provided information since 2002 and has an accuracy of approximately 75–80% (Friedl & Sulla-Menashe, Citation2019). Moreover, our investigations showed that in the MODIS land cover/use product, the croplands identification has yet to be calibrated for Mongolia. Possible solution could be classifying land cover/use based on satellite images or requesting data from state cadaster organizations.
Furthermore, estimating agronomically suitable meteorological drought indices based on downscaled climate data and using them for index insurance design should also be considered for future studies, as they also can substantially improve the risk reduction potential of index insurance. The effectiveness of using meteorological drought indices for index insurance design have already been confirmed by using weather station data by Bobojonov et al. (Citation2014) and Finger (Citation2013). Additionally, for future studies, it would also be interesting to compare the accuracy of index insurance product designs based on downscaled climate data with other climate data in fine spatial resolution with short historical records. Moreover, it would also be interesting to find at which points increases in hedging effectiveness are only marginal and not proportional in terms of findings training datasets.
It should be also noted that for our analysis we used county scale yield data. It would be also very interesting to shift the level of analysis to village or even farm level, as variation and heterogeneity of village-scale climate data increased after spatially downscaling them to finer resolution, according to our results from Local Moran’s IFootnote4 (see Tables A4 and A5). Specifically, village and farm scale yield data could be based on ground level sensors from harvester combines. That would allow us to more deeply study the benefits of machine learning-based downscaling models for index insurance. Furthermore, having information about crop-cultivated areas, crop diversity, crop quality, fertilizers and re-seeding data would be also interesting, in order to inspect these factors on the hedging effectiveness of index insurance.
Moreover, descriptive statistics of variation of validation metrics and Wilcoxon test of county-wise validation metrics between improved and not improved insurance cases did not show significant differences (Figures A2–7 and Tables A6–9). These results indicate that in our case the spatial accuracy of RF models do not influence the variation of improvements of hedging effectiveness. However, we believe having more detailed information about the study area, for instance on variation of topography, crop diversity, land use/cover and portion of croplands in the region would help to understand in more detail why effect of designing index insurance product based on downscaled climate parameters vary.
4. Conclusion
In this paper, we examined and compared the climate risk-reduction potential of index insurance design using machine learning-based spatially downscaled precipitation, temperature and soil moisture data with the original spatial resolution of gridded climate sources. We found that in the vast majority of cases, using downscaled climate data for index insurance design has increased their hedging effectiveness. These improvements are statistically significant for a case study of spring wheat in Kazakhstan and Mongolia. In general, index insurance design based on downscaled temperature in Kazakhstan and downscaled precipitation in Mongolia has the greatest risk-reduction potential. Additionally, our study demonstrates that each area has an individual most suitable underlying source of index to minimize basis risk. There is no single universal source of index that may assist well everywhere. Our results underline that an insurer should test multiple sources of indices during index insurance design and operation.
Moreover, within the framework of our study we have developed two R-packages, namely “climate-insurance” and web platform “Climate Insurance Design and Performance Analysis”, which help to rapidly design index insurance and to analyze the performance of index insurance using multiple statistical indicators. Since a web platform does not require any knowledge of statistics and only requires users to enter the data, we hope that it will ease further dissemination and implementation of index insurance for non-scientists who are interested in the field of index insurance.
Supplemental Material
Download MS Word (2.9 MB)Acknowledgements
The authors wish to thank the team members of the project “Increasing Climate Resilience via Agricultural Insurance – Innovation Transfer for Sustainable Rural Development in Central Asia (KlimALEZ)”, implemented by the Leibniz-Institute for Agricultural Development in Transformation Economies (IAMO).
Disclosure statement
No potential conflict of interest was reported by the author(s).
Data availability statement
The data that support the findings of this study are available from the corresponding author, upon reasonable request. https://authorservices.taylorandfrancis.com/data-sharing/share-your-data/data-availability-statements/
Supplemental data
Supplemental data for this article can be accessed online at https://doi.org/10.1080/20964471.2023.2196830.
Additional information
Funding
Notes on contributors

Sarvarbek Eltazarov
Sarvarbek Eltazarov, Ph.D. candidate, is a junior researcher in the Department of Agricultural Markets, Marketing and World Agricultural Trade at the Leibniz Institute of Agricultural Development in Transition Economies (IAMO). He is conducting a Ph.D. degree in Agricultural Science at the Martin Luther University of Halle-Wittenberg. He received his M.S. degree from Wageningen University and a B.S. degree from Tashkent Institute of Irrigation and Melioration. Previously, he was involved in various research and capacity building activities organized and funded by the EU, GIZ, USAID, IWMI, IFPRI, etc., as a consultant. His current research interests include index/parametric insurance, climate change, risk management and reduction, geographic information systems, remote sensing and machine learning.

Ihtiyor Bobojonov
Ihtiyor Bobojonov, Ph.D., is a senior researcher in the Department of Agricultural Markets, Marketing and World Agricultural Trade at the Leibniz Institute of Agricultural Development in Transition Economies (IAMO). He received his Ph.D. degree in Agricultural Economics from the University of Bonn, his B.S. degree from Urgench State University, his M.S. degree from Tashkent Institute of Irrigation and Melioration. He works on several projects related to the mobilization of agricultural market potentials in the Commonwealth of Independent States countries. He is the coordinator of the International Agricultural Economics Chair at the Tashkent State Agrarian University. His current research interests include risk management, risk reduction, climate change, agricultural insurance and supply chains.

Lena Kuhn
Lena Kuhn, Ph.D., is a senior researcher in the Department of Agricultural Markets, Marketing and World Agricultural Trade at the Leibniz Institute of Agricultural Development in Transition Economies (IAMO). She received her Ph.D. degree in Agricultural Economics from Martin Luther University of Halle-Wittenberg, and her B.S. and M.S. degrees from the Friedrich-Alexander-Universität Erlangen-Nürnberg. She is coordinating the China International Research Group of IAMO and is the coordinator of IAMO’s research focus Livelihoods in rural areas. Her current research interests include sustainable agricultural, rural development, risk management, innovation adoption, digitalization and experimental economics.

Thomas Glauben
Thomas Glauben, Professor, is a director of the Department of Agricultural Markets, Marketing and World Agricultural Trade at the Leibniz Institute of Agricultural Development in Transition Economies (IAMO). He is also a full professor at the Faculty of Natural Science III and a co-opted professor at the Law and Economics Faculty of the Martin Luther University Halle-Wittenberg. From 2013 to 2015 he was a member of the Presidium of the Leibniz Association. Currently he is a member of the boards of various journals and trade publishers. Since 2007 he has been an associate member of the REAP Center of Stanford University, USA. He studied agricultural science at Kiel University, where he obtained his doctorate and habilitated. His current research interests include agricultural and food economics, transition economies and econometric methods.
Notes
1. Earliest tests of our study showed slightly better performance of index insurance when they were designed based on monthly scale weather parameters than 10day scale. Moreover, the gridded weather parameters have a better agreement between in-situ observations when a higher temporal aggregation (monthly, seasonal, etc.) is used (Coleman et al., 2018; Eltazarov et al., 2021; Usman & Nichol, 2020).
2. We employed Spearman’s correlation coefficient as the relationship between weather and crop yield is non-linear (Konduri et al., 2020; Semenov & Porter, 1995).
3. Higher hedging effectiveness corresponds to a lower basis risk and a higher potential for risk reduction.
4. Moran’s I measures the spatial autocorrelation of a dataset that helps to identify how an object is similar to others surrounding it.
References
- Abbaszadeh, P., Moradkhani, H., & Zhan, X. (2019). Downscaling SMAP radiometer soil moisture over the CONUS using an ensemble learning method. Water Resources Research, 55(1), 324–344. https://doi.org/10.1029/2018WR023354
- Alexakis, D. D., & Tsanis, I. K. (2016). Comparison of multiple linear regression and artificial neural network models for downscaling TRMM precipitation products using MODIS data. Environmental Earth Sciences, 75(14), 1077. https://doi.org/10.1007/s12665-016-5883-z
- Bai, J., Cui, Q., Zhang, W., & Meng, L. (2019). An approach for downscaling SMAP soil moisture by combining sentinel-1 SAR and MODIS data. Remote Sensing, 11(23), 2736. https://doi.org/10.3390/rs11232736
- Bartkowiak, P., Castelli, M., & Notarnicola, C. (2019). Downscaling land surface temperature from MODIS dataset with random forest approach over alpine vegetated areas. Remote Sensing, 11(11), 1319. https://doi.org/10.3390/rs11111319
- Bastola, S., & Misra, V. (2014). Evaluation of dynamically downscaled reanalysis precipitation data for hydrological application. Hydrological Processes, 28(4), 1989–2002. https://doi.org/10.1002/hyp.9734
- Black, E., Tarnavsky, E., Maidment, R., Greatrex, H., Mookerjee, A., Quaife, T., & Brown, M. (2016). The use of remotely sensed rainfall for managing drought risk: A case study of weather index insurance in Zambia. Remote Sensing, 8(4), 342. https://doi.org/10.3390/rs8040342
- Bobojonov, I., Aw-Hassan, A., & Sommer, R. (2014). Index-based insurance for climate risk management and rural development in Syria. Climate and Development, 6(2), 166–178. https://doi.org/10.1080/17565529.2013.844676
- Bobojonov, I., Kuhn, L., Moritz, L., Eltazarov, S., & Glauben, T. (2019). Risk management tested in realistic simulation. Improving climate resilience through agricultural insurance - the KlimALEZ project. In IAMO Annual 2019. https://www.iamo.de/fileadmin/user_upload/Bilder_und_Dokumente/05-publikationen/Annuals/iamo2019_en.pdf
- Bokusheva, R. (2018). Using copulas for rating weather index insurance contracts. Journal of Applied Statistics, 45(13), 2328–2356. https://doi.org/10.1080/02664763.2017.1420146
- Bokusheva, R., Kogan, F., Vitkovskaya, I., Conradt, S., & Batyrbayeva, M. (2016). Satellite-based vegetation health indices as a criteria for insuring against drought-related yield losses. Agricultural and Forest Meteorology, 220, 200–206. https://doi.org/10.1016/J.AGRFORMET.2015.12.066
- Brahm, M., Vila, D., Martinez Saenz, S., & Osgood, D. (2019). Can disaster events reporting be used to drive remote sensing applications? A Latin America weather index insurance case study. Meteorological Applications, 26(4), 632–641. https://doi.org/10.1002/met.1790
- Breiman, L. (2001). Random forests. Machine Learning, 45(1), 5–32. https://doi.org/10.1023/A:1010933404324
- Bucheli, J., Dalhaus, T., & Finger, R. (2021). The optimal drought index for designing weather index insurance. European Review of Agricultural Economics, 48(3), 573–597. https://doi.org/10.1093/erae/jbaa014
- Chen, F., Gao, Y., Wang, Y., Qin, F., & Li, X. (2019). Downscaling satellite-derived daily precipitation products with an integrated framework. International Journal of Climatology, 39(3), 1287–1304. https://doi.org/10.1002/joc.5879
- Chen, C., Hu, B., & Li, Y. (2021). Easy-to-use spatial random-forest-based downscaling-calibration method for producing precipitation data with high resolution and high accuracy. Hydrology and Earth System Sciences, 25(11), 5667–5682. https://doi.org/10.5194/hess-25-5667-2021
- Chen, Q., Miao, F., Wang, H., Xu, Z. -X., Tang, Z., Yang, L., & Qi, S. (2020). Downscaling of satellite remote sensing soil moisture products over the Tibetan Plateau based on the random forest algorithm: Preliminary results. Earth and Space Science, 7(6), e2020EA001265. https://doi.org/10.1029/2020EA001265
- Chu, W., Gao, X., Phillips, T. J., & Sorooshian, S. (2011). Consistency of spatial patterns of the daily precipitation field in the western United States and its application to precipitation disaggregation. Geophysical Research Letters, 38(4). https://doi.org/10.1029/2010GL046473
- Coleman, E., Dick, W., Gilliams, S., Piccard, I., Rispoli, F., & Stoppa, A. (2018). Remote sensing for index insurance: Findings and lessons learned for smallholder agriculture (Issue ISBN 9789290727729). (Issue ISBN 9789290727729).
- Collier, B., Skees, J., & Barnett, B. (2009). Weather index insurance and climate change: Opportunities and challenges in lower income countries. Geneva Papers on Risk and Insurance: Issues and Practice, 34(3), 401–424. https://doi.org/10.1057/gpp.2009.11
- Conradt, S., Finger, R., & Bokusheva, R. (2015). Tailored to the extremes: Quantile regression for index-based insurance contract design. Agricultural Economics (United Kingdom), 46(4), 537–547. https://doi.org/10.1111/agec.12180
- de Beurs, K. M., Henebry, G. M., Owsley, B. C., & Sokolik, I. N. (2018). Large scale climate oscillation impacts on temperature, precipitation and land surface phenology in Central Asia. Environmental Research Letters, 13(6), 065018. https://doi.org/10.1088/1748-9326/aac4d0
- Dorigo, W., Wagner, W., Albergel, C., Albrecht, F., Balsamo, G., Brocca, L., Chung, D., Ertl, M., Forkel, M., Gruber, A., Haas, E., Hamer, P. D., Hirschi, M., Ikonen, J., de Jeu, R., Kidd, R., Lahoz, W., Liu, Y. Y., Miralles, D., Lecomte, P. … Lecomte, P. (2017). ESA CCI soil moisture for improved earth system understanding: State-of-the art and future directions. Remote Sensing of Environment, 203, 185–215. https://doi.org/10.1016/j.rse.2017.07.001
- dos Santos, R. S. (2020). Estimating spatio-temporal air temperature in London (UK) using machine learning and earth observation satellite data. International Journal of Applied Earth Observation and Geoinformation, 88, 102066. https://doi.org/10.1016/j.jag.2020.102066
- Eltazarov, S., Bobojonov, I., Kuhn, L., & Glauben, T. (2021). Mapping weather risk – a multi-indicator analysis of satellite-based weather data for agricultural index insurance development in semi-arid and arid zones of Central Asia. Climate Services, 23, 100251. https://doi.org/10.1016/j.cliser.2021.100251
- Enenkel, M., Osgood, D., Anderson, M., Powell, B., McCarty, J., Neigh, C., Carroll, M., Wooten, M., Husak, G., Hain, C., & Brown, M. (2018). Exploiting the convergence of evidence in satellite data for advanced weather index insurance design. Weather, Climate, and Society, 11(1), 65–93. https://doi.org/10.1175/WCAS-D-17-0111.1
- Enenkel, M., Osgood, D., & Powell, B. (2017). The added value of satellite soil moisture for agricultural index insurance. In Remote sensing of hydrometeorological hazards 1st Editio, (pp. 69–83). https://doi.org/10.1201/9781315154947-4
- Fang, B., Lakshmi, V., Cosh, M., Liu, P. -W., Bindlish, R., & Jackson, T. J. (2022). A global 1-km downscaled SMAP soil moisture product based on thermal inertia theory. Vadose Zone Journal, 21(2), e20182. https://doi.org/10.1002/vzj2.20182
- FAO. (2015). Climate change and food security: risks and responses. https://www.fao.org/documents/card/en/c/82129a98-8338-45e5-a2cd-8eda4184550f/
- FAO. (2020). Global Information and Early Warning System (Mongolia). http://www.fao.org/giews/countrybrief/country.jsp?code=MNG&lang=en
- FAO. (2021). Global Information and Early Warning System (Kyrgyzstan). http://www.fao.org/giews/countrybrief/country.jsp?code=KGZ&lang=en
- FAO. (2022). FAOSTAT. https://www.fao.org/faostat/
- Fehér, I., Lehota, J., Lakner, Z., Kende, Z., Bálint, C., Vinogradov, S., & Fieldsend, A. (2017). Kazakhstan’s wheat production potential BT - The Eurasian wheat belt and food security: Global and regional aspects S. Gomez y Paloma, S. Mary, S. Langrell, & P. Ciaian, (Eds.). (pp. 177194). , (Eds.). (pp. 177194). Springer International Publishing. https://doi.org/10.1007/978-3-319-33239-0_11
- Finger, R. (2013). Investigating the performance of different estimation techniques for crop yield data analysis in crop insurance applications. Agricultural Economics, 44(2), 217–230. https://doi.org/10.1111/agec.12005
- Fisher, E., Hellin, J., Greatrex, H., & Jensen, N. (2019). Index insurance and climate risk management: Addressing social equity. Development Policy Review, 37(5), 581–602. https://doi.org/10.1111/dpr.12387
- Friedl, M., & Sulla-Menashe, D. (2019). MCD12Q1 MODIS/Terra+Aqua Land Cover Type Yearly L3 Global 500m SIN Grid V006 [Data set]. NASA EOSDIS Land Processes DAAC. https://doi.org/10.5067/MODIS/MCD12Q1.006
- Funk, C., Peterson, P., Landsfeld, M., Pedreros, D., Verdin, J., Shukla, S., Husak, G., Rowland, J., Harrison, L., Hoell, A., & Michaelsen, J. (2015). The climate hazards infrared precipitation with stations—a new environmental record for monitoring extremes. Scientific Data, 2(1), 150066. https://doi.org/10.1038/sdata.2015.66
- Giné, X., Menand, L., Townsend, R., & Vickery, J. (2010). Microinsurance: A case study of the Indian rainfall index insurance market. In Policy Research Working Papers. The World Bank. https://doi.org/10.1596/1813-9450-5459
- Gommes, R., & Göbel, W.2013 Beyond simple, one-station rainfall indices In EC Joint Research Centre (JRC) (Ed.), The challenges of index-based insurance for food security in developing countries (pp. 205–221). International Research Institute for Climate and Society (IRI, Earth Institute, Columbia University)https://op.europa.eu/en/publication-detail/-/publication/d93219f2-252e-48a9-b5de-38d65de16f9a
- Greatrex, H., Hansen, J., Garvin, S., Diro, R., Blakeley, S., Le Guen, M., Rao, K., & Osgood, D. (2015). Scaling up index insurance for smallholder farmers: Recent evidence and insights. https://hdl.handle.net/10568/53101
- Haag, I., Jones, P. D., & Samimi, C. (2019). Central asia’s changing climate: How temperature and precipitation have changed across time, space, and altitude. Climate, 7(10), 123. https://doi.org/10.3390/cli7100123
- Ha, W., Gowda, P. H., & Howell, T. A. (2013). A review of downscaling methods for remote sensing-based irrigation management: Part I. Irrigation Science, 31(4), 831–850. https://doi.org/10.1007/s00271-012-0331-7
- Hellmuth, M. E., Osgood, D. E., Hess, U., Moorhead, A., & Bhojwani, H. (2009). Index insurance and climate risk: Prospects for development and disaster management. International Research Institute for Climate and Society (IRI).
- Hersbach, H., Bell, B., Berrisford, P., Hirahara, S., Horányi, A., Muñoz-Sabater, J., Nicolas, J., Peubey, C., Radu, R., Schepers, D., Simmons, A., Soci, C., Abdalla, S., Abellan, X., Balsamo, G., Bechtold, P., Biavati, G., Bidlot, J., Bonavita, M., Thépaut, J. -N. … Thépaut, J. -N. (2020). The ERA5 global reanalysis. Quarterly Journal of the Royal Meteorological Society, 146(730), 1999–2049. https://doi.org/10.1002/qj.3803
- Hrisko, J., Ramamurthy, P., & Gonzalez, J. E. (2021). Estimating heat storage in urban areas using multispectral satellite data and machine learning. Remote Sensing of Environment, 252, 112125. https://doi.org/10.1016/j.rse.2020.112125
- Hu, F., Wei, Z., Zhang, W., Dorjee, D., & Meng, L. (2020). A spatial downscaling method for SMAP soil moisture through visible and shortwave-infrared remote sensing data. Journal of Hydrology, 590, 125360. https://doi.org/10.1016/j.jhydrol.2020.125360
- Im, J., Park, S., Rhee, J., Baik, J., & Choi, M. (2016). Downscaling of AMSR-E soil moisture with MODIS products using machine learning approaches. Environmental Earth Sciences, 75(15), 1120. https://doi.org/10.1007/s12665-016-5917-6
- IPCC. (2022). Climate Change 2022: Impacts, Adaptation and Vulnerability. Contribution of Working Group II to the Sixth Assessment Report of the Intergovernmental Panel on Climate Change. https://doi.org/10.1017/9781009325844
- Kath, J., Mushtaq, S., Henry, R., Adeyinka, A. A., Stone, R., Marcussen, T., & Kouadio, L. (2019). Spatial variability in regional scale drought index insurance viability across Australia’s wheat growing regions. Climate Risk Management, 24, 13–29. https://doi.org/10.1016/j.crm.2019.04.002
- Koenker, R., & Bassett, G. (1978). Regression quantiles. Econometrica, 46(1), 33–50. https://doi.org/10.2307/1913643
- Kölle, W., Buchholz, M., & Musshoff, O. (2021). Do high-resolution satellite indices at field level reduce basis risk of satellite-based weather index insurance? Agricultural Finance Review, Ahead-Of-P(ahead-Of-Print), 82(4), 616–640. https://doi.org/10.1108/AFR-12-2020-0177
- Kölle, W., Martínez Salgueiro, A., Buchholz, M., & Musshoff, O. (2020). Can satellite-based weather index insurance improve the hedging of yield risk of perennial non-irrigated olive trees in Spain?*. The Australian Journal of Agricultural and Resource Economics, 65(1), 66–93. n/a(n/a. https://doi.org/10.1111/1467-8489.12403
- Konduri, V. S., Vandal, T. J., Ganguly, S., & Ganguly, A. R. (2020). Data science for weather impacts on crop yield. Frontiers in Sustainable Food Systems, 4. https://doi.org/10.3389/fsufs.2020.00052
- Liu, Y., Jing, W., Wang, Q., & Xia, X. (2020). Generating high-resolution daily soil moisture by using spatial downscaling techniques: A comparison of six machine learning algorithms. Advances in Water Resources, 141, 103601. https://doi.org/10.1016/j.advwatres.2020.103601
- Liu, Y., Yang, Y., Jing, W., & Yue, X. (2018). Comparison of different machine learning approaches for monthly satellite-based soil moisture downscaling over Northeast China. Remote Sensing, 10(2), 31. https://doi.org/10.3390/rs10010031
- López López, P., Immerzeel, W. W., Rodríguez Sandoval, E. A., Sterk, G., & Schellekens, J. (2018). Spatial Downscaling of Satellite-Based Precipitation and Its Impact on Discharge Simulations in the Magdalena River Basin in Colombia. Frontiers in Earth Science, 6, 6. https://doi.org/10.3389/feart.2018.00068
- Maidment, R. I., Grimes, D., Allan, R. P., Tarnavsky, E., Stringer, M., Hewison, T., Roebeling, R., & Black, E. (2014). The 30 year TAMSAT African rainfall climatology and time series (TARCAT) data set. Journal of Geophysical Research Atmospheres, 119(18), ,10,610–619,644. https://doi.org/10.1002/2014JD021927
- Mega, T., Ushio, T., Takahiro, M., Kubota, T., Kachi, M., & Oki, R. (2019). Gauge-adjusted global satellite mapping of precipitation. IEEE Transactions on Geoscience and Remote Sensing, 57(4), 1928–1935. https://doi.org/10.1109/TGRS.2018.2870199
- Möllmann, J., Buchholz, M., & Musshoff, O. (2019). Comparing the hedging effectiveness of weather derivatives based on remotely sensed vegetation health indices and meteorological indices. Weather, Climate, and Society, 11(1), 33–48. https://doi.org/10.1175/WCAS-D-17-0127.1
- NCEI, N. C. for E. I. (2021). Observational data map of daily weather stations networks from around the world. https://gis.ncdc.noaa.gov/maps/ncei/cdo/daily
- Ndegwa, M. K., Shee, A., Turvey, C., & You, L. (2022). Sequenced crop evapotranspiration and water requirement in developing a multitrigger rainfall index insurance and risk-contingent credit. Weather, Climate, and Society, 14(1), 19–38. https://doi.org/10.1175/WCAS-D-21-0071.1
- Novella, N. S., & Thiaw, W. M. (2012). African rainfall climatology version 2 for famine early warning systems. Journal of Applied Meteorology and Climatology, 52(3), 588–606. https://doi.org/10.1175/JAMC-D-11-0238.1
- Olesen, J. E., Trnka, M., Kersebaum, K. C., Skjelvåg, A. O., Seguin, B., Peltonen-Sainio, P., Rossi, F., Kozyra, J., & Micale, F. (2011). Impacts and adaptation of European crop production systems to climate change. European Journal of Agronomy, 34(2), 96–112. https://doi.org/10.1016/j.eja.2010.11.003
- Ortiz-Bobea, A., Wang, H., Carrillo, C. M., & Ault, T. R. (2019). Unpacking the climatic drivers of US agricultural yields. Environmental Research Letters, 14(6), 064003. https://doi.org/10.1088/1748-9326/ab1e75
- Osgood, D., McLaurin, M., Carriquiry, M., Mishra, A., Fiondella, F., Hansen, J. W., Peterson, N., & Ward, M. N. (2007). Designing weather insurance contracts for farmers in Malawi, Tanzania and Kenya: Final report to the commodity risk management group. ARD, World Bank. https://doi.org/10.7916/D88P66DJ
- Osgood, D., Powell, B., Diro, R., Farah, C., Enenkel, M., Brown, M., Husak, G., Blakeley, S., Hoffman, L., & McCarty, J. (2018). Farmer perception, recollection, and remote sensing in weather index insurance: An ethiopia case study. Remote Sensing, 10(12), 1887. https://doi.org/10.3390/rs10121887
- Paliwal, A., & Jain, M. (2020). The Accuracy of Self-Reported Crop Yield Estimates and Their Ability to Train Remote Sensing Algorithms. Frontiers in Sustainable Food Systems, 4, 4. https://doi.org/10.3389/fsufs.2020.00025
- Petropoulos, G. P., & Islam, T. (2017). Remote sensing of hydrometeorological hazards. CRC Press. https://doi.org/10.1201/9781315154947
- Powell, J. P., & Reinhard, S. (2016). Measuring the effects of extreme weather events on yields. Weather and Climate Extremes, 12, 69–79. https://doi.org/10.1016/j.wace.2016.02.003
- R Development Core Team. (2018) . R: A language and environment for statistical computing. R Foundation for Statistical Computing.
- Rodell, M., Houser, P. R., Jambor, U., Gottschalck, J., Mitchell, K., Meng, C. -J., Arsenault, K., Cosgrove, B., Radakovich, J., Bosilovich, M., Entin, J. K., Walker, J. P., Lohmann, D., & Toll, D. (2004). The global land data assimilation system. Bulletin of the American Meteorological Society, 85(3), 381–394. https://doi.org/10.1175/bams-85-3-381
- Schierhorn, F., Hofmann, M., Gagalyuk, T., Ostapchuk, I., & Müller, D. (2021). Machine learning reveals complex effects of climatic means and weather extremes on wheat yields during different plant developmental stages. Climatic Change, 169(3), 39. https://doi.org/10.1007/s10584-021-03272-0
- Semenov, M. A., & Porter, J. R. (1995). Climatic variability and the modelling of crop yields. Agricultural and Forest Meteorology, 73(3), 265–283. https://doi.org/10.1016/0168-1923(94)05078-K
- Seyyedi, H., Anagnostou, E. N., Beighley, E., & McCollum, J. (2014). Satellite-driven downscaling of global reanalysis precipitation products for hydrological applications. Hydrology and Earth System Sciences, 18(12), 5077–5091. https://doi.org/10.5194/hess-18-5077-2014
- Shamanin, V., Salina, E., Wanyera, R., Zelenskiy, Y., Olivera, P., & Morgounov, A. (2016). Genetic diversity of spring wheat from Kazakhstan and Russia for resistance to stem rust Ug99. Euphytica, 212(2), 287–296. https://doi.org/10.1007/s10681-016-1769-0
- Sharifi, E., Saghafian, B., & Steinacker, R. (2019). Downscaling satellite precipitation estimates with multiple linear regression, artificial neural networks, and spline interpolation techniques. Journal of Geophysical Research Atmospheres, 124(2), 789–805. https://doi.org/10.1029/2018JD028795
- Shen, Z., & Yong, B. (2021). Downscaling the GPM-based satellite precipitation retrievals using gradient boosting decision tree approach over China. Journal of Hydrology, 602, 126803. https://doi.org/10.1016/j.jhydrol.2021.126803
- Srivastava, P. K., Han, D., Ramirez, M. R., & Islam, T. (2013). Machine learning techniques for downscaling SMOS satellite soil moisture using MODIS land surface temperature for hydrological application. Water Resources Management, 27(8), 3127–3144. https://doi.org/10.1007/s11269-013-0337-9
- Tang, K., Zhu, H., & Ni, P. (2021). Spatial downscaling of land surface temperature over heterogeneous regions using random forest regression considering spatial features. Remote Sensing, 13(18), 3645. https://doi.org/10.3390/rs13183645
- Tarnavsky, E., Chavez, E., & Boogaard, H. (2018). Agro-meteorological risks to maize production in Tanzania: Sensitivity of an adapted water requirements satisfaction index (WRSI) model to rainfall. International Journal of Applied Earth Observation and Geoinformation, 73, 77–87. https://doi.org/10.1016/J.JAG.2018.04.008
- Trabucco, A., Zomer, R., Perrella, A., Pafundi, P. C., Valente, G., Fontanella, L., Nevola, R., Guerrera, B., Iuliano, N., Imparato, M., Trabucco, A., Sasso, F. C., Morisco, F., Ascione, A., Piai, G., & Adinolfi, L. E. (2019). Global aridity index and potential evapotranspiration (ET0) climate database v2. Digestive Diseases and Sciences, 64(10), 3013–3019. https://doi.org/10.6084/m9.figshare.7504448.v3
- Tuvdendorj, B., Wu, B., Zeng, H., Batdelger, G., & Nanzad, L. (2019). Determination of Appropriate Remote Sensing Indices for Spring Wheat Yield Estimation in Mongolia. Remote Sensing, 11(21). https://doi.org/10.3390/rs11212568
- Usman, M., & Nichol, J. E. (2020). A spatio-temporal analysis of rainfall and drought monitoring in the tharparkar region of Pakistan. Remote Sensing, 12(3), 580. https://doi.org/10.3390/rs12030580
- Vedenov, D. V., & Barnett, B. J. (2004). Efficiency of weather derivatives as primary crop insurance instruments. Journal of Agricultural and Resource Economics, 29(3), 387–403. http://www.jstor.org/stable/40987240
- Vroege, W., Bucheli, J., Dalhaus, T., Hirschi, M., & Finger, R. (2021). Insuring crops from space: The potential of satellite-retrieved soil moisture to reduce farmers’ drought risk exposure. European Review of Agricultural Economics, 48(2), 266–314. https://doi.org/10.1093/erae/jbab010
- Webber, H., Ewert, F., Olesen, J. E., Müller, C., Fronzek, S., Ruane, A. C., Bourgault, M., Martre, P., Ababaei, B., Bindi, M., Ferrise, R., Finger, R., Fodor, N., Gabaldón-Leal, C., Gaiser, T., Jabloun, M., Kersebaum, K. -C., Lizaso, J. I., Lorite, I. J., Wallach, D. … Wallach, D. (2018). Diverging importance of drought stress for maize and winter wheat in Europe. Nature Communications, 9(1), 4249. https://doi.org/10.1038/s41467-018-06525-2
- World Bank. (2011). Weather index insurance for agriculture : Guidance for development practitioners (english) (Vol. 50). World Bank Group. http://documents.worldbank.org/curated/en/590721468155130451/Weather-index-insurance-for-agriculture-guidance-for-development-practitioners
- World Bank. (2015). Achievements in ACP Countries by Global Index Insurance Facility (GIIF) Program : Phase 1 (2010–2015) (English). World Bank Group. http://documents.worldbank.org/curated/en/482761490702615329/Achievements-in-ACP-Countries-by-Global-Index-Insurance-Facility-GIIF-Program-Phase-1-2010-2015
- Xu, W., Odening, M., & Musshoff, O. (2008). Indifference pricing of weather derivatives. American Journal of Agricultural Economics, 90(4), 979–993. https://doi.org/10.1111/j.1467-8276.2008.01154.x
- Yan, X., Chen, H., Tian, B., Sheng, S., Wang, J., & Kim, J. -S. (2021). A Downscaling–merging scheme for improving daily spatial precipitation estimates based on random forest and cokriging. Remote Sensing, 13(11), 2040. https://doi.org/10.3390/rs13112040
- Yang, Y., Cao, C., Pan, X., Li, X., & Zhu, X. (2017). Downscaling land surface temperature in an arid area by using multiple remote sensing indices with random forest regression. Remote Sensing, 9(8), 789. https://doi.org/10.3390/rs9080789
- Zhang, H., Immerzeel, W. W., Zhang, F., de Kok, R. J., Gorrie, S. J., & Ye, M. (2021). Creating 1-km long-term (1980–2014) daily average air temperatures over the Tibetan Plateau by integrating eight types of reanalysis and land data assimilation products downscaled with MODIS-estimated temperature lapse rates based on machine learning. International Journal of Applied Earth Observation and Geoinformation, 97, 102295. https://doi.org/10.1016/j.jag.2021.102295
- Zhang, H., Wang, S., Liu, K., Li, X., Li, Z., Zhang, X., & Liu, B. (2022). Downscaling of AMSR-E soil moisture over North China using random forest regression. ISPRS International Journal of Geo-Information, 11(2), 101. https://doi.org/10.3390/ijgi11020101
- Zhu, W., Lű, A., Jia, S., Yan, J., & Mahmood, R. (2017). Retrievals of all-weather daytime air temperature from MODIS products. Remote Sensing of Environment, 189, 152–163. https://doi.org/10.1016/j.rse.2016.11.011