
 ?Mathematical formulae have been encoded as MathML and are displayed in this HTML version using MathJax in order to improve their display. Uncheck the box to turn MathJax off. This feature requires Javascript. Click on a formula to zoom.
ABSTRACT
Called the “Water Tower”, the water resource in Qinghai Province plays a vital role in the ecological environment of northwestern China. However, significant uncertainty exists regarding its spatial-temporal variations. In this study, the data on the surface water of Qinghai Province from 1986 to 2018 was extracted and a systemic analysis of its spatial-temporal variations and responses to climate change was conducted using the Google Earth Engine (GEE) cloud processing platform. Our findings revealed that the surface water in Qinghai Province was primarily concentrated in the Qaidam Basin, the Hoh Xil Nature Reserve, and Qinghai Lake. The surface water area in Qinghai Province exhibited an overall increasing trend, with the temperature and precipitation being the primary drivers of this expansion. These results provide crucial insights into the variations of surface water variations in Qinghai Province, northwestern China, under the influence of climate change.
1. Introduction
Surface water, which accounts only for a small fraction of the total water resource, plays a major role in the global hydrological cycle (Hall et al., Citation2014; Postel et al., Citation1996). The distribution and persistence of surface water are known to be highly sensitive to both climate change and human activities (Vorosmarty et al., Citation2000, Citation2010). Moreover, changes in surface water can also have feedback effects on the regional environment, ultimately impacting the biological diversity and human society (Bai et al., Citation2011; Tang et al., Citation2022). According to Intergovernmental Panel on Climate Change, the global temperature has been rising since the mid-twentieth century, which led to the expansion and alteration of the surface water, driven by accelerated glacier melting, permafrost degradation, and rising sea levels (Asadi, Citation2005). Hence, surface water plays a critical role in the global hydrological cycle, mitigating and alleviating global climate change.
Qinghai, also known as the China’s “Water Tower”, is the birthplace of many of China’s important rivers (e.g. Yangtze River, Yellow River, and Lancang River) and a significant region for lake distribution area in China (Wilson & Smith, Citation2015). While it is an important reservoir of water resources in China, it also serves as the protective ecological barrier of the northeastern part of the Tibetan Plateau (Han et al., Citation2016). Due to global warming, surface water in Qinghai faces many challenges. For example, due to minimal human activity, most water bodies in Qinghai remain in a natural and primitive state, making them sensitive indicators of climate change (Ke et al., Citation2022). Therefore, it is important to investigate the long-term spatial and temporal changes in Qinghai’s surface water.
Scientists have shown great interest in the province of Qinghai due to its significant impact on the ecosystem and its vulnerable environment (Cai et al., Citation2017; Fang et al., Citation2016; Wan et al., Citation2014; Zhang et al., Citation2013). Since the Citation1960s, the temperature in this region has remarkably increased, with a trend of 0.25°C per decade, surpassing other regions at the same latitude (Ke & Song, Citation2014). Precipitation trends have also shown apparent increases (Yue et al., Citation2013). In recent decades, the warm-humid climate, along with the changing evaporation, glacier retreat, permafrost degradation, and human activities, has significantly affected the surface water bodies in Qinghai (Lei et al., Citation2017; Song et al., Citation2013; Tao et al., Citation2020). On one hand, rising temperatures and increased evaporation have led to the shrinking of surface water. On the other hand, the warm-humid climate trend, along with the glacier and snow melt due to temperature increases, has accelerated the hydrological dynamics, resulting in the expansion of lakes and increased streamflow in Qinghai (Chang et al., Citation2018; Dong et al., Citation2018).
To date, several studies have focused on changes in water bodies and their response to climate factors in Qinghai, but most of them have only examined lakes, neglecting other surface water bodies such as small lakes, rivers, and streams (Liao et al., Citation2013; Zhao et al., Citation2022; Zhu et al., Citation2020). Researchers have also developed various water datasets based on satellite remote sensing data that cover Qinghai, but the spatiotemporal resolution of the existing datasets falls short of the long-term observation needs of water bodies in the region. Some datasets, such as G3WBM and GLOWABO (Verpoorter et al., Citation2014; Yamazaki et al., Citation2015), lack sufficient spatial resolution to accurately depict surface water bodies in Qinghai. Additionally, most 30-m resolution datasets only provide water distribution for a specific year (Gong et al., Citation2013; M. Feng et al., Citation2016), limiting comprehensive annual research on detailed changes in surface water throughout the entirety of Qinghai Province. In summary, there is still a need for comprehensive, long-term research on changes in surface water in the region.
In this study, the surface water in Qinghai Province from 1986 to 2018 was first extracted based on the Landsat image dataset in the GEE platform. The spatial and temporal changes in the surface water in Qinghai Province during the past 33 years were then investigated. Finally, the relationships between the surface water area and climate factors were examined. Our study sheds light on the underlying mechanisms and processes of the hydrological cycle, providing a scientific basis for the development and optimization of climate change adaptation strategies.
2. Materials and methods
2.1. Study area
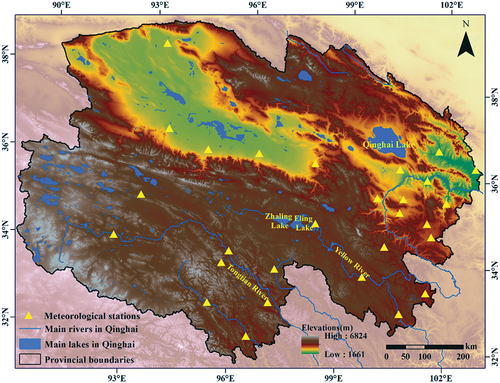
Qinghai Province is located in northwestern China (). It spans an area of over 720 thousand km2 and extends between longitudes 89°35‘E and 103°04‘E and between latitudes 31°39“N and 39°19” N. The elevation ranges from 1,661 m to 6,824 m above the sea level. The main geomorphic type is the platform, accounting for 29.84% of the entire province, followed by high-, middle-, and low-relief mountains, comprising 22.14%, 16.06%, and 13.74%, respectively. The climatic features are characterized by low temperatures, long sunshine durations, and strong solar radiation (L. L. Feng et al., Citation2016). The annual mean temperature ranges from 0 to 3.4°C. Precipitation is concentrated from July to September and the annual rainfall is approximately 273.7–467.8 mm. Sunshine hours amount to around 2,700 hours, and the total annual radiation ranges from 690.8 to 753.6 kJ/cm2, second only to Xizang in China. Due to the influence of topography and climate conditions, the vegetation types in Qinghai mainly consist of alpine grassland, alpine meadow, alpine vegetation, and shrub vegetation.
Figure 1. The geographical situation of Qinghai Province.
2.2. Data collection
GEE, provided by Google, is a cloud platform used for online visualization, analysis, and geospatial processing of vast amounts of global-scale Earth science data, particularly Earth observation satellite data (Gorelick et al., Citation2017). Due to its high computing power, GEE is widely used in many research fields such as forest mapping, disaster monitoring, surface water mapping, and crop yield estimation (Wang et al., Citation2018; Chen et al., Citation2017; Rembold et al., Citation2019; Tian et al., Citation2022).
Using the GEE cloud processing platform, the top-of-atmosphere (TOA) reflectance images from Landsat (Landsat 4/5 TM, Landsat 7 ETM+, and Landsat 8 OLI) for each year within the study period (1986–2018) from March 1st to August 31st were obtained. High-quality Landsat images are critical for accurate generation of surface water maps. Hence, for each image, the quality assurance (BQA) band was applied to remove observations with poor-quality caused by clouds, cloud shadows, snow/ice, and cirrus.
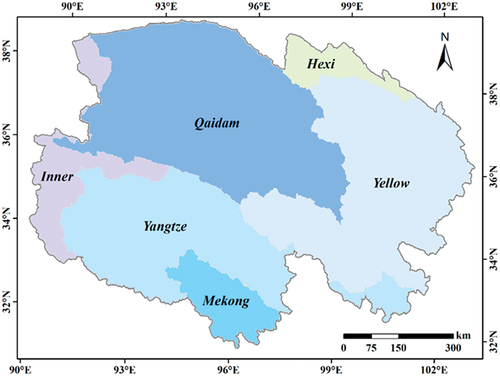
Climate data from 28 meteorological stations located within Qinghai () were acquired from the China Meteorological Data Sharing Service System (http://cdc.cma.gov.cn/index.jsp). Monthly climatic records including maximum, minimum, and mean air temperature, precipitation, mean relative humidity, sunshine hours, and wind speed at a height of 10 m were collected for the years 1986–2018. Considering cloud distribution and snow melting (Smith & Bookhagen, Citation2018), only remote sensing and climatic data from March to August of each year during the study period were selected. The 90-m resolution DEM data from Shuttle Radar Topography Mission Digital Elevation Model (SRTM-DEM) were obtained from the China Geospatial Data Cloud (http://www.gscloud.cn). To divide the province into six zones, the map dataset of river basins over the Tibetan Plateau provided by the National Tibetan Plateau/Third Pole Environment Data Center (Zhang et al., Citation2019) was used ().
Figure 2. Six basin zones in Qinghai Province, including the Hexi, Qaidam, Yellow, Yangtze, and Inner basin.
2.3 Algorithm to generate surface water bodies
The modified normalized difference water index (mNDWI) is one of the most commonly used water indices to detect surface water bodies using the green and short-wave infrared bands of satellite data. This index performs better than the normalized difference water index (NDWI) in separating build-up features from water (Du et al., Citation2014). The presented work employed the mNDWI based on Xu’s study as follows (Xu, Citation2006):
where βgreen and βSWIR represent the reflectance of the green band (Band 3 of Landsat 4/5/7/8 imagery) and the first short-wave infrared band (Band 5 of Landsat 4/5/7 and Band 6 of Landsat−8 imagery), respectively.
The extraction processes of the surface water bodies were conducted using the GEE platform. First, all quality-controlled Landsat 4/5/7/8 images from March 1st to August 31st for each year within the study period (1986–2018) were used to calculate the mNDWI on a pixel-by-pixel basis. The calculated mNDWIs were then sorted in ascending order, and the value at 90% was selected as the current year’s mNDWI. Meanwhile, in order to eliminate the influence of mountain shadow, the terrain slope was also taken into account. Only pixels with an mNDWI greater than 0.05 and a terrain slope less than 5 degrees were classified as water bodies. Finally, the annual total surface water area was calculated as the sum of the areas of all the surface water pixels.
2.4. Estimation of potential evapotranspiration (ET0)
Evapotranspiration is an important part of the hydrological cycle, as it is closely related to surface water balance and energy balance. However, there is a lack of actual evapotranspiration data. As a result, potential evapotranspiration (ET0) is often used to estimate ground evapotranspiration. The FAO Penman – Monteith method, known for producing results closest to actual evapotranspiration, is widely used to calculate ET0. The formula is as follows (Allen et al., Citation1998):
Where, ET0 represents the potential evapotranspiration (mm d−1). Δ is the slope vapor pressure curve (kPa·°C−1). Rn is the net surface radiation (MJ·m−2·d−1). G is the soil heat flux density at soil surface (MJ·m−2·d−1). U2 is the wind speed at 2-m height (m·s−1). γ is the psychrometric constant (kPa·°C−1). T is the mean daily air temperature at 2-m height (°C). es is the saturation vapor pressure (kPa). ea is the actual vapor pressure (kPa) and es – ea is the saturation vapor pressure deficit (kPa).
The collected monthly mean wind speed, maximum and minimum air temperature, relative humidity, and sunshine hours were used to estimate the monthly ET0 from 1986 to 2018. The wind speed at 10-meter height was converted to wind speed at 2-m height. The formula is as follows:
Where, UZ is the wind speed at Z meters above the ground and U2 is the wind speed at 2-m height.
Then, the estimated monthly data from March to August was summed to obtain the cumulative ET0 of each year.
2.5. Climate data for attribution analysis
The Anusplin interpolation method, based on Thin Plate Spline, is utilised for interpolating meteorological elements. Compared to other commonly used interpolation methods, Anusplin interpolation yields higher precision and smoother results, particularly for the regions with complex landforms and limited observation sites, such as Qinghai Province. Firstly, the mean air temperature (T), cumulative precipitation (P) and cumulative ET0 from 1986 to 2018, spanning March to August of each year, were calculated for 28 meteorological stations. Subsequently, the Anusplin software was used to interpolate T, P, and ET0 using elevation as a covariate, thereby generating the spatial distribution of these climate factors. To analyse the response of surface water in Qinghai to climate change, the corresponding T, P, and ET0 values for the entire province were obtained by calculating the average values of interpolated climate variables.
2.6. Accuracy assessment
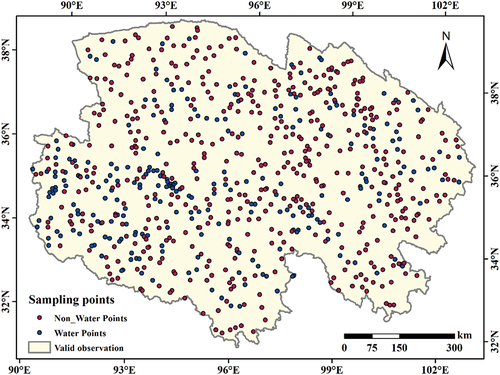
The classification accuracy of the surface water map was validated using high-resolution satellite images from the Google Earth Pro platform. As the extraction methods and image acquisition period were consistent for each year (March to August), the accuracy of the surface water maps for all years was considered comparable. Thus, the accuracy of the Citation2018 surface water map was only verified to represent the results of all years, and the corresponding Google Earth Pro satellite image of that year was used as the reference data. To ensure a balanced sampling of water and non-water points, a visual interpretation method was applied to obtain 250 water points and 1,000 non-water points from their respective areas based on the high-resolution image from Google Earth Pro (). These 750 points were then added to the exacted surface water map to generate a confusion matrix and calculate the users’ accuracy, producers’ accuracy, overall accuracy (OA), and Kappa coefficient.
Figure 3. The distribution of the sampling points.
2.7. Statistical analyses
The Mann-Kendall (MK) Trend Test, a rank-based non-parametric test, was employed to analyse the long-term linear trends of time-series data of the hydro-meteorological data (Huang et al., Citation2020). This test is suitable for non-normally distributed data series and is not affected by outliers. In this study, the MK test was used to estimate the changing trends of T, P, ET0, and surface water areas. A significance level of 5% was chosen, with an absolute value of the Z statistic greater than 1.960 indicating a significant increasing or decreasing trend in the corresponding time-series data.
Additionally, linear regression analysis was preformed to examine the inter-annual variations and changing trends of surface water areas and the three climate factors (T, P, and ET0) during the study period. Moreover, Pearson’s correlation analysis was conducted to assess the relationship between surface water area and climate factors.
3. Results
3.1. Accuracy assessment
The confusion matrix, generated by the extracted surface water map of 2018 with the corresponding high-resolution image from Google Earth Pro, is presented in . Based on the confusion matrix, the producer’s accuracy (omission error) was 79.20%, the user’s accuracy (commission error) was 96.12%, Kappa coefficient was 0.81, and the overall accuracy was 92.00%. These results indicate a relatively high precision of the surface water extraction, which meets the requirements for analysing the temporal and spatial variations of surface water in Qinghai.
Table 1. The confusion matrix and accuracy assessment result for the extracted surface water map of Qinghai Province in 2018 based on the Google Earth Pro high-resolution image.
3.2. Spatial distribution characteristics of surface water in Qinghai Province
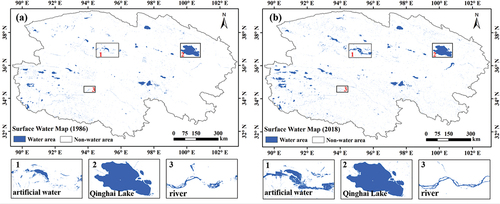
In 1986, the surface water within Qinghai covered an area of approximately 1.57 × 10⁴ km2, accounting for 1.99% of the province’s total area (). By 2018, the surface water area had increased to approximately 2.1 × 10⁴ km2 (2.73%) (). The spatial distribution of the surface water in Qinghai Province exhibited distinct differentiation characteristics in 1986 and 2018. However, in both years, the distribution of surface water was relatively concentrated in certain regions. For instance, two major lake gathering regions were observed in the study area: the Qaidam Basin in northeastern Qinghai and the Hoh Xil Nature Reserve in eastern Qinghai. Qinghai Lake as the largest salt water lake in China, also accounted for a significant proportion of surface water in Qinghai.
Figure 4. Surface water maps of 1986 (a) and 2018 (b).
3.3. Spatial-temporal variations of surface water during 1986–2018
By comparing the surface water map of Qinghai Province in 1986 and 2018, it is evident that significant changes have occurred in the past 33 years (). Specifically, during this period, approximately 3,000 km2 of the area transitioned from water surface to non-water surface, while 13,000 km2 area transformed from non-water surface to water surface. Additionally, an area of 8,200 km2 surface water remained consistently classified as surface water. Generally, the newly formed surface water area was larger than that of the lost area. Spatially, noticeable changes primarily occurred in small water bodies and rivers, indicating their greater instability and vulnerability to external factors such as climate change, tectonic movement, and human disturbance. In contrast, large water bodies, such as Qinghai Lake, showed minimal changes over the past 33 years, suggesting their relative stability and lesser response to environmental changes.
Figure 5. Surface water change from 1986 to 2018 in Qinghai Province. (a) Spatial distribution of surface water change; (b) the inter-annual variations of surface water area; and (c) the Mk test result.
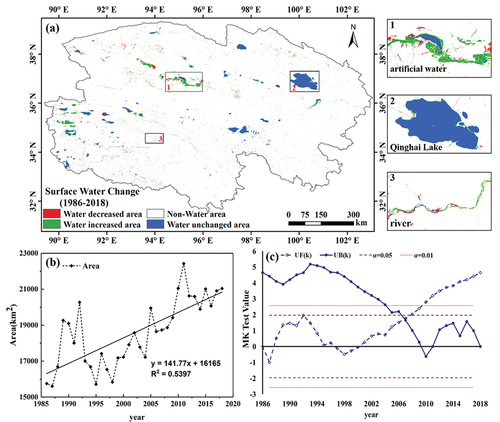
As shown in , the surface water area in Qinghai exhibited a typical increasing trend from 1986 to 2018 (p < 0.01). The surface water area varied from 15,608 km2 to 22,422 km2, which was 16% below and 21% above the average value (18,575 km2), respectively. At the basin scale, the surface water in the Qaidam and Yangzi basins changed significantly, while the surface water in the Yellow River Basin remained relatively stable. Based on the linear regression model, the surface water area in Qinghai increased by 141.77 km2 per year over the past 33 years. Furthermore, the MK trend test results () confirmed a significant increase in the surface water area since 1986. Moreover, the increasing trend passed the 0.01 significance test (α = 0.01) from 1986 to the beginning of the 21st century, indicating a highly significant increase in the surface water area during this period. In addition, an abrupt change in the surface water area occurred around 2007.
3.4. Relationships between climate factors and the surface water area
displays the annual change trends of three climate factors during the study period. From 1986 to 2018, both T and P exhibited a significant increasing trend, with an annual increase of 0.0446°C and 1.9453 mm, respectively. However, ET0 did not show a significant increasing or decreasing trend. The significant increase in T and P suggests a warmer and wetter climate in Qinghai over the past 33 years.
Figure 6. The inter-annual variations of climate factors from 1986 to 2018 in Qinghai Province. (a) Air temperature (T). (b) Precipitation (P). (c) Potential evapotranspiration (ET0).
In the analysis of the response of surface water to climate factors (T, P, and ET0), the correlations were calculated between surface water and climate factors in the entire province and the three typical river basins: Qaidam, Yellow, and Yangtze. As shown in , a significantly positive correlation between temperature, precipitation, and surface water area was observed (p < 0.05) for the entire region. There were slight differences in the response relationship between climate factors and surface water area in different river basins. Both temperature and precipitation had a significant positive correlation with the surface water in the Yangtze and Yellow basins, while the surface water in Qaidam was only significantly positively correlated with precipitation. However, regardless of the basin zones, there was almost no correlation between ET0 and surface water area. Therefore, it can be concluded that the response of surface water to climate change varies among different river basins. However, overall, it can be argued that an increase in temperature and precipitation may lead to an expansion of the surface water, while changes in potential evaporation may have a negligible impact on the surface water area.
Table 2. The correlation between surface water and climate factors in Qinghai Province and 3 river basins.
4. Discussion
4.1. Cross-comparison with JRC yearly history data
The JRC yearly history data provided information on global permanent and seasonal water from 1984 to the present (Pekel et al., Citation2016). However, it lacked partial surface water data for Qinghai during specific time periods (e.g.1986, 1988–1991, and 1997–1998), which ultimately limited the detection of the long-term dynamic changes in surface water in this area. In addition, the JRC dataset failed to capture flood events in China during 1997–1998 (Wang et al., Citation2020). In order to better compare the differences between the extracted results of this study and the JRC data set, the JRC annual historical water map in 2018 was selected to compare with the extracted results of the same year. The comparison focused on four types of water bodies: typical lakes (Qinghai Lake), rivers (a section of the upper reaches of the Yellow River), artificial water bodies, and lake groups ().
Figure 7. A comparison among the surface water exacted in this study, the JRC yearly history data, and remote sensing images of four different type of water bodies. (a1–a3) Typical lake. (b1–b3) Lake groups. (c1–c3) River. (d1–d3) Artificial water bodies.
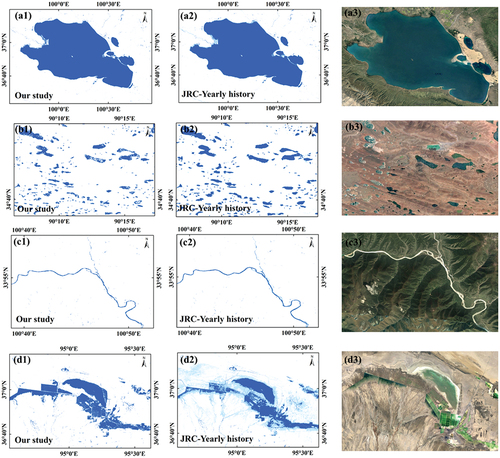
Upon comparison, both the JRC dataset and the water bodies extracted in this study effectively depicted lakes, rivers, artificial water bodies, and lake groups. However, the results extracted in this study had rougher boundaries and more noise compared to the JRC boundary. Furthermore, the annual data of JRC includes permanent water bodies and seasonal water bodies, while the method used in this study could not characterize the seasonal changes in water bodies. Both methods exhibit relatively high accuracy in extracting lakes (e.g. Qinghai Lake and lake groups, (a1–a3 and b1–b3), but struggle to capture the continuous nature of rivers in river extraction ((c1–c3)). The most notable difference between our data and the JRC data was observed around the artificial water body. The JRC dataset identified many pixels around the artificial water body as seasonal rivers, which is not reflected in this study ((d1–d3)).
4.2. Impact of climate change on the surface water area in Qinghai Province
Climate change has had a significant impact on surface water resources in Qinghai (Qiao et al., Citation2019; Wang et al., Citation2020). Previous studies have shown that increased precipitation is the primary driver for the expansion of lakes across the Tibetan Plateau (Li et al., Citation2019; Mao et al., Citation2018; Yang et al., Citation2017). Additionally, there is substantial evidence indicating that glacier melting, inducing by global warming, provides a continuous water supply for surface water expansion (Qiao & Zhu, Citation2019; Yan & Zheng, Citation2015). However, some researchers argue that the contribution rate of glacier meltwater to the expansion of lakes in the Qinghai-Tibet Plateau is limited (Zhang et al., Citation2017; Zhou et al., Citation2019). Although evapotranspiration is believed to have minimal impact on water body changes (Qiao et al., Citation2019), there have been suggestions that a reduction in evapotranspiration can contribute to water body expansion (Lei et al., Citation2014). Nonetheless, Qinghai encompasses a vast area with significant variations in elevation, climate, glacial snow cover, and frozen soil degradation, which may influence surface water changes (Kang et al., Citation2010; Scherler et al., Citation2011; Yang et al., Citation2017). Evidence also indicates that the sensitivity of surface water bodies depends on factors such as geographical location, surface water size, and time period (Dong et al., Citation2018; Yang et al., Citation2017).
4.3. Uncertainties
There are several uncertainties in this study. Firstly, due to the cloud-cover condition over Qinghai Province, remote sensing images of sometimes lacked consecutive observations (Song et al., Citation2014), which reduced the efficiency of data usage and affects the accuracy of water body extraction. Although efforts were made to control the quality of Landsat images during data preprocessing, some noise remained inevitable. Secondly, despite the high precision of the surface water classification in this study, the delineation of water body boundary was not always clear, and there were some leakage for mixed pixels containing water bodies, such as narrow rivers and water boundaries (Li et al., Citation2020). Lastly, seasonal water bodies were not adequately represented. The water bodies in Qinghai Province were by glacier and snow melting, and surface water also exhibited strong seasonal variations within a year (Immerzeel et al., Citation2009; Smith & Bookhagen, Citation2018). The lack of seasonal water information limits our understanding of the relative contribution of atmospheric precipitation, glacier meltwater, lake evaporation, and other components to the water balance at a seasonal scale.
5. Conclusions
This study utilised Landsat 5/7/8 images on the GEE platform to identify and extract surface water bodies in Qinghai Province from 1986 to 2018. The spatial-temporal variations of the surface water in Qinghai and its response to climate factors were systematically analysed. The results demonstrated an increasing trend in the surface water area during the study period, expanding from 15,608 km2 to 22,422 km2. Moreover, the changes primarily occurred in small lakes and rivers, while the large water body remained relatively stable. Temperature and precipitation emerged as the main factors influencing the change in the surface water area, while evapotranspiration had a negligible impact. These findings serve as a vital basis for understanding changes in the ecological environment and provide important insights for accurately predicting future water resources and environmental changes.
Disclosure statement
No potential conflict of interest was reported by the authors.
Data availability statement
The yearly surface water in Qinghai Province from 1986 to 2018 can be downloaded from https://doi.org/10.5281/zenodo.7532934.
Correction Statement
This article has been republished with minor changes. These changes do not impact the academic content of the article.
Additional information
Funding
Notes on contributors
Luying Zhu
Luying Zhu received the bachelor’s degree in geochemistry from China University of Geosciences (Beijing) in 2018. She is currently pursuing a Ph.D. degree in Cartography and Geographic Information System at the Institute of Aerospace Information, Chinese Academy of Sciences. Her current research interest is ecological remote sensing.
Ni Huang
Ni Huang received the Ph.D. degree in GIS and Remote Sensing from the Institute of Remote Sensing Applications, Chinese Academy of Sciences in 2012. She is a research scientist in the Aerospace Information Research Institute, Chinese Academy of Sciences. Her research focuses on estimating carbon cycle parameters based on remote sensing data.
References
- Allen, R. G., Pereira, L. S., Raes, D., & Smith, M. (1998). Crop evapotranspiration-Guidelines for computing crop water requirements-FAO Irrigation and drainage paper 56. FAO Rome, 300(9).
- Asadi, M. E. (2005). Effects of global climate change on water resources. Journal of Agricultural Meteorology, 60(5), 637–640. https://doi.org/10.2480/agrmet.637
- Bai, J., Chen, X., Li, J., Yang, L., & Fang, H. (2011). Changes in the area of inland lakes in arid regions of central Asia during the past 30 years. Environmental Monitoring and Assessment, 178(1–4), 247–256. https://doi.org/10.1007/s10661-010-1686-y
- Cai, Y., Ke, C. Q., & Duan, Z. (2017). Monitoring ice variations in Qinghai Lake from 1979 to 2016 using passive microwave remote sensing data. Science of the Total Environment, 607, 120–131. https://doi.org/10.1016/j.scitotenv.2017.07.027
- Chang, B., He, K. N., Li, R. J., Wang, H., & Wen, J. (2018). Trends, abrupt changes, and periodicity of streamflow in Qinghai Province, the Northeastern Tibetan Plateau, China. Polish Journal of Environmental Studies, 27(2), 545–555. https://doi.org/10.15244/pjoes/76037
- Chen, B. Q., Xiao, X. M., Li, X. P., Pan, L. H., Doughty, R., Ma, J., Dong, J., Qin, Y., Zhao, B., Wu, Z., Sun, R., Lan, G., Xie, G., Clinton, N., & Giri, C. (2017). A mangrove forest map of China in 2015: Analysis of time series Landsat 7/8 and Sentinel-1A imagery in Google Earth Engine cloud computing platform. ISPRS Journal of Photogrammetry and Remote Sensing, 131, 104–120. https://doi.org/10.1016/j.isprsjprs.2017.07.011
- Dong, S. Y., Peng, F., You, Q. G., Guo, J., & Xue, X. (2018). Lake dynamics and its relationship to climate change on the Tibetan Plateau over the last four decades. Regional Environmental Change, 18(2), 477–487. https://doi.org/10.1007/s10113-017-1211-8
- Du, Z. Q., Li, W. B., Zhou, D. B., Tian, L. Q., Ling, F., Wang, H. L., Gui, Y., & Sun, B. (2014). Analysis of Landsat-8 OLI imagery for land surface water mapping. Remote Sensing Letters, 5(7), 672–681. https://doi.org/10.1080/2150704x.2014.960606
- Fang, Y., Cheng, W. M., Zhang, Y. C., Wang, N., Zhao, S. M., Zhou, C. H., Chen, X., & Bao, A. (2016). Changes in inland lakes on the Tibetan Plateau over the past 40 years. Journal of Geographical Sciences, 26(4), 415–438. https://doi.org/10.1007/s11442-016-1277-0
- Feng, L. L., Jia, Z. Q., Li, Q. X., & Xu, K. (2016). Fractional vegetation cover estimation based on MODIS satellite data from 2000 to 2013: A case study of Qinghai Province. Journal of the Indian Society of Remote Sensing, 44(2), 269–275. https://doi.org/10.1007/s12524-015-0492-y
- Feng, M., Sexton, J. O., Channan, S., & Townshend, J. R. (2016). A global, high-resolution (30-m) inland water body dataset for 2000: First results of a topographic-spectral classification algorithm. International Journal of Digital Earth, 9(2), 113–133. https://doi.org/10.1080/17538947.2015.1026420
- Gong, P., Wang, J., Yu, L., Zhao, Y. C., Zhao, Y. Y., Liang, L., Niu, Z., Huang, X., Fu, H., Liu, S., Li, C., Li, X., Fu, W., Liu, C., Xu, Y., Wang, X., Cheng, Q., Hu, L. … Chen, J. (2013). Finer resolution observation and monitoring of global land cover: First mapping results with Landsat TM and ETM+ data. International Journal of Remote Sensing, 34(7), 2607–2654. https://doi.org/10.1080/01431161.2012.748992
- Gorelick, N., Hancher, M., Dixon, M., Ilyushchenko, S., Thau, D., & Moore, R. (2017). Google Earth Engine: Planetary-scale geospatial analysis for everyone. Remote Sensing of Environment, 202, 18–27. https://doi.org/10.1016/j.rse.2017.06.031
- Hall, J. W., Grey, D., Garrick, D., Fung, F., Brown, C., Dadson, S. J., & Sadoff, C. W. (2014). Coping with the curse of freshwater variability. Science, 346(6208), 429–430. https://doi.org/10.1126/science.1257890
- Han, Z., Song, W., & Deng, X. (2016). Responses of ecosystem service to land use change in Qinghai Province. Energies, 9(4), 303. https://doi.org/10.3390/en9040303
- Huang, N., Wang, L., Song, X. P., Black, T. A., Jassal, R. S., Myneni, R. B., Wu, C., Wang, L., Song, W., Ji, D., Yu, S., & Niu, Z. (2020). Spatial and temporal variations in global soil respiration and their relationships with climate and land cover. Science Advances, 6(41). https://doi.org/10.1126/sciadv.abb8508
- Immerzeel, W. W., Droogers, P., Jong, S., & Bierkens, M. (2009). Large-scale monitoring of snow cover and runoff simulation in Himalayan river basins using remote sensing. Remote Sensing of Environment, 113(1), 40–49. https://doi.org/10.1016/j.rse.2008.08.010
- Kang, S., Xu, Y., You, Q., Flügel, W.-A., Pepin, N., & Yao, T. (2010). Review of climate and cryospheric change in the Tibetan Plateau. Environmental Research Letters, 5(1), 15101–15101. https://doi.org/10.1088/1748-9326/5/1/015101
- Ke, L. H., & Song, C. Q. (2014). Remotely sensed surface temperature variation of an inland saline lake over the central Qinghai-Tibet Plateau. ISPRS Journal of Photogrammetry and Remote Sensing, 98, 157–167. https://doi.org/10.1016/j.isprsjprs.2014.09.007
- Ke, L. H., Song, C. Q., Wang, J. D., Sheng, Y. W., Ding, X. L., Yong, B., Ma, R. H., Liu, K., Zhan, P. F., & Luo, S. X. (2022). Constraining the contribution of glacier mass balance to the Tibetan lake growth in the early 21st century. Remote Sensing of Environment, 268. https://doi.org/10.1016/j.rse.2021.112779
- Lei, Y. B., Yang, K., Wang, B., Sheng, Y. W., Bird, B. W., Zhang, G. Q., & Tian, L. (2014). Response of inland lake dynamics over the Tibetan Plateau to climate change. Climatic Change, 125(2), 281–290. https://doi.org/10.1007/s10584-014-1175-3
- Lei, Y. B., Yao, T. D., Yang, K., Sheng, Y. W., Kleinherenbrink, M., Yi, S., Bird, B. W., Zhang, X., Zhu, L., & Zhang, G. (2017). Lake seasonality across the Tibetan Plateau and their varying relationship with regional mass changes and local hydrology. Geophysical Research Letters, 44(2), 892–900. https://doi.org/10.1002/2016gl072062
- Liao, J. J., Shen, G. Z., & Li, Y. K. (2013). Lake variations in response to climate change in the Tibetan Plateau in the past 40 years. International Journal of Digital Earth, 6(6), 534–549. https://doi.org/10.1080/17538947.2012.656290
- Li, H. Y., Mao, D. H., Li, X. Y., Wang, Z. M., & Wang, C. Z. (2019). Monitoring 40-year lake area changes of the qaidam basin, Tibetan plateau, using Landsat time series. Remote Sensing, 11(3), 343. https://doi.org/10.3390/rs11030343
- Li, D., Wu, B., Chen, B., Qin, C., Wang, Y., Zhang, Y., & Xue, Y. (2020). Open-surface river extraction based on sentinel-2 MSI imagery and DEM Data: Case study of the upper yellow river. Remote Sensing, 12(17), 2737. https://doi.org/10.3390/rs12172737
- Mao, D. H., Wang, Z. M., Yang, H., Li, H. Y., Thompson, J. R., Li, L., Song, K., Chen, B., Gao, H., & Wu, J. (2018). Impacts of climate change on Tibetan lakes: patterns and processes. Remote Sensing, 10(3), 358. https://doi.org/10.3390/rs10030358
- Pekel, J. F., Cottam, A., Gorelick, N., & Belward, A. S. (2016). High-resolution mapping of global surface water and its long-term changes. Nature, 540(7633), 418±. https://doi.org/10.1038/nature20584
- Postel, S. L., Daily, G. C., & Ehrlich, P. R. (1996). Human appropriation of renewable fresh water. Science, 271(5250), 785–788. https://doi.org/10.1126/science.271.5250.785
- Qiao, B. J., & Zhu, L. P. (2019). Difference and cause analysis of water storage changes for glacier-fed and non-glacier-fed lakes on the Tibetan Plateau. Science of the Total Environment, 693, 693. https://doi.org/10.1016/j.scitotenv.2019.07.205
- Qiao, B., Zhu, L., & Yang, R. (2019). Temporal-spatial differences in lake water storage changes and their links to climate change throughout the Tibetan Plateau. Remote Sensing of Environment, 222, 232–243. https://doi.org/10.1016/j.rse.2018.12.037
- Rembold, F., Meroni, M., Urbano, F., Csak, G., Kerdiles, H., Perez-Hoyos, A., Lemoine, G., Leo, O., & Negre, T. (2019). ASAP: A new global early warning system to detect anomaly hot spots of agricultural production for food security analysis. Agricultural Systems, 168, 247–257. https://doi.org/10.1016/j.agsy.2018.07.002
- Scherler, D., Bookhagen, B., & Strecker, M. R. (2011). Spatially variable response of Himalayan glaciers to climate change affected by debris cover. Nature Geoscience, 4(3), 156–159. https://doi.org/10.1038/ngeo1068
- Smith, T., & Bookhagen, B. (2018). Changes in seasonal snow water equivalent distribution in High Mountain Asia (1987 to 2009). Science Advances, 4(1). https://doi.org/10.1126/sciadv.1701550
- Song, C. Q., Huang, B., & Ke, L. H. (2013). Modeling and analysis of lake water storage changes on the Tibetan Plateau using multi-mission satellite data. Remote Sensing of Environment, 135, 25–35. https://doi.org/10.1016/j.rse.2013.03.013
- Song, C. Q., Huang, B., Ke, L. H., & Richards, K. S. (2014). Remote sensing of alpine lake water environment changes on the Tibetan Plateau and surroundings: A review. ISPRS Journal of Photogrammetry and Remote Sensing, 92, 26–37. https://doi.org/10.1016/j.isprsjprs.2014.03.001
- Tang, F., Wang, L., Guo, Y. Q., Fu, M. C., Huang, N., Duan, W. S., Luo, M., Zhang, J., Li, W., & Song, W. (2022). Spatio-temporal variation and coupling coordination relationship between urbanisation and habitat quality in the Grand Canal, China. Land Use Policy, 117, 117. https://doi.org/10.1016/j.landusepol.2022.106119
- Tao, S. L., Fang, J. Y., Ma, S. H., Cai, Q., Xiong, X. Y., Tian, D., Zhao, X., Fang, L., Zhang, H., Zhu, J., & Zhao, S. (2020). Changes in China’s lakes: Climate and human impacts. National Science Review, 7(1), 132–140. https://doi.org/10.1093/nsr/nwz103
- Tian, H. F., Chen, T., Li, Q. Z., Mei, Q. Y., Wang, S., Yang, M. D., Wang, Y., & Qin, Y. (2022). A novel spectral index for automatic canola mapping by using sentinel-2 imagery. Remote Sensing, 14(5), 1113. https://doi.org/10.3390/rs14051113
- Verpoorter, C., Kutser, T., Seekell, D. A., & Tranvik, L. J. (2014). A global inventory of lakes based on high-resolution satellite imagery. Geophysical Research Letters, 41(18), 6396–6402. https://doi.org/10.1002/2014gl060641
- Vorosmarty, C. J., Green, P., Salisbury, J., & Lammers, R. B. (2000). Global water resources: Vulnerability from climate change and population growth. Science, 289(5477), 284–288. https://doi.org/10.1126/science.289.5477.284
- Vorosmarty, C. J., McIntyre, P. B., Gessner, M. O., Dudgeon, D., Prusevich, A., Green, P., Glidden, S., Bunn, S. E., Sullivan, C. A., Liermann, C. R., & Davies, P. M. (2010). Global threats to human water security and river biodiversity. Nature, 467(7315), 555–561. https://doi.org/10.1038/nature09440
- Wang, C., Jia, M. M., Chen, N. C., & Wang, W. (2018). Long-term surface water dynamics analysis based on Landsat imagery and the google earth engine platform: A case study in the middle Yangtze River Basin. Remote Sensing, 10(10), 1635. https://doi.org/10.3390/rs10101635
- Wang, X. X., Xiao, X. M., Zou, Z. H., Dong, J. W., Qin, Y. W., Doughty, R. B., Menarguez, M. A., Chen, B., Wang, J., Ye, H., Ma, J., Zhong, Q., Zhao, B., & Li, B. (2020). Gainers and losers of surface and terrestrial water resources in China during 1989–2016. Nature Communications, 11(1). https://doi.org/10.1038/s41467-020-17103-w
- Wan, W., Xiao, P. F., Feng, X. Z., Li, H., Ma, R. H., Duan, H. T., & Zhao, L. (2014). Monitoring lake changes of Qinghai-Tibetan Plateau over the past 30 years using satellite remote sensing data. Chinese Science Bulletin, 59(10), 1021–1035. https://doi.org/10.1007/s11434-014-0128-6
- Wilson, M. C., & Smith, A. T. (2015). The pika and the watershed: The impact of small mammal poisoning on the ecohydrology of the Qinghai-Tibetan Plateau. Ambio, 44(1), 16–22. https://doi.org/10.1007/s13280-014-0568-x
- Xu, H. (2006). Modification of normalised difference water index (NDWI) to enhance open water features in remotely sensed imagery. International Journal of Remote Sensing, 27(14), 3025–3033. https://doi.org/10.1080/01431160600589179
- Yamazaki, D., Trigg, M. A., & Ikeshima, D. (2015). Development of a global similar to 90 m water body map using multi-temporal Landsat images. Remote Sensing of Environment, 171, 337–351. https://doi.org/10.1016/j.rse.2015.10.014
- Yang, R. M., Zhu, L. P., Wang, J. B., Ju, J. T., Ma, Q. F., Turner, F., & Guo, Y. (2017). Spatiotemporal variations in volume of closed lakes on the Tibetan Plateau and their climatic responses from 1976 to 2013. Climatic Change, 140(3–4), 621–633. https://doi.org/10.1007/s10584-016-1877-9
- Yan, L. J., & Zheng, M. P. (2015). The response of lake variations to climate change in the past forty years: A case study of the northeastern Tibetan Plateau and adjacent areas, China. Quaternary International, 371, 31–48. https://doi.org/10.1016/j.quaint.2014.12.057
- Yue, T. X., Zhao, N., Ramsey, R. D., Wang, C. L., Fan, Z. M., Chen, C. F., Lu, Y.-M., & Li, B.-L. (2013). Climate change trend in China, with improved accuracy. Climatic Change, 120(1–2), 137–151. https://doi.org/10.1007/s10584-013-0785-5
- Zhang, G. Q., Juan, C.-X., Feng, A.-M., Bian, H.-L., Liu, W.-D., Zhang, G.-Q., Wang, C.-Z., Cao, Q., & Zhou, G.-P. (2019). Attenuating the abnormally high expression of AEBP1 suppresses the pathogenesis of childhood acute lymphoblastic leukemia via p53-dependent signaling pathway. European Review for Medical and Pharmacological Sciences, 23(3), 1184–1195. https://doi.org/10.11888/BaseGeography.tpe.249465.file
- Zhang, G. Q., Yao, T. D., Shum, C. K., Yi, S., Yang, K., Xie, H. J., Feng, W., Bolch, T., Wang, L., Behrangi, A., Zhang, H. B., Wang, W. C., Xiang, Y., & Yu, J. Y. (2017). Lake volume and groundwater storage variations in Tibetan Plateau’s endorheic basin. Geophysical Research Letters, 44(11), 5550–5560. https://doi.org/10.1002/2017gl073773
- Zhang, G. Q., Yao, T. D., Xie, H. J., Kang, S. C., & Lei, Y. B. (2013). Increased mass over the Tibetan Plateau: From lakes or glaciers? Geophysical Research Letters, 40(10), 2125–2130. https://doi.org/10.1002/grl.50462
- Zhao, R., Fu, P., Zhou, Y., Xiao, X. M., Grebby, S., Zhang, G. Q., & Dong, J. (2022). Annual 30-m big Lake Maps of the Tibetan Plateau in 1991–2018. Scientific Data, 9(1). https://doi.org/10.1038/s41597-022-01275-9
- Zhou, Y. S., Hu, J., Li, Z. W., Li, J., Zhao, R., & Ding, X. L. (2019). Quantifying glacier mass change and its contribution to lake growths in central Kunlun during 2000-2015 from multi-source remote sensing data. Journal of Hydrology, 570, 38–50. https://doi.org/10.1016/j.jhydrol.2019.01.007
- Zhu, J. Y., Song, C. Q., Wang, J. D., & Ke, L. H. (2020). China’s inland water dynamics: The significance of water body types. Proceedings of the National Academy of Sciences of the United States of America, 117(25), 13876–13878. https://doi.org/10.1073/pnas.2005584117