
 ?Mathematical formulae have been encoded as MathML and are displayed in this HTML version using MathJax in order to improve their display. Uncheck the box to turn MathJax off. This feature requires Javascript. Click on a formula to zoom.
ABSTRACT
With the increasing frequency of floods, in-depth flood event analyses are essential for effective disaster relief and prevention. Satellite-based flood event datasets have become the primary data source for flood event analyses instead of limited disaster maps due to their enhanced availability. Nevertheless, despite the vast amount of available remote sensing images, existing flood event datasets continue to pose significant challenges in flood event analyses due to the uneven geographical distribution of data, the scarcity of time series data, and the limited availability of flood-related semantic information. There has been a surge in acceptance of deep learning models for flood event analyses, but some existing flood datasets do not align well with model training, and distinguishing flooded areas has proven difficult with limited data modalities and semantic information. Moreover, efficient retrieval and pre-screening of flood-related imagery from vast satellite data impose notable obstacles, particularly within large-scale analyses. To address these issues, we propose a Multimodal Flood Event Dataset (MFED) for deep-learning-based flood event analyses and data retrieval. It consists of 18 years of multi-source remote sensing imagery and heterogeneous textual information covering flood-prone areas worldwide. Incorporating optical and radar imagery can exploit the correlation and complementarity between distinct image modalities to capture the pixel features in flood imagery. It is worth noting that text modality data, including auxiliary hydrological information extracted from the Global Flood Database and text information refined from online news records, can also offer a semantic supplement to the images for flood event retrieval and analysis. To verify the applicability of the MFED in deep learning models, we carried out experiments with different models using a single modality and different combinations of modalities, which fully verified the effectiveness of the dataset. Furthermore, we also verify the efficiency of the MFED in comparative experiments with existing multimodal datasets and diverse neural network structures.
1. Introduction
The increasing frequency of flood disasters severely threatens human society (Schumann, Citation2014). Early analysis and accurate estimation of flood events’ causes, social impacts, duration, and extent are essential for disaster relief and prevention. Traditional analysis methods encounter significant hurdles due to relying on limited hazard maps (Bernhofen et al., Citation2018), especially when scaling to large regions. Instead, the enormous amount of remote sensing data has become the main source of flood event analysis data (Bhatt et al., Citation2013; Rahman & Di, Citation2017). Accordingly, existing flood event datasets typically include remote sensing imagery datasets, like the FloodNet dataset (Rahnemoonfar et al., Citation2021) and the Multi3Net dataset (Rudner et al., Citation2019), and meteorological-information-enriched datasets (Gourley et al., Citation2013) exemplified by the European Flood Database (Hall et al., Citation2015), which included victim counts, flood causes, water levels, and spatiotemporal range information. Additionally, there are also datasets collected from social media platforms, such as CHF2015 (Layek et al., Citation2016).
However, notwithstanding the various types of flood event datasets and the available remote sensing imagery, flood event analysis remains greatly challenged by the geographically uneven distribution of data, the scarcity of time series data, and the limited availability of flood-related information. For instance, runoff data and flood disaster records collected by the Global Runoff Data Center (GRDC) are sufficient in Europe and the United States, but this is not the case in developing countries (Sampson et al., Citation2015). Accordingly, flood event analyses that typically adopt flood event data modeling (Hallegatte et al., Citation2013; Sampson et al., Citation2016), such as the river-basin-centered CaMa-Flood model (Yamazaki et al., Citation2011) and the Global Flood Model (GFM) (Wood et al., Citation2011), are not able to employ global flood event data for large-scale flood event evaluations. Likewise, Wilson et al. (Citation2007) restricted their flood event assessment to Bangladesh, and Hirabayashi et al. (Citation2013) quantified the impact of 10-year and 100-year floods instead of annual analyses, attributed to the shortage of time series data. Moreover, hydrological data, along with pertinent textual information (Jongman et al., Citation2015; Winsemius et al., Citation2016), including factors like casualties, geographical location, and economic data, are essential for thoroughly evaluating flood events. However, their acquisition without efficient methods and expertise is rather cumbersome and challenging. Hence, to establish global flood event datasets, amalgamating imagery data with hydrological or textual information is also critical to facilitate enhanced flood event analyses.
The Global Flood Database (Tellman et al., Citation2021), based on data from the Dartmouth Flood Observatory (DFO), is a comprehensive archive of satellite-based flood event datasets across the globe over 15 years. These datasets contain not only satellite image data but also hydrological information. Deep learning models have recently become increasingly adopted for flood event assessments (Islam et al., Citation2020; Luppichini et al., Citation2022; Yang & Cervone, Citation2019). Image data in the Global Flood Database, namely the flood map products derived from remote sensing images, are generally used for model verification but are not fit for deep learning model training. Practically, remote sensing imagery data are used to train deep-learning-based models for flood event analysis, typically confined to single-category classification or semantic segmentation of floods. Nevertheless, precisely distinguishing flooded areas from permanent water bodies remains a substantial challenge, primarily attributed to the dynamic characteristics inherent in these features. Even when leveraging high-resolution remote sensing imagery for improved image features like shape, color, and texture (Blaschke, Citation2010; Cheng et al., Citation2017), determining the appropriate partitioning thresholds in different scenarios remains a formidable challenge. The DFTC datasets (Islam et al., Citation2020) from the data fusion technical committee are multimodal flood training datasets containing SPOT-5 and radar images to support flood detection. Thus, resorting to multi-source imagery to fully take advantage of the complementarity of different sensors, like optical and radar sensors, could be substantially beneficial in flood event analyses.
It is worth noting that intrinsic semantic correlations exist between images regarding flood causes, watershed changes, and temporal variations. These correlation factors influence image features in flood event classification (Wood et al., Citation2011). In practice, by leveraging the textual information in a dataset, semantic details can be extracted from image features for a more refined classification of flood scenery. Therefore, establishing high-quality global flood event datasets, which cover diverse regions and amalgamate imagery data with semantic-rich textual information, is critical for high-accuracy model training and validation (Bernhofen et al., Citation2018) and facilitates enhanced flood event assessments considering both the visual and semantic factors. Aside from deep-learning-based flood event analyses, global flood datasets are vital for empowering fast and accurate large-scale flood event image retrieval. Traditional retrieval methods face challenges when determining precise spatiotemporal searching ranges (Wood et al., Citation2011). Some methods extract approximate flood regions from online reports or social media data (Li et al., Citation2018; Vieweg et al., Citation2010). At the same time, new attempts employ semantic search techniques (Li et al., Citation2012) like fuzzy retrieval using the flood type or level as a keyword. The need for enhanced semantic information in global flood datasets is emphasized in complex data retrieval scenarios (Deng et al., Citation2011). However, traditional screening methods are labor-intensive and require expertise. Enriching global flood event datasets with important semantic information is vital for effectively retrieving and pre-screening flood-related imagery.
To solve the abovementioned issues, we built a Multimodal Flood Event Dataset (MFED) for deep-learning-based flood event analysis and retrieval. It comprises multi-source remote sensing images and heterogeneous textual information from various flood-prone regions worldwide spanning the years 2000–2018. Firstly, the MFED contains multi-source remote sensing data, incorporating optical and radar images as the image modalities of flood event datasets. Here, satellite data from Landsat-5/7/8 and IRS-P6 are used as the optical image modality, while Sentinel-1 and ENVISAT-1/2 data are used for the radar image modality. By exploiting the features of optical and radar satellite sensors, the correlation and complementarity between distinct image modalities in the MFED can be harnessed to capture the nuances of pixels in flood images. Diverging from single-mode datasets, the presented multimodal dataset introduces much richer information with more dimensions. Secondly, based on the Global Flood Database, the MFED employs heterogeneous textual information as the text modality of the flood event dataset. It systematically incorporates satellite-based flood image data and hydrological information from the Global Flood Database. Then, through a meticulous data cleaning process, the structured flood-related textual information can be filtered from these gathered flood data. With these flood-related text modal data in the MFED, including geographical extents, global flood event causes, watershed changes, and temporal variations, the flood model can extract semantic features to provide semantic support for flood event classification and analysis. The geographical extent and temporal information related to the flood event can also be exploited to enable automatic remote sensing data retrieval for model training. Additionally, information from news reports on the web is also harnessed as another text modality. In the case of vague or imprecise flood regions, the semantic information extracted from retrieved online news can provide more precise geographical information on flood event locations. Accordingly, semantic information may supplement the correlated image data and support the comprehensive flood event analysis. Following this, benefiting from the global multimodal flood-related remote sensing imagery and semantic-rich text offered by the MFED, we can expect an enhanced efficiency of flood event analyses and flood-related image retrieval. In this paper, we verify the advantages of multimodality by comparing multimodality and single-modality models. We also compare the MFED with existing multimodal remote sensing datasets to verify its effectiveness for flood event analysis.
2. Data and method
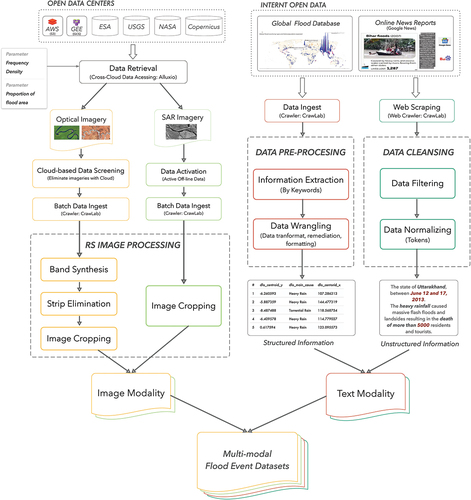
In this section, we first introduce our data sources. For image modalities, optical images from Landsat series satellites on the public remote sensing platform and radar images from the Sentinel-1 satellite were selected according to the requirements for the spatiotemporal range and the ease of downloading data. For the text modality, we used comprehensive search engines to source news records and the Global Flood Database as a source of hydrological data. Secondly, through the API provided by the remote sensing platform and internet crawler technology, we retrieved data according to the collection principle and downloaded the remote sensing images and text data that met the requirements in bulk. Finally, the data processing of different remote sensing images included band synthesis, fringe elimination, image acquisition, etc. Structured textual data processing included information extraction based on keywords and data wrangling. For unstructured text, data processing included data filtering and normalization. shows the principal data sources in our study and the processes involved in collecting and processing distinct data modalities.
Figure 1. Data sources, data collection methods, and data processes for the MFED.
2.1. Data source
To facilitate batch data downloads and address the worldwide need for spatiotemporal observations, we used multiple platforms such as the European Space Agency (ESA), the United States Geological Survey (USGS), and the Aerospace Information Research Institute at the Chinese Academy of Sciences as remote sensing imagery sources. To ensure reliable and comprehensive text data sources, we chose Google and Baidu search engines and the Global Flood Database as the text modal data sources.
We chose to use optical and radar images in the MFED, combining the spectral characteristics of water bodies in optical images (Bhagat & Sonawane, Citation2011; Feyisa et al., Citation2014; Li et al., Citation2015) with the advantage that radar images are not influenced by weather conditions (Gan et al., Citation2012; Giustarini et al., Citation2012; Westerhoff et al., Citation2013). Considering that the selected satellite measurements are global and the target time frame of the Global Flood Event Database is 2000–2018, we selected Landsat-5, Landsat-7, and Landsat-8 satellites as our optical image sources. To facilitate bulk data downloads, we utilized the Landsat Collection 2 Level-2 dataset, available on the Microsoft Planetary Computer platform. This dataset covers the period from August 1982 to the present and is sourced from data providers such as NASA and USGS. Furthermore, to enhance the diversity of data types in our multi-source remote sensing imagery, we add IPS-P6 as an additional optical image source.
To match the spatio-temporal range of the optical images and to simplify data downloading, we chose the Sentinel-1 satellite as the source of radar imagery. We used the Copernicus Open Access Hub as a data source, which provides complete, free, and open access to Sentinel-1, Sentinel-2, Sentinel-3, and Sentinel-5P products. The Copernicus Open Access Hub provides an API and creates a script to automatically search for and download Sentinel data. However, the first Sentinel-1 satellite was launched in April 2014, and our dataset extends back to 2000. Thus, our data sources also encompassed ENVISAT-1 and ENVISAT-2 satellites.
Hydrological information can serve as a trusted record for flood event analyses (Lehner & Grill, Citation2013; Sampson et al., Citation2016) and network data have gradually been playing an increasingly important role in disaster management analysis and evaluation (Alam et al., Citation2020; Kruczkiewicz et al., Citation2021; Vogel & Arumugam, Citation2016). We chose hydrological information and news reports taken from the internet as text modalities. The hydrological information in the Global Flood Database combines over 15 years of flood data and major flood events recorded by the DFO since the beginning of satellite records, creating the first comprehensive satellite-based resource for global flood risk management and mitigation. To ensure the acquisition of precise news reports on flood events, we opted for Google and Baidu, two widely utilized search engines, as our data sources.
shows the data sources for all flood events in the MFED. For image modality, we obtained 1100 satellite images of Landsat-5/7/8 from the USGS platform, 198 satellite images of Sentinel-1 from the Copernicus Open Access Hub, and 121 satellite images of IRS-P6, ENVISAT-1 and ENVISAT-2 satellites from the Institute of Aerospace Information of the Chinese Academy of Sciences. In the text modality, we obtained 8,000 news reports from the Google search engine, 1,000 news records from the Baidu search engine, and 913 flood event records from the Global Flood database.
Table 1. Data source statistics of flood events in MFED.
2.2. Data collection
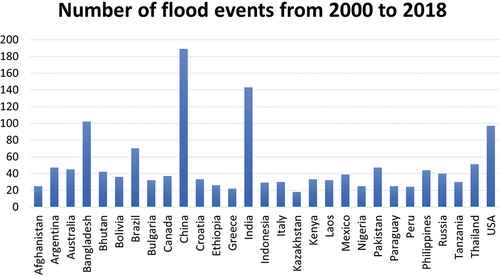
To acquire remote sensing imagery and textual information about flood events, we leveraged the spatiotemporal range provided by the Global Flood Event Database for data retrieval. We obtained multi-source remote sensing imagery and heterogeneous text data using an application programming interface in Python libraries that supports remote sensing image retrieval. First, we needed to collect global flood event information from the Global Flood Event Database as the basis for building the dataset. Therefore, we collected data on 913 flood events from flood-prone regions worldwide spanning the years 2000–2018, encompassing 29 countries. For each flood event, we established an analysis pair comprising flood images and corresponding event records. Each pair consists of an optical and a radar image, alongside hydrological details and an associated news record. shows the number of flood events we collected by country.
Figure 2. Collected flood event statistics for flood-prone areas around the world. Between 2000–2018, there were over 15 flood events in each of these countries.
When collecting remote sensing images, we used the density and frequency of the region, the number of clouds, and the proportion of the flood area as the criteria for data collection. We used automated downloading tools to download remote sensing images in batches from major data platforms and preprocessed different types of images to obtain image modalities. For each pair, image modalities were acquired with the same spatiotemporal extent. The images in the Global Flood Database are processed flood data products, and we can retrieve thousands of remote sensing images by their latitude and longitude. Therefore, we used the extension of the center point coordinates instead of the four-corner latitude and longitude coordinates of remote sensing product images as the search range.
For optical images, we used Python scripts to acquire remote sensing images in batches using the PyStacFootnote1 tool, which is a library for working with SpatioTemporal Asset Catalogs (STACs) in Python 3. Using the STAC API, Landsat images were acquired from the Microsoft Planetary Computer platform (Source et al., Citation2022). We set the search scope according to the spatiotemporal extent of the flood event and limited the maximum cloud cover of the crawled data to 20%. The remote sensing imagery results obtained in the search area were sorted according to the cloud cover size, and the data with the lowest cloud cover were selected.
For radar, we use the SentinelsatFootnote2 (Valgur et al., Citation2019) API based on the HTTPS protocol in Python to perform batch searches and automatic downloads of Sentinel-1 data on Copernicus Open Access Hubs. It should be noted that we could use the Sentinelsat API to access the latest data and historical data simultaneously. Offline historical data in the database needed to be activated before downloading. Due to restrictions on downloading remote sensing images of other regions, we have chosen to utilize remote sensing images specifically covering China in order to diversify the range of image types within the MFED dataset. The IRS-P6 satellite served as an additional optical imagery source, enriching the image modality, while ENVISAT-1 and ENVISAT-2 were introduced as additional radar imagery sources. The data are sourced from the Remote Sensing Data Service SystemRemote Sensing Data Service SystemFootnote3 operated by the Aerospace Information Research Institute at the Chinese Academy of Sciences. For model training with the MFED, we utilized the event database to supply accurate spatiotemporal ranges as positive samples. Concurrently, we designated spatiotemporal ranges beyond its scope as negative samples, achieved through latitude and longitude deviations. All image types used are listed in .
Table 2. Types of remote sensing images collected in our dataset and the corresponding numbers of each type.
The structured information in the MFED is hydrological information on flood events taken from the Global Flood Dataset. It includes the main cause of the flood event, the longitude and latitude coordinates of the center point of the flood area, the start and end time, the main country where the flood event occurred, and the coordinates of the rectangular frame used to retrieve the image. For unstructured information, we used the country and time of flood as search keywords to search for relevant titles and abstracts on Google and Baidu as positive samples. At the same time, we used water as a keyword to search for information not related to floods as negative samples. By leveraging web crawler techniques like link analysis and content parsing, we ensure a meticulous and comprehensive extraction of relevant data. Details of the text modality are shown in the .
Table 3. Structured information of our text modality, such as the specific time, major countries, and reason for the flood event, and the news reports crawled from the internet, including summaries and titles.
2.3. Data processing
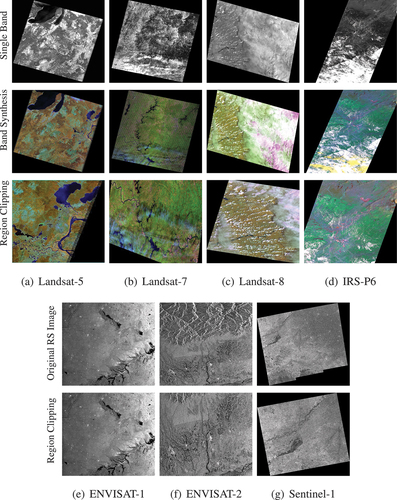
The images we downloaded couldn’t be directly incorporated into the dataset due to quality issues such as cloud interference, speckle noise, et cetera, and the proportion of the flood area in the image will affect the quality of the model training. Hence, processing the data for each modality in the MFED was imperative. We download the images from the Microsoft Planetary Computer platform using the STAC API with an upper cloud coverage of 20% and conduct an optimal data selection based on cloud coverage through a batch data selection script. Then, we further check the cloud coverage and speckle noise of the data manually one by one to ensure that the flood area could be identified. In addition, based on the image characteristics, we adopted different data processing methods for radar and optical images. Most of the optical images we collected were multi-band data. We chose three bands for color synthesis to adapt to the RGB image format in the deep learning model. Based on the characteristics of different satellite bands, we selected bands that best reflect the characteristics of water bodies, such as red bands, near-infrared bands, and short-wave infrared bands, for synthesis. For Landsat-5, bands 4, 5, and 3 were chosen for synthesis; for Landsat-7, bands 5, 4, and 3 were chosen; for Landsat-8, bands 5, 6, and 4 were chosen; and for IRS-P6, bands 5, 4, and 3 were chosen.
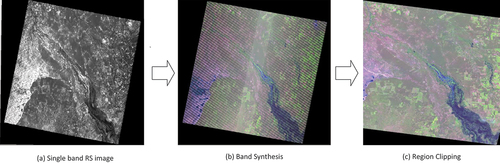
Due to the Landsat-7 ETM+ onboard scanning line corrector (SLC) failure, the Landsat-7 images we acquired had stripes. We used the official landsat_gapfill.sav plug-in to eliminate these stripes. Since the flood area does not necessarily occupy the entire image, we also cropped the flood area while preserving the original image as much as possible. shows our results of processing optical images.
Figure 3. MFED performs multi-band color synthesis for optical images. For the images with stripes after synthesis, the stripes are eliminated. To make the flood area account for a larger proportion of the overall image, we cropped the flood area.
Radar image processing was relatively simple. For Sentinel-1, the product type we chose was Level-1 Ground Range Detected (GRD), which consists of focused radar data that have been detected, multi-looked, and projected to the ground range using an Earth ellipsoid model. Radar images do not consist of multiple bands like optical images. Different polarization methods are also important in addition to frequency, amplitude, and phase. The images we downloaded are dual-polarized: HH (horizontal transmission horizontal receiving) and HV (horizontal transmission vertical directly). Sentinel-1 scans the same area with a longer cycle and larger coverage than optical sensors, so we cropped the flood area into multiple images. Sentinel-1 imagery processing is shown in . shows our image processing results for all types.
Figure 4. Images from Sentinel-1 collected in our dataset in HH and HV polarization. Due to the wide range of observations in radar images, we clipped flood areas with intervals into multiple instances.
Figure 5. Intermediate and final results during the processing of all image types in our dataset. It is worth noting that optical image processing involves two more steps of image synthesis and streak elimination.
We performed data wrangling for structured information. We extracted key fields suitable for deep learning training, classified some small classes in the fields into broad categories (such as Typhoons Damrey and Saola are converted to Typhoons), unified different descriptions of the same type, transformed the spelling, and so on. The unstructured information included the title and abstract information from internet news reports. However, the HTML crawled from the internet has problems such as format errors, repeated information, and invalid information. Our text cleaning work included removing special characters and web page tags using regular expressions, formatting data to make it easy to process and analyze, and removing invalid data. Finally, we converted the text and image modalities into JSON formats and recorded various information types through key-value in a hierarchical structure.
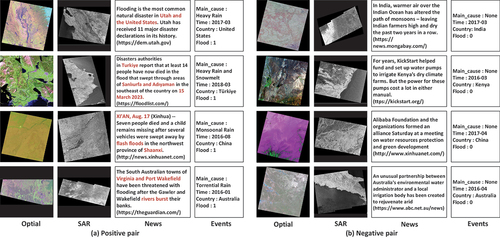
shows eight sample pairs in the MFED; the four groups on the left are positive examples, and the four groups on the right are negative examples. In the event record, the “Main_cause” field denotes the cause of the flood event, the “Time” field indicates the time of occurrence, the “Country” field specifies the country affected, and the “Flood” field contains a value of 1 for positive examples and 0 for negative examples. The MFED dataset is available for download from the Science Data Bank. The download link has been provided in the data availability statement section. The MFED dataset’s positive pairs mean both the text and image modality data are related to flood events. The negative pairs mean that the text and image are unrelated to the flood. For image modality, the geographical location and time of the images in the negative pairs are offset by the flood events, making the negative pairs’ image modality irrelevant to flood events. For text modality, we use “water” as a keyword in search engines to get news records unrelated to floods. In addition, although the textual information from Internet news records does not contain abundant information related to flood events, the data pairs could still be considered positive since the image modality data covers the flood’s location. The image modality includes radar and optical images. Since the purpose of our dataset is to retrieve images of flooded areas through different types of remote sensing imagery, there is no strong correlation between the images, but the latitude and longitude ranges of the images are similar. While both optical and radar images depict the flood area, the ability to discern flowing areas from other terrains is evident. Yet, distinguishing permanent bodies of water from flooded areas solely through imagery remains challenging. Take the last group as an example, i.e. the positive and negative sample pairs from Australia in 2016; the information obtained on the image modality is limited. From the text modality, we can not only learn the specific cause of the flood but also determine the location and time of the flood. To determine data quality, we used a detection program on all the image files to ensure that all files were readable and usable, and we randomly selected 50% of the images for detection. Finally, the MFED contains 1138 scenes of optical images, 281 scenes of radar images, 9000 pieces of news data related to flood events, and 913 pieces of flood event records after all data processing.
Figure 6. Processed sample pairs in the dataset. The image modality includes an optical image and a radar image, and the text modality includes unstructured news records and structured hydrological information.
3. Data validation
In this section, we apply the global flood classification model as an example to verify the validity of the MFED. We use a basic model architecture for classification experiments on the MFED, a variety of common neural network algorithms for testing, and comparison experiments on a common multimodal dataset. We verify that the MFED can successfully aid in the detection of flooded areas and demonstrate that multimodal data are more expressive than single-modality data.
3.1. Deep-learning-based flood model settings for the MFED
We verified the effectiveness of the MFED in flood classification using different model structures. To better apply multimodal data, we used a classical image and text model structure to verify the validity of the data.
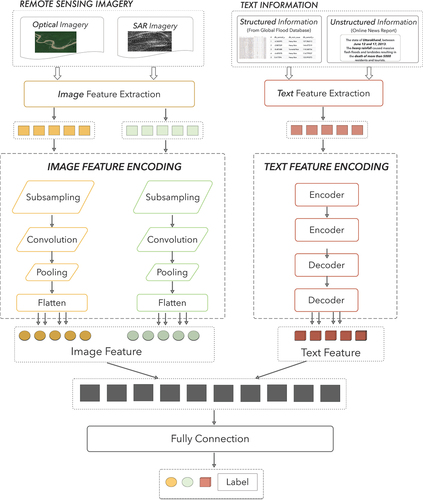
Since multimodal remote sensing data cannot be directly applied in neural networks, we used a simplified multimodal model for model training. Our multimodal model primarily comprises an image and text feature encoder. The image feature encoder utilizes a typical deep learning network for image feature extraction, such as ResNet152 or VGG16. The text feature encoder utilizes the Bert network. We use the image encoder to extract features from multi-source remote sensing images and the text encoder to extract features from text modality. These features are combined using a vector concatenation method, resulting in the joint representation of multimodal features through a fully connected layer. The model structure is shown in . Taking ResNet152 as an example for image modal feature extraction, the input image size is [224, 224, 3]. Given the diverse resolutions and band numbers of remote sensing images, we devised an adaptive sampling method. These approaches enable us to effectively read and sample various remote sensing images, ensuring their suitability for deep neural networks. The sampled images are passed through the ResNet152 model structure, undergoing convolution and pooling operations within the network. In our model training process, we initially load the pre-trained raw weights of ResNet152. Subsequently, we train our dataset based on these pre-trained weights. This approach accelerates our model training process. Consequently, the output of the optical image is [1, 1, 2048]. For Text modality coding, we utilize the Bert network to encode text features, setting the maximum number of words to 256. The input word vector size is computed within each mini-batch. We calculate the longest vector size in each batch as the input dimension. Short sentences are padded to match the maximum length. Additionally, we set the hidden layer size to 768, resulting in a feature vector length of 768 for the output after text modality encoding. We merge the multimodal image and text features through feature vector concatenation, then feed them into a fully connected layer for model prediction. We use the cross-entropy function as the loss function, which measures the difference between the predicted probability distribution and the actual distribution of the labels to effectively train our model by penalizing incorrect predictions and encouraging convergence towards the correct classification.
Figure 7. The simple multimodal model architecture used for training the multimodal data in our dataset. In the multimodal model, there are two processing parts, image modal encoder and text modal encoder, in which different deep learning models are used as coding structures. Finally, the features obtained from the image modality and text modality are fused and passed into the fully connected layer to obtain the final judgment result of the model.
During the experiments, we used different deep learning models for model training to test the applicability of the MFED. The image modality comparison analysis involved ResNet, VGG16, SqueezeNet, and other models. For the text modality, since Bert has proven to have excellent classification results in the text field, we choose Bert as the text model.
We utilize the JSON format to store the multimodal data records of MFED. Following the conventional size settings for training, validation, and test set partitions, we randomly scrambled the file records storing the MFED dataset information. Subsequently, we generated the training, validation, and test sets by parsing the record file in a ratio of 60:20:20. We train the model using the training set and evaluate its classification performance using the validation set, which fine-tunes the model’s hyperparameters and conducts an initial assessment. Finally, we gauge the model’s classification effectiveness based on the results obtained from the test set. In our analysis, we employed diverse evaluation metrics to assess the performance of our model comprehensively. These metrics include F1 score, Average Precision (AP), Precision, Recall, and Area Under the Curve (AUC), allowing us to understand its effectiveness in classification tasks.
3.2. Single modality validation of the MFED
To verify the validity of each modality in the MFED, we tested each single modality and combined text and image modalities to compare their performance. We use single-modality data to train different deep-learning models. For the text modality, the Bert network was used for training. For the two image modalities, we used VGG16 and ResNet152 for training. The best experimental results were finally obtained by continuously adjusting the model parameters and are shown in .
Table 4. Single modality training results. The Bert model structure is selected for the text modality, and the VGG16 and ResNet models are selected for the image modality. We chose the accuracy rate as the best performance indicator of the model and recorded the results of each indicator in the best model.
For radar, the effect of VGG16 is better than that of the ResNet152 model; the F1 value is 0.84454, the AP is 0.8458, and the Recall is 0.96045. For optical images, the ResNet152 model is better than VGG16; its F1 value is 0.81933, higher than the value of VGG16 but slightly lower than the effect of radar in the VGG16 model. For models trained in image modality, the AP and precision on the test set did not exceed 90% in ResNet152 and VGG16 networks. Model training using text modality also exhibits low F1 values and recall rates. Despite the experiment confirming that single modality data have classification effectiveness for model training, the performances are unsatisfactory. Additionally, as the primary objective of the MFED dataset is to analyze flood images, we prioritize evaluating the effects of the imaging modality.
3.3. Multimodal validation of the MFED
The use of multimodal data takes advantage of the benefits of different types of remote sensing imagery (Knyaz, Citation2019; Lahat et al., Citation2015; Yang et al., Citation2019). To prove that using multimodal data in the MFED classification effect is better than using single-modality data, we used pairwise combinations of different modalities and all modalities as input data with the same parameters and models for comparative experiments. We chose the combination of optical images and text, radar and text, and optics, radar, and text to conduct comparative experiments in the same network structure. The experimental results are shown in the . We found that the classification effect of multimodal data is much better than that of single-modality data. The combination of text and radar data and the combination of text and optics data significantly improved the classification effect compared to the single-image modality.
Table 5. Multimodal training results. We experimented on multimodal datasets with the same model structure and training method. The single modality is replaced by a combination of different image modalities and text modalities, and the best experimental results under different models are recorded.
When using a combination of optical images and text in the VGG16 model, compared to using optical images, the precision increased by 17.48%, the F1 value increased by 28.74%, and the AUC value increased by 41.87%. When using a combination of radar images and text in the VGG16 model, compared to using radar images, the precision increased by 14.19%, the F1 value increased by 9.95%, and the AUC value increased by 25.99%. For the ResNet152 model, the precision increased by 4.73%, the F1 value increased by 7.45%, and the AUC value increased by 12.4%. As demonstrated in the experiment, the VGG16-based image feature extraction network trained with a combination of radar image and text data outperforms the model trained with only text modality in terms of F1 value, Recall value, and ROC. While the model trained with the combination of optical image and text only shows a slight discrepancy in AP compared to that trained with only text modality, other indicators are higher than the model trained with simply text modality. Unfortunately, on the ResNet image feature extraction network, the combination of a single image source and text failed to exceed the training results of the text modalities. This suggests that the features extracted by the ResNet network do not achieve effective fusion with the text features, thereby impacting the overall classification effectiveness to a certain extent.
When using a combination of optics, radar, and text modalities, the classification effect of the model was best. For the VGG16+Bert model, the F1 score was 0.98799, the AP was 0.98044, and Recall was 0.9887. Even the model classification based on ResNet152 as an image feature extraction network has been significantly improved, which demonstrated that a combination of three modalities was better than a single modality and a combination of two modalities.
3.4. Adaptability of the MFED on different deep-learning-based flood models
To verify the adaptability of the MFED to different deep learning models, we tested more model structures. We consistently used the Bert network for the text modality and different deep learning networks for the image modality, such as ResNet50, ResNet152, VGG16, Densenet169, and SqueezeNet, for performance comparison.
In , it’s evident that the model effect of multi-source remote sensing image as image modality in the MFED dataset has achieved good results in various network structures. Among the six network models, AP and Precision are all higher than 0.95, achieving a good classification effect. The effect of ResNet50 is better than ResNet152. This could be due to the higher proportion of non-flooded areas in remote sensing images. As a result, deeper network structures may emphasize irrelevant information and potentially interfere with the classification process. We found that VGG16 achieved the best classification effect, even though VGG16 does not have many network layers. VGG16 uses multiple convolutional layers with smaller convolutional kernels instead of convolutional layers with larger convolutional kernels. In this way, the flood areas in the remote sensing images are captured more effectively, thus achieving better classification results.
Table 6. Comparison of experimental results between the MFED and other multimodal datasets.
The ROC curves are shown in , which shows that when multiple models are tested with the same parameters, the effect of using multi-source remote sensing imagery in multimodal data is superior to the combination of single remote sensing imagery and a text modality. The excellent classification effect of the MFED for various deep learning models fully verifies its applicability.
Figure 8. ROC curves of different modality combinations for each model.
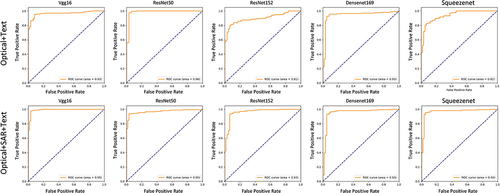
We compared the performance of MFED (Image (Optics)+TEXT) and MFED (Image (Optics+Radar)+TEXT), both of which train models based on the MFED dataset, except that the former image modality uses only optical images, while the latter image modality uses radar and optical images. shows that the six multimodal models using different image feature extraction networks all have good classification effects. The classification effect of multimodal far exceeds that of a single modality, which indicates the advantage of multimodal data. The impact of using radar and optical image as image modality in the five models is better than that of using optical image only as image modality. The effect on the ResNet50 model is not exceeded, which may be because the deep network structure is not entirely suitable for mining multimodal features. We will further explore the more suitable network structure for mining multimodal features.
3.5. Comparative analysis of the MFED with traditional multimodal remote sensing datasets
To verify the validity of the MFED as a multimodal remote sensing dataset, we compared it with traditional multimodal remote sensing datasets. Traditional multimodal remote sensing datasets encompass a limited variety of remote sensing imagery. ISPRS (Cramer, Citation2010) includes Infrared-Red-Green (IRRG) images and DSM data extracted from the Lidar point cloud. The RIT-18 dataset (Kemker et al., Citation2018) includes six VNIR spectral bands and two NIR bands not included in ISPRS benchmarks. The image modality data in the MFED contains seven different types of remote sensing satellite images. In addition, the MFED’s text modality includes news reports with richer semantic information.
The MFED dataset is designed to provide samples for deep learning models and verify its effectiveness for training various deep learning models. To achieve this, we evaluate MFED’s performance on different models. To validate the validity of the data evaluation method, we also used other multimodal datasets (RSITMD and RSICD) to train the models on the same model structure. We choose the RSICD and the RSITMD for comparative experiments with the MFED. Considering that the RSICD and the RSITMD only have a single image modality and a text modality, we experimented with the combinations of optical images and text and optical images, radar, and text on different models. The MFED was devised for flood event classification, while the RSICD and RSITMD are aimed at multi-classification tasks and include various remote sensing imagery types, such as rivers, airports, mountains, cities, etc. To assess the effectiveness of the classification model structure with multimodal data, we selected positive and negative examples from the RSITMD and the RSICD, focusing on river shapes and bridges that approximate the shape of rivers. This choice validates the suitability of our chosen classification model structure for multimodal data. However, this reduces the available data in RSICD and RSTIMD, thereby increasing the likelihood of overfitting in the model.
shows the performance of the MFED, RSICD, and RSITMD datasets in the same deep learning model structure for training. RSICD (Image+TEXT) represents the model classification effect in different networks using Image and TEXT modalities data in the RSICD dataset. Similarly, RSITMD (Image+TEXT) represents the model classification effect in the RSITMD dataset. The basic model architecture we used achieved good classification results on both RSITMD and RSICD datasets, especially in the RSCID dataset. The feature extraction network based on ResNet50 and Bert achieved more than 99% results in almost every index. This validates that our proposed model structure can be used to verify the validity of multimodal datasets.
Additionally, it is observed in the experiment of the RSITMD dataset that the Recall value of the test set achieves 1 in six image feature extraction networks. This phenomenon arises due to the limited number of samples in the RSITMD dataset. To verify the universality of the model structure, only two categories in the RSITM dataset are selected for the classification experiment. Consequently, there are fewer samples available for model training. Moreover, the text modality of RSITMD contains simple, similar statements, enabling Bert networks to rapidly learn text features for category differentiation, leading to the overfitting of deep learning models.
The images in the RSITMD are in GeoTIFF format, so the training results are close to the MFED. The images in the RSICD are in JPEG format, and the data are read in RGB format. Due to the low resolution, the deep, complex network structure failed to achieve better results. For the combination of a single image modality and text modality, the classification effect of our proposed MFED is better than the RSITMD. We have verified that the combination of optical images, radar, and text can lead to better classification results in multiple models, which fully proves the validity of multimodal data.
4. Discussion
Using trained deep learning models has proven to be instrumental in enhancing the efficiency of flood event analyses. Our goal is to provide training and validation data for deep-learning-based global flood models and to compensate for the lack of semantic information in traditional multimodal remote sensing datasets. The MFED offers a worldwide repository of multi-source remote sensing images, including optical and radar data, and integrates diverse remote sensing data with authentic textual information. The MFED ensures rapid retrieval based on text semantics and provides a multi-dimensional reference for flood event analyses. Notably, the MFED extends across a broader temporal and spatial spectrum and offers more detailed and authentic textual records. It allows for an in-depth analysis of flood events in multiple dimensions and serves as a valuable source of model training data and model validation support for global flood models.
To verify the multimodal advantage of the MFED in model training, we compared multimodal data with single-modal data. Our experiments involved various models utilizing both single modality data from MFED and different combinations of modalities, fully verifying the effectiveness of the dataset. In the comparison experiment between single modality and combined modalities, we maintained uniform parameters and employed identical deep learning model structures to compare the outcomes of model training. The results show that using multimodal data significantly improves classification performance compared with using a single modality. When we combine all modalities, the multimodal dataset achieves a better classification performance on all models. For the VGG16 model, the precision was the highest at 0.98315, which is 18.94% higher than when using optical images alone and 15.66% higher than when using radar alone. This validates that the classification effect of multimodal data is better than that of a single modality and the combination of two simple modalities. Remote sensing images carry geographic information that can potentially correlate with textual semantics. Different satellite images emphasize varied observation aspects, resulting in complementarity and correlation among multi-source remote sensing images. While visual features and spatial details are provided by the image modality, contextual nuances and semantic descriptions are offered by the text modality. Integrating these modalities and exploring their internal correlations can enhance the performance of classification and retrieval tasks. Multimodality data allows us to explore hidden connections between textual semantics and visual features in remote sensing images, thereby advancing the application of multimodal data analysis.
To verify the MFED’s utility as a multimodal dataset, we compared its effectiveness in model training with that of traditional multimodal remote sensing datasets. We used different model architectures and explored combinations of different modalities for training to perform a comprehensive comparison. The results show that the MFED performs as well as other multimodal remote sensing datasets in model training. The applicability of the MFED as a model training dataset was verified through the application to the global flood classification model. The structured hydrological information in the MFED can also be used as validation information to evaluate model and algorithm effectiveness. In the experiment, we use the multimodal feature vector concatenation and a full connected layer to combine these features, which is insufficient for mining the correlation between multimodal features. In addition, we chose two categories of water and bridge in RSITMD and RSICD for classification experiments, which resulted in less training data. The experimental results are prone to overfitting. Our subsequent research will also use more complex model structures to explore the correlation between multimodal features further.
Multimodal data can fully exploit the advantages of different types of remote sensing imagery; therefore, research on multimodal remote sensing datasets is increasing. We also compared the MFED with traditional multimodal remote sensing datasets. displays an overview of the recently published public datasets within remote sensing. The MFED dataset is a multimodal flood event dataset comprising multi-source remote sensing images and text modality rich in flood-related semantics. It offers sufficient semantic rich flood event related text modality data abstracted from both Global Flood Database and news reports on the Internet. Furthermore, it retains abundant geographic information on the multi-source imageries while maintaining the imageries with their original spatial resolution. Practically, the typical multimodal remote sensing datasets consist of different types of remote sensing imageries. However, the absence of textual data makes these multimodal image data impractical in flood event analysis due to the shortage of flood-related semantic information. Generally, most existing multimodal remote sensing datasets contain some text modality data. Still, these data are usually a simple self-description of the image data scene instead of flood correlated semantic information. For instance, textual descriptions within the RSITMD multimodal dataset are simply straightforward data depictions, like “There are some trees outside the playground.” In contrast, our MFED dataset takes full advantage of textual semantics in flood event analysis by applying flood-related text modality, especially the geographic information of flood location and the cause, casualties, and description of the flood. These flood-related textual data are abstracted from Global Flood Database and flood related news reports on the Internet. The text modality data abstracted from the authentic news articles are not limited to the temporal and spatial scope information of floods, but also the detailed information of the flood event, like the cause of the flood and the disaster situation, the countries primarily affected, the duration of the event, etc. Take flood news from the Internet, for example, which could state “People in Myanmar appear to have been warned that a cyclone was approaching, (10 feet) high storm surge that flooded and destroyed entire villages.”. The information abstracted from this news as a text modality of our MFED datasets may encapsulate more elaborate semantic details, including the cause of the flooding (cyclone) and the location (Myanmar). Following this, the text modality of our MFED enriched with textual representations harbor deeper semantic associations and could finally enable the discovery of latent relationships between text and visual modalities. Furthermore, to fit deep learning model training, some existing multimodal datasets typically convert imageries into some specific format at sampled lower resolution with fixed sizes such as 256256
3. Instead of trivial data format conversion and data sampling, MFED datasets retain abundant geographic information (like coordinate system, geographic location, and projection parameters) of the multi-source imageries while maintaining the imageries with their original spatial resolution. Therefore, for MFED datasets, the information loss and degradation during data converting could be avoided.
Table 7. Comparison of publicly available multimodal remote sensing imagery datasets.
The Global Flood Database was initially adopted for data collection since it could provide the spatiotemporal range of locations where the flood event occurred. Nevertheless, the MFED is still a relatively small sample dataset, and the amount of images is impractical for a global-scale flood event analysis. Therefore, the MFED dataset also continually collect the flood related news reports from the Internet using a web crawler during model training. The flood-related semantic information from news reports is adopted as text modality and employed to capture the image data. In the following work, we also lay an effort to train a retrieval model to continuously augment the datasets by incorporating news records that have been meticulously retrieved and authenticated by domain experts.
5. Conclusion
The significance of flood event analysis is paramount in the context of increasingly frequent flood disasters. With the application of deep learning models in flood event analysis, high-quality flood event datasets are very important. To fulfill this requirement, we propose MFED, a flood event dataset with global coverage. MFED aims to mitigate the inherent limitations of traditional flood datasets, such as uneven geographical distribution, reliance on a single image type, and inadequate semantic information. The MFED integrates multi-source remote sensing imagery and textual information to provide a multimodal dataset of flood-prone regions worldwide, which can be utilized for training deep learning models. By utilizing multi-source remote sensing images like optical and radar, we can access a wider range of visual semantic features in flood-related remote sensing images. Furthermore, MFED incorporates news reports and flood event information with rich semantic information as text modalities, enhancing flood event analysis by providing richer and more realistic textual semantic features. We conducted full comparative experiments on single modality and multimodal combinations, proving that the MFED is effective for training multiple models. This comparative analysis confirms that multimodal data are better than single-modality data for flood classification. In the future, we will further improve the amount and types of remote sensing imagery and authentic text information in the MFED and explore the potential relationships between multimodal data at a deeper level.
Disclosure statement
No potential conflict of interest was reported by the author(s).
Data availability statement
The MFED dataset is available for download from the Science Data Bank at the following link: https://doi.org/10.57760/sciencedb.14826.
Additional information
Funding
Notes on contributors
Zhixin Zhang
Zhixin Zhang received a B.E. in Network Engineering from the China University of Geosciences (Wuhan) in 2021 and is currently pursuing a master’s degree in Signal and Information Processing at the University of Chinese Academy of Sciences.

Yan Ma
Yan Ma is an Associate Professor at the Aerospace Information Research Institute, Chinese Academy of Sciences. Her research interests are focused on remote sensing, big data computing, data center cloud computing, cluster computing, and performance optimization.

Peng Liu
Peng Liu is an Associate Professor at the Aerospace Information Research Institute of the Chinese Academy of Sciences. His research interests include remote sensing imagery processing and deep learning.
Notes
1. PyStac document: https://pystac.readthedocs.io/en/latest/.
2. Sentinelsat document: https://Sentinelsat.readthedocs.io/en/stable/.
References
- Alam, F., Ofli, F., & Imran, M. (2020). Descriptive and visual summaries of disaster events using artificial intelligence techniques: Case studies of hurricanes Harvey, Irma, and Maria. Behaviour & Information Technology, 39(3), 288–318. https://doi.org/10.1080/0144929X.2019.1610908
- Bernhofen, M. V., Whyman, C., Trigg, M. A., Sleigh, P. A., Smith, A. M., Sampson, C. C., Yamazaki, D., Ward, P. J., Rudari, R., Pappenberger, F., Dottori, F., Salamon, P., & Winsemius, H. C. (2018). A first collective validation of global fluvial flood models for major floods in Nigeria and Mozambique. Environmental Research Letters, 13(10), 104 007. https://doi.org/10.1088/1748-9326/aae014
- Bhagat, V. S., & Sonawane, K. R. (2011). Use of Landsat ETM+ data for delineation of water bodies in hilly zones. Journal of Hydroinformatics, 13(4), 661–671. https://doi.org/10.2166/hydro.2010.018
- Bhatt, C. M., Rao, G. S., Begum, A., Manjusree, P., Sharma, S. V. S. P., Prasanna, L., & Bhanumurthy, V. (2013). Satellite images for extraction of flood disaster footprints and assessing the disaster impact: Brahmaputra floods of June–July 2012, Assam, India. Current Science, 104(12), 1692–1700. http://www.jstor.org/stable/24092606
- Blaschke, T. (2010). Object based image analysis for remote sensing. ISPRS Journal of Photogrammetry and Remote Sensing, 65(1), 2–16. https://doi.org/10.1016/j.isprsjprs.2009.06.004
- Cheng, G., Han, J., & Lu, X. (2017). Remote sensing image scene classification: Benchmark and state of the art. Proceedings of the IEEE, 105(10), 1865–1883. https://doi.org/10.1109/JPROC.2017.2675998
- Cramer, M. (2010). The DGPF-test on digital airborne camera evaluation overview and test design. Photogrammetrie-Fernerkundung-Geoinformation, 2010(2), 73–82. https://doi.org/10.1127/1432-8364/2010/0041
- Deng, J., Berg, A. C., & Fei-Fei, L. (2011). Hierarchical semantic indexing for large scale image retrieval. In Cvpr 2011 (pp. 785–792). IEEE.
- Ebel, P., Meraner, A., Schmitt, M., & Zhu, X. X. (2020). Multisensor data fusion for cloud removal in global and all-season Sentinel-2 imagery. IEEE Transactions on Geoscience and Remote Sensing, 59(7), 5866–5878. https://doi.org/10.1109/TGRS.2020.3024744
- Feyisa, G. L., Meilby, H., Fensholt, R., & Proud, S. R. (2014). Automated water extraction index: A new technique for surface water mapping using Landsat imagery. Remote Sensing of Environment, 140, 23–35. https://doi.org/10.1016/j.rse.2013.08.029
- Gan, T. Y., Zunic, F., Kuo, C.-C., & Strobl, T. (2012). Flood mapping of Danube River at Romania using single and multi-date ERS2-SAR images. International Journal of Applied Earth Observation and Geoinformation, 18, 69–81. https://doi.org/10.1016/j.jag.2012.01.012
- Giustarini, L., Hostache, R., Matgen, P., Schumann, G. J.-P., Bates, P. D., & Mason, D. C. (2012). A change detection approach to flood mapping in urban areas using TerraSAR-X. IEEE Transactions on Geoscience and Remote Sensing, 51(4), 2417–2430. https://doi.org/10.1109/TGRS.2012.2210901
- Gourley, J. J., Hong, Y., Flamig, Z. L., Arthur, A., Clark, R., Calianno, M., Ruin, I., Ortel, T., Wieczorek, M. E., Kirstetter, P.-E., Clark, E., & Krajewski, W. F. (2013). A unified flash flood database across the United States. Bulletin of the American Meteorological Society, 94(6), 799–805. https://doi.org/10.1175/BAMS-D-12-00198.1
- Hall, J., Arheimer, B., Aronica, G. T., Bilibashi, A., Boháč, M., Bonacci, O., Borga, M., Burlando, P., Castellarin, A., Chirico, G. B., Claps, P., Fiala, K., Gaál, L., Gorbachova, L., Gül, A., Hannaford, J., Kiss, A., Kjeldsen, T. … Zaimi, K. (2015). A European flood database: Facilitating comprehensive flood research beyond administrative boundaries. Proceedings of the International Association of Hydrological Sciences, 370, 89–95. https://doi.org/10.5194/piahs-370-89-2015
- Hallegatte, S., Green, C., Nicholls, R. J., & Corfee-Morlot, J. (2013). Future flood losses in major coastal cities. Nature Climate Change, 3(9), 802–806. https://doi.org/10.1038/nclimate1979
- Hänsch, R., Persello, C., Vivone, G., Navarro, J. C., Boulch, A., Lefevre, S., & Le Saux, B. (2022). Data fusion contest 2022 (DFC 2022). IEEE Dataport. https://doi.org/10.21227/rjv6-f516
- Hirabayashi, Y., Mahendran, R., Koirala, S., Konoshima, L., Yamazaki, D., Watanabe, S., Kim, H., & Kanae, S. (2013). Global flood risk under climate change. Nature Climate Change, 3(9), 816–821. https://doi.org/10.1038/nclimate1911
- Islam, K. A., Uddin, M. S., Kwan, C., & Li, J. (2020). Flood detection using multi-modal and multi-temporal images: A comparative study. Remote Sensing, 12(15), 2455. https://doi.org/10.3390/rs12152455
- Jongman, B., Wagemaker, J., Revilla Romero, B., & Coughlan de Perez, E. (2015). Early flood detection for rapid humanitarian response: Harnessing near real-time satellite and twitter signals. ISPRS International Journal of Geo-Information, 4(4), 2246–2266. https://doi.org/10.3390/ijgi4042246
- Kemker, R., Salvaggio, C., & Kanan, C. (2018). Algorithms for semantic segmentation of multispectral remote sensing imagery using deep learning. ISPRS Journal of Photogrammetry and Remote Sensing, 145, 60–77. https://doi.org/10.1016/j.isprsjprs.2018.04.014
- Knyaz, V. (2019). Multimodal data fusion for object recognition. In Multimodal sensing: Technologies and applications (Vol. 11059, pp. 198–209). SPIE. https://doi.org/10.1117/12.2526067
- Kruczkiewicz, A., McClain, S., Bell, V., Warrick, O., Bazo, J., Mason, J., Vergara, H., & Horna, N. (2021). Earth observations for anticipatory action: Case studies in hydrometeorological hazards. In G.-J.-P. Schumann, (Eds.), Earth observation for flood applications (pp. 237–253). Elsevier. https://doi.org/10.1016/B978-0-12-819412-6.00011-0
- Lahat, D., Adali, T., & Jutten, C. (2015). Multimodal data fusion: An overview of methods, challenges, and prospects. Proceedings of the IEEE, 103(9), 1449–1477. https://doi.org/10.1109/JPROC.2015.2460697
- Layek, A. K., Gupta, A., Ghosh, S., & Mandal, S. (2016). Fast near-duplicate detection from image streams on online social media during disaster events. 2016 IEEE Annual India Conference (INDICON), Bangalore, India (pp. 1–6). IEEE. https://doi.org/10.1109/INDICON.2016.7839137
- Lehner, B., & Grill, G. (2013). Global river hydrography and network routing: Baseline data and new approaches to study the world’s large river systems. Hydrological Processes, 27(15), 2171–2186. https://doi.org/10.1002/hyp.9740
- Li, L., Vrieling, A., Skidmore, A., Wang, T., Muñoz, A.-R., & Turak, E. (2015). Evaluation of MODIS spectral indices for monitoring hydrological dynamics of a small, seasonally-flooded wetland in southern Spain. Wetlands, 35(5), 851–864. https://doi.org/10.1007/s13157-015-0676-9
- Li, P., Wang, M., Cheng, J., Xu, C., & Lu, H. (2012). Spectral hashing with semantically consistent graph for image indexing. IEEE Transactions on Multimedia, 15(1), 141–152. https://doi.org/10.1109/TMM.2012.2199970
- Li, Z., Wang, C., Emrich, C. T., & Guo, D. (2018). A novel approach to leveraging social media for rapid flood mapping: A case study of the 2015 South Carolina floods. Cartography and Geographic Information Science, 45(2), 97–110. https://doi.org/10.1080/15230406.2016.1271356
- Luppichini, M., Barsanti, M., Giannecchini, R., & Bini, M. (2022). Deep learning models to predict flood events in fast-flowing watersheds. Science of the Total Environment, 813, 151 885. https://doi.org/10.1016/j.scitotenv.2021.151885
- Lu, X., Wang, B., Zheng, X., & Li, X. (2017). Exploring models and data for remote sensing image caption generation. IEEE Transactions on Geoscience and Remote Sensing, 56(4), 2183–2195. https://doi.org/10.1109/TGRS.2017.2776321
- Malkin, N., Robinson, C., & Jojic, N. (2021). High-resolution land cover change from low-resolution labels: Simple baselines for the 2021 IEEE GRSS data fusion contest, ArXiv, abs/2101.01154. https://api.semanticscholar.org/CorpusID:230438744
- McFarland, M., Emanuele, R., Morris, D., Augspurger, T., & Microsoft Open Source. (2022, October). Microsoft/PlanetaryComputer. Zenodo. https://doi.org/10.5281/zenodo.7261897
- Prasad, S., Le Saux, B., Yokoya, N., & Hansch, R. (2020). 2018 IEEE GRSS Data Fusion Challenge – Fusion of Multispectral LiDAR and Hyperspectral Data. https://doi.org/10.21227/jnh9-nz89
- Rahman, M. S., & Di, L. (2017). The state of the art of spaceborne remote sensing in flood management. Natural Hazards, 85(2), 1223–1248. https://doi.org/10.1007/s11069-016-2601-9
- Rahnemoonfar, M., Chowdhury, T., Sarkar, A., Varshney, D., Yari, M., & Murphy, R. R. (2021). Floodnet: A high resolution aerial imagery dataset for post flood scene understanding. IEEE Access, 9(89), 644–89 654. https://doi.org/10.1109/ACCESS.2021.3090981
- Rudner, T. G., Rußwurm, M., Fil, J., Pelich, R., Bischke, B., Kopačková, V., & Biliński, P. (2019). Multi3net: Segmenting flooded buildings via fusion of multiresolution, multisensor, and multitemporal satellite imagery. Proceedings of the AAAI Conference on Artificial Intelligence (Vol. 33. pp. 702–709.
- Sampson, C. C., Smith, A. M., Bates, P. D., Neal, J. C., Alfieri, L., & Freer, J. E. (2015). A high-resolution global flood hazard model. Water Resources Research, 51(9), 7358–7381. https://doi.org/10.1002/2015WR016954
- Sampson, C. C., Smith, A. M., Bates, P. D., Neal, J. C., & Trigg, M. A. (2016). Perspectives on open access high resolution digital elevation models to produce global flood hazard layers. Frontiers in Earth Science, 3, 85. https://doi.org/10.3389/feart.2015.00085
- Schmitt, M., Hughes, L., Qiu, C., & Zhu, X. (2019). Sen12ms–a curated dataset of georeferenced multi-spectral Sentinel-1/2 imagery for deep learning and data fusion, Isprs Annals of the Photogrammetry. Remote Sensing & Spatial Information Sciences, 4, 153–160. https://doi.org/10.5194/isprs-annals-IV-2-W7-153-2019
- Schumann, G. J.-P. (2014). Fight floods on a global scale. Nature, 507(7491), 169–169. https://doi.org/10.1038/507169e
- Tellman, B., Sullivan, J., Kuhn, C., Kettner, A., Doyle, C., Brakenridge, G., Erickson, T., & Slayback, D. (2021). Satellite imaging reveals increased proportion of population exposed to floods. Nature, 596(7870), 80–86. https://doi.org/10.1038/s41586-021-03695-w
- Valgur, M., Kersten, J., Delucchi, L., Baier, G., Malte, U., Staniewicz, S., Kinyanjui, L. K., Bahr, V., Salembier, P., Martinber, K., Dwlsalmeida, G., Castro, C., & Raspopov, A. (2019). Sentinelsat/Sentinelsat: v0.13. https://doi.org/10.5281/zenodo.2629555
- Vieweg, S., Hughes, A. L., Starbird, K., & Palen, L. (2010). Microblogging during two natural hazards events: What twitter may contribute to situational awareness. Proceedings of the SIGCHI Conference on Human Factors in Computing Systems (CHI ‘10) (pp. 1079–1088). New York, NY, USA: Association for Computing Machinery. https://doi.org/10.1145/1753326.1753486
- Vogel, R. M., & Arumugam, S. (2016). Foreword. In T. E. Adams & T. C. Pagano (Eds.), Flood forecasting (pp. xvii–xx). Academic Press. https://doi.org/10.1016/B978-0-12-801884-2.10000-3
- Westerhoff, R., Kleuskens, M., Winsemius, H., Huizinga, H., Brakenridge, G., & Bishop, C. (2013). Automated global water mapping based on wide-swath orbital synthetic-aperture radar. Hydrology and Earth System Sciences, 17(2), 651–663. https://doi.org/10.5194/hess-17-651-2013
- Wilson, M., Bates, P., Alsdorf, D., Forsberg, B., Horritt, M., Melack, J., Frappart, F., & Famiglietti, J. (2007). Modeling large-scale inundation of Amazonian seasonally flooded wetlands. Geophysical Research Letters, 34(15). https://doi.org/10.1029/2007GL030156
- Winsemius, H. C., Aerts, J. C., Van Beek, L. P., Bierkens, M. F., Bouwman, A., Jongman, B., Kwadijk, J. C., Ligtvoet, W., Lucas, P. L., Van Vuuren, D. P., & Ward, P. (2016). Global drivers of future river flood risk. Nature Climate Change, 6(4), 381–385. https://doi.org/10.1038/nclimate2893
- Wood, E. F., Roundy, J. K., Troy, T. J., Van Beek, L., Bierkens, M. F., Blyth, E., de Roo, A., Döll, P., Ek, M., Famiglietti, J., Gochis, D., van de Giesen, N., Houser, P., Jaffé, P. R., Kollet, S., Lehner, B., Lettenmaier, D. P., Peters‐Lidard, C. … Wade, A.… (2011). Hyperresolution global land surface modeling: Meeting a grand challenge for monitoring earth’s terrestrial water. Water Resources Research, 47(5). https://doi.org/10.1029/2010WR010090
- Yamazaki, D., Kanae, S., Kim, H., & Oki, T. (2011). A physically based description of floodplain inundation dynamics in a global river routing model. Water Resources Research, 47(4). https://doi.org/10.1029/2010WR009726
- Yang, L., & Cervone, G. (2019). Analysis of remote sensing imagery for disaster assessment using deep learning: A case study of flooding event. Soft Computing, 23(13), 393–13 408. https://doi.org/10.1007/s00500-019-03878-8
- Yang, D., Liu, X., He, H., & Li, Y. (2019). Air-to-ground multimodal object detection algorithm based on feature association learning. International Journal of Advanced Robotic Systems, 16(3), 1729881419842 995. https://doi.org/10.1177/1729881419842995
- Yuan, Z., Zhang, W., Fu, K., Li, X., Deng, C., Wang, H., & Sun, X. (2022). Exploring a fine-grained multiscale method for cross-modal remote sensing image retrieval. IEEE Transactions on Geoscience and Remote Sensing, 60, 3078 451. https://doi.org/10.1109/TGRS.2021.3078451