
 ?Mathematical formulae have been encoded as MathML and are displayed in this HTML version using MathJax in order to improve their display. Uncheck the box to turn MathJax off. This feature requires Javascript. Click on a formula to zoom.
ABSTRACT
Long-term mapping of winter wheat is vital for assessing food security and formulating agricultural policies. Landsat data are the only available source for long-term winter wheat mapping in the North China Plain due to the fragmented landscape in this area. Although various methods, such as index-based methods, curve similarity-based methods and machine learning-based methods, have been developed for winter wheat mapping based on remote sensing, the former two often require satellite data with high temporal resolution, which are unsuitable for Landsat data with sparse time-series. Machine learning is an effective method for crop classification using Landsat data. Yet, applying machine learning for winter wheat mapping in the North China Plain encounters two main issues: 1) the lack of adequate and accurate samples for classifier training; and 2) the difficulty of training a single classifier to accomplish the large-scale crop mapping due to the high spatial heterogeneity in this area. To address these two issues, we first designed a sample selection rule to build a large sample set based on several existing crop maps derived from recent Sentinel data, with specific consideration of the confusion error between winter wheat and winter rapeseed in the available crop maps. Then, we developed an optimal zoning method based on the quadtree region splitting algorithm with classification feature consistency criterion, which divided the study area into six subzones with uniform classification features. For each subzone, a specific random forest classifier was trained and used to generate annual winter wheat maps from 2013 to 2022 using Landsat 8 OLI data. Field sample validation confirmed the high accuracy of the produced maps, with an average overall accuracy of 91.1% and an average kappa coefficient of 0.810 across different years. The derived winter wheat area also has a good correlation (R2 = 0.949) with census area at the provincial level. The results underscore the reliability of the produced annual winter wheat maps. Additional experiments demonstrate that our proposed optimal zoning method outperforms other zoning methods, including Köppen climate zoning, wheat planting zoning and non-zoning methods, in enhancing wheat mapping accuracy. It indicates that the proposed zoning is capable of generating more reasonable subzones for large-scale crop mapping.
1. Introduction
Wheat is the world’s third-largest food crop, serving as a staple food for nearly 40% of the global population (FAO, Citation2014). China is the world’s largest producer and consumer of wheat, with an annual production of about 124 million tons and consumption of 120 million tons (Zhao et al., Citation2018). The North China Plain is the predominant wheat-producing region in China. Long-term mapping of winter wheat in this area is crucial as it reflects the primary spatiotemporal dynamic of winter wheat cultivation in China. Such maps are essential for identifying the driving force behind the winter wheat changes and for guiding the formulation of agricultural policy (He et al., Citation2019; Qiu et al., Citation2017; Shen et al., Citation2022; Zhang et al., Citation2019).
Remote sensing is the most effective tool for large-scale crop mapping. It has been extensively applied in mapping various crops in different regions (Li et al., Citation2021; Massey et al., Citation2017; Nabil et al., Citation2022; Pan et al., Citation2012; Song & Wang, Citation2019; Wang et al., Citation2019; Wardlow et al., Citation2007; Yang et al., Citation2023). Generally, classification methods for winter wheat mapping using remote sensing can be categorized into three types: index-based methods, curve similarity-based methods and machine learning-based methods (Dong et al., Citation2020).
The first type of method designs empirical indices for winter wheat based on its unique phenological features. For instance, Pan et al. (Citation2012) proposed a crop proportion phenology index (CPPI) by capturing the unique two growth peaks at tillering and heading stages of winter wheat in Enhanced Vegetation Index (EVI) time-series. Tao et al. (Citation2017) developed a peak before winter feature (PBWF) index to map winter wheat in the North China Plain by emphasizing the unique greenness of PBW phase. Qiu et al. (Citation2017) proposed a method combining variations before and after estimated heading dates (CBAH) to identify winter wheat with a consideration of phenological variation across a large area. Qu and Zhang (Citation2021) proposed a winter wheat index (WWI) based on two distinctive contrasts (i.e. the contrast between the over-wintering and sowing stages, and the contrast between the heading and harvesting stages) from Normalized Difference Vegetation Index (NDVI) time series. Mapping winter wheat based on the empirical indices is highly efficient, but heavily dependent on clear images acquired in key phenological stages. Thus, such methods are often inapplicable when the key observations are missing. The second type of method identifies winter wheat by measuring the similarity between the observed vegetation index (VI) curve and a standard VI curve of winter wheat (Belgiu & Csillik, Citation2018; Dong et al., Citation2020; Li et al., Citation2021; Li et al., Citation2021; Maus et al., Citation2016; Sun et al., Citation2012; Yang et al., Citation2019; Zhang et al., Citation2019; Zhang et al., Citation2019). Various similarity measurements, such as Euclidean distance, Kullback–Leibler divergence (KLD), and Jeffries-Matusita (JM) distance, have been used for winter wheat classification based on VI time-series (Sun et al., Citation2012). To address the issue of the shifts and distortions of VI curves induced by phenological variation across a large area, similarity based on dynamic time matching (DTW) was also applied to winter wheat mapping (Dong et al., Citation2020; Dong et al., Citation2020). The curve similarity-based method utilizes all available data in the time-series, thus has a relatively slight reliance on the effective observations of key phenological periods. However, it necessitates the dense time-series observations to match the observed and the reference curves. In summary, both the index-based and curve similarity-based methods require frequent observations to ensure the cloud-free observations in the key phenological periods or a time-series curve throughout the growing season. Thus, most of these studies utilize moderate resolution imaging spectroradiometer (MODIS) or Sentinel-2A/B data, which have a relatively high temporal resolution. However, the spatial resolution of MODIS is too coarse to support the accurate mapping of winter wheat in the North China Plain due to the fragmented landscape in this area. And the Sentinel-2A/B data, although having a higher spatial resolution, were not available before 2017. Thus, the Landsat data is the only available source that can be used for long-term mapping of winter wheat in this region. Unfortunately, the sparse time-series of Landsat poses a challenge in effectively applying the aforementioned methods.
The third type of method, machine learning-based methods, such as random forest (RF), support vector machine (SVM), and deep learning methods, have demonstrated effectiveness in crop classification using time-series data in recent years (Asgarian et al., Citation2016; Liang & Wang, Citation2019; Liu et al., Citation2018; Nasrallah et al., Citation2018; Skakun et al., Citation2017; Weiss et al., Citation2020; Xu et al., Citation2020). Zhang et al. (Citation2021) utilized random forest to map winter wheat in the North China Plain based on the EVI time-series features extracted from Landsat data. Wang et al. (Citation2019) applied random forest for winter wheat classification based on the harmonic fitting results of Landsat time-series and achieved more than 80% classification accuracy across different regions and years in the United States. These studies highlight the effectiveness of machine learning-based methods in exploring features from sparse Landsat time-series data for winter wheat mapping. Despite the promising performance of machine learning in crop classification, winter wheat mapping by machine learning encounters two major challenges: 1) obtaining sufficient labeled samples for training classifiers; and 2) zoning an entire large region into different subzones to reduce the spatial heterogeneity. Selecting high-confidence samples from existing crop maps is a practical and effective approach for the first challenge (Li et al., Citation2021). For instance, regions with consistent labels among different land cover maps are often considered as high-confidence and could be used for training classifier (Jin et al., Citation2019; Liu & Chen, Citation2018). Conversely, the edge pixels are often considered as unreliable and should be filtered out (Tran et al., Citation2022). Such a strategy is feasible for winter wheat mapping in the North China Plain because several crop maps in this area have been produced based on Sentinel-2 data (Dong et al., Citation2020; Dong et al., Citation2020; Yang et al., Citation2023; Zang et al., Citation2023). These maps could be used to generate reliable samples for training Landsat data. Although such strategies guarantee the reliability of the selected training samples, the sample representativeness becomes a concern because the difficult or confused samples may be filtered out (Li et al., Citation2021). Thus, it is important to carefully design the sample generation rules that is able to balance the tradeoff between the reliability and the representativeness, with consideration of the regional characteristics and the error types of the available crop maps. Regarding the second challenge, some studies divided the study area into a group of square or hexagonal grids (Dong et al., Citation2020; Huang et al., Citation2022) and trained different classifiers for different grids. However, such a strategy is somewhat arbitrary as it does not consider the varying spatial heterogeneity across different grids. Zoning with climatic or agro-ecological zones is another commonly used strategy for large-scale crop mapping (Li et al., Citation2021; Liu et al., Citation2022; Yang et al., Citation2021). The crop growth situation and the crop varieties within a single subzone tend to be more similar, thus a single classifier is adequate for crop classification in a single subzone. However, the classification process is influenced not only by the crop characteristics but also by the background land cover features and the data availability. Therefore, the climatic or agro-ecological zoning is not an optimal zoning strategy for crop classification either. To date, rare attention was paid to the development of an optimal zoning method specifically tailored for crop classification.
Due to the different challenges associated with different methods mentioned above, there are currently no publicly available data of long-term winter wheat maps in the North China Plain up to now. To fill this gap, this study proposes a novel machine learning-based approach for winter wheat mapping. Firstly, we generated a training sample set (comprising wheat and non-wheat samples) from several existing crop maps in the study area by considering both the sample reliability and representativeness. Secondly, we developed an optimal zoning method for crop classification by combining a measure of inter-regional classification feature consistency with the quadtree region splitting algorithm. Based on the generated sample set and the derived optimal subzones, we trained specific classifiers for Landsat data in each subzone. Then the classifiers were used to generate annual winter wheat maps from 2013 to 2022 in the North China Plain.
2. Materials
2.1. Study area
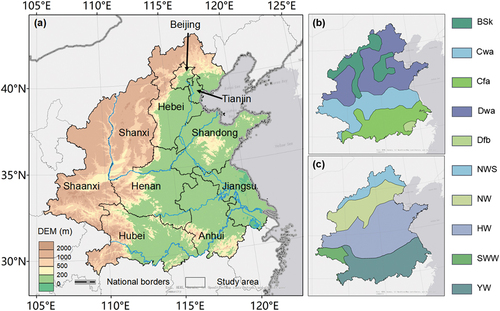
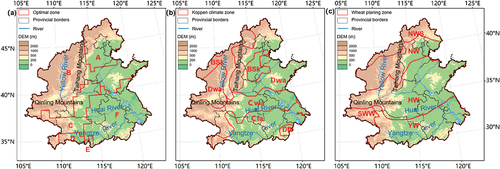
This research focuses on the North China Plain, the largest wheat-producing region in China, contributing 60% of the national wheat production (Yu et al., Citation2002). The region encompasses 10 provinces and municipalities, including Beijing, Tianjin, Hebei, Shandong, Henan, Anhui, Jiangsu, Hubei, Shaanxi, and Shanxi (). The study area exhibits significant climatic heterogeneity, including five subzones based on the Köppen climate zoning system (Peel et al., Citation2007) (): BSk (Arid Steppe Cold), Dwa (Cold Dry Winter Hot Summer), Cwa (Temperate Dry Winter Hot Summer), Dfb (Cold Without dry season Warm Summer), and Cfa (Temperate Without dry season Hot Summer). There are also large differences in the agricultural characteristics including farming systems, variety types, and production levels. It is commonly divided into five subzones () according to the previous study on wheat planting zoning in China (Cai, Citation2010): NWS (Northwest spring wheat area), NW (Northern winter wheat area), HW (Huang-Huai winter wheat area), SWW (Southwest winter wheat area), YW (Yangtze River winter wheat area).
Figure 1. Study area (a), Köppen climate zoning (b) and wheat planting zoning (c).
2.2. Data
2.2.1. Landsat images and preprocessing
In this study, Landsat-8 surface reflectance imagery (Collection 2 Level 2 Tier 1) from 2013 to 2023 was acquired from Google Earth Engine. Given the growing season of winter wheat spans across 2 years, we selected Landsat time series from September 1 of the sowing year to June 30 of the subsequent year for winter wheat classification of each sowing year. To alleviate the cloud contamination effects, the reflectance value of the pixel with a cloud flag was replaced with an interpolated value from the two nearest valid observation. Other than the multi-spectral bands (Band 2–7, corresponding to blue, green, red, near infrared, shortwave infrared 1 and shortwave infrared 2 respectively), a suite of spectral indices were also calculated to enhance the crop spectral features for classification based on the previous studies on winter wheat mapping and winter rapeseed mapping () (Chen et al., Citation2019; Dong et al., Citation2020; Qiu et al., Citation2015; Tian et al., Citation2021; Wang et al., Citation2017; Xiao et al., Citation2005; Yang et al., Citation2021; Zang et al., Citation2020, Citation2023; Zhang et al., Citation2021). The cloud probability band was also input as a classification feature to represent the quality of the valid observation.
Table 1. Spectral indices used for classification input.
2.2.2. Field survey data
To verify the accuracy of the mapping results, we collected survey samples from multiple sources ( and ): 1) Field surveys were conducted in the sowing years of 2017, and 2022, resulting in 1001, and 587 point samples, respectively; 2) Visual interpretation of ultra-high-resolution images acquired by Unmanned Aerial Vehicles (UAVs) during the 2018 and 2019 sowing years yielded 93 and 223 polygon samples; and 3) the open-access point samples (Qiu et al., Citation2022) for the sowing years of 2015, 2016, 2020, 2021 were downloaded.
Figure 2. Distribution of field survey samples.
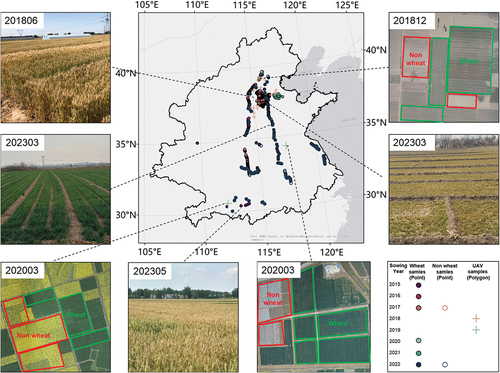
Table 2. Information of field survey samples.
2.2.3. Other data
We obtained existing crop mapping products in this area (), including three winter wheat maps and a rapeseed map, for automatic sample generation. In addition, the provincial census data on the annual sowing area of winter wheat from 2013 to 2021 were acquired from the China Agriculture and Forestry Database (CAFD) (https://data.stats.gov.cn/easyquery.htm?cn=C01) for comparison.
Table 3. Crop mapping products used for sample generation.
3. Method
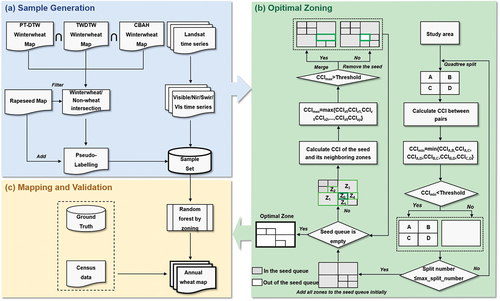
The proposed winter wheat mapping methodology consists of three parts (): (a) a large number of wheat and non-wheat samples are automatically generated using existing crop mapping products; (b) the study area is optimally zoned into different subzones based on the classification feature heterogeneity; (c) a specific classifier is trained in each subzone with corresponding training samples and is used for mapping winter wheat from 2013 to 2022 based on Landsat-8 OLI data.
Figure 3. The workflow of the proposed winter wheat mapping approach ((a) Sample Generation; (b) Optimal Zoning; (c) Mapping and Validation).
3.1. Sample generation
We used three winter wheat maps and a rapeseed map in the sowing year of 2017 to generate training samples for Landsat data. The sample generation consists of two main steps ().
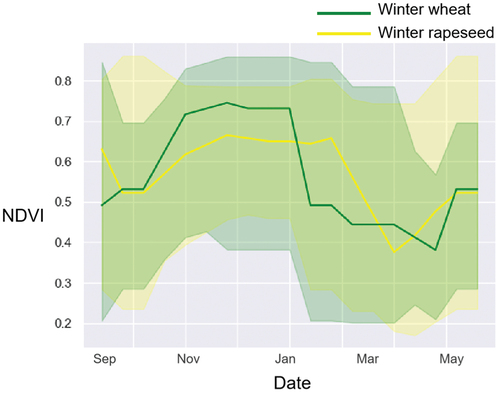
In the first step, areas with consistent labels among the four mapping data were selected to guarantee the reliability of the generated samples. Specifically, pixels classified as winter wheat in all three winter wheat maps and as non-rapeseed in the rapeseed map were selected for the wheat sample set. Similarly, pixels classified as non-wheat in all three winter wheat maps were selected for the non-wheat sample set. Such a selection rule effectively minimizes the inclusion of potentially erroneous samples, but it also results in an under representation of the generated sample set. A major problem is that there are few rapeseed samples that can be selected into the non-wheat sample set because winter wheat and rapeseed have similar growth seasons and phenological features during growth, leading to overlap between spectral features (), thus they are often misclassified as the winter wheat in several winter wheat maps (Yang et al., Citation2023). This lack of rapeseed samples hinders the effective training of the classifier to distinguish the winter wheat from the rapeseed.
Figure 4. Landsat-8 satellite-based normalized vegetation index (NDVI) time-series variation curves for winter wheat and rapeseed.
In the second step, thus, a part of rapeseed pixels was randomly selected from the rapeseed map and added into the non-wheat sample set to increase its representativeness. The number of added rapeseed pixels () was determined based on census data:
where and
are the census areas of rapeseed and winter wheat in the study area in 2017; S is the total area of the study area; and N is the number of wheat samples generated. The inclusion of rapeseed samples ensured the diversity and representativeness of the non-wheat sample set.
3.2. An optimal zoning method for crop classification
Classification feature heterogeneity means that the classifier relies on classification features with different levels of importance in different zones. The underlying reason for this variation is that the classification process is influenced by a combination of crop spectral features, background feature type and remote sensing data availability. Therefore, the core principle of zoning is to maximize the internal similarity of classification features within one zone while minimizing the similarity across different zones. However, traditional climatic zoning and agro-ecological zoning primarily consider climate or crop suitability features, which are inconsistent with the remote sensing classification features. To address this issue, we introduced a novel classification feature consistency index (CCI) to measure the similarity of classification features between two zones. Then, we developed an optimal zoning method utilizing the classical quadtree region splitting algorithm with a splitting and merging criterion of the CCI.
3.2.1. Classification feature consistency index (CCI)
The CCI is used to measure the similarity of classification features between two zones. If two zones exhibit good consistency of classification features, they should be merged into a single zone where only one classifier is trained. In contrast, if a zone exhibits internal inconsistency in the classification features, it should be split into multiple subzones where different classifiers are trained. However, due to the high dimensionality of the classification features and their complex nonlinear relationship with the classification results, the consistency of the classification features between different zones is difficult to be expressed explicitly. To avoid this difficulty, we suggest that the similarity in classification features between two zones can be represented by the consistency degree of the outputs of two classifiers trained separately with the samples in these two zones.
Assuming that Zone A and Zone B contain training sample sets TA and TB respectively, we use TA and TB to train two classifiers fA and fB. Here, the training sample set of each zone consists of 2000 wheat and 2000 non-wheat samples randomly selected from the sample set generated in Section 3.1. Then, a test sample set is randomly selected from all other samples in Zone A and Zone B, and are classified using fA and fB, respectively. The consistency between the two classification results can be quantified by the overall accuracy metric (OAA,B):
A higher OAA, B indicates a higher consistency between two classification results and thus a higher similarity of the classification features of the two zones. However, we must also consider the presence of Bayesian errors (ErrorBayes) of the classifiers, i.e. completely random classification errors. Even classifiers trained on sample sets with identical features will have random inconsistencies in their classification results on the same test samples. It may cause the OAA,B index to underestimate the consistency of classification features between different zones. Therefore, in this study, CCIA,B between two zones is defined as the sum of OAA,B and ErrorBayes:
where ErrorBayes can be approximated as the training error due to the fact that the training error of a model infinitely converges to the Bayesian error when there are adequate training samples (Zhou, Citation2016). In this study, we computed the average training error rates of the two classifiers as the Bayesian error.
3.2.2. Quadtree region splitting based on classification feature consistency
Building upon the quadtree region splitting algorithm (Horowitz & Pavlidis, Citation1976), we developed a zoning process based on the CCI criterion. It consists of two main steps ().
In the first step, a top-down splitting process was applied to the study area using a quadtree algorithm. The entire study area is firstly divided into four subzones labeled as A, B, C, and D. The CCIs between every pair of subzones (CCIA,B, CCIA,C, CCIA,D, CCIB,C, CCIB,D, and CCIC,D) were calculated using the method described in Section 3.2.1. If the minimum value of these indices (CCImin) is below a predefined threshold, it indicates a significant difference in the classification features among the four subzones. In such case, the quadtree region splitting result is retained. Conversely, if CCImin is above the threshold, it suggests no difference in classification features among subzones, and the region splitting process is halted. Subsequently, the quadtree region splitting process is repeated for the newly obtained zone through splitting until either there are no zones that can be further split (CCImin > Threshold). In addition, the splitting will also be stopped if the available samples in the subzone are less than 2000 or the maximum number of splits (Split_Num) has been reached.
The second step involves a bottom-up merging process. After the splitting process, a queue of zones to be grown is obtained. Initially, all subzones are considered as seed points, meaning they are potential zones to be merged. From the seed queue, a zone Z0 is selected. Its neighboring zones, denoted as , are then searched. The CCI between zone Z0 and its neighboring zones is sequentially compared. The neighboring zone with the highest CCI, denoted as Zmax, is selected.
If the exceeds the predefined threshold, indicating no significant differences between two neighboring zones, the two zones are merged. The resulting merged zones are subsequently appended to both the “to be grown” queue and the seed queue. Conversely, if
is below the threshold, it signifies substantial classification feature difference between zone Z0 and all its neighboring zones. Consequently, zone Z0 is eliminated from the seed queue, preventing its merge with other zones. This iterative process continues until the seed queue becomes empty, ultimately yielding the final merged zone results.
3.2.3. Details of the zoning method implementation
Random forest was chosen as the classifier to compute the CCI, owing to its robustness and efficiency in large-scale land cover and crop classification studies (Li et al., Citation2021; Liu et al., Citation2018; Tran et al., Citation2022; Xing et al., Citation2021). Two parameters should be set during the quadtree region splitting process: the maximum number of splits (Max_split_number) and the split-merge threshold (Threshold). For our study area, Max_split_numer was set to 5, which correspond to the smallest zoning unit in the crop classification. And the CCI threshold was set to 0.97 through empirical trials.
3.3. Annually mapping of winter wheat and accuracy validation
After generating a substantial number of training samples and obtaining a set of optimal subzones, we randomly selected 4,000 wheat samples and 4,000 non-wheat training samples in each subzone to train its own classifier. Although the subzones have different spatial sizes, we use the equal number of training samples in each subzone because the heterogeneity of the classification features is comparable among different subzones generated by the proposed splitting-merging process. It is also noted that we use a larger training sample size than that used in the zoning stage (2,000 wheat samples and 2,000 non-wheat samples) because the subzones become larger and contain more available samples after the merging process. These trained classifiers of the subzones were then employed for annually winter wheat mapping from 2013 to 2022 using Landsat 8 OLI data (). To assess the mapping accuracy, we calculated various metrics including overall accuracy (OA), producer accuracy (PA), and user accuracy (UA) using the available validation samples for each year. Furthermore, we compare the winter wheat area derived from our produced maps with the census area obtained from the China Agriculture and Forestry Database (CAFD) at province level.
4. Results
4.1. Optimal zoning result
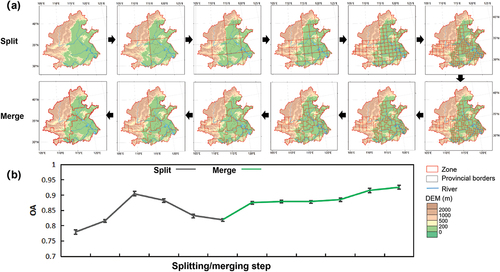
Based on the proposed optimal zoning method, the entire study area was divided into six subzones (), and it is evident that the zoning differs significantly from the commonly used climatic and wheat planting zones (). The intermediate steps of the optimal zoning process are shown in , where the study area was first split and then merged until the proposed CCI-based criterion was reached. For each splitting and merging step, the classification accuracies (OA) were also calculated based on the validation samples (). In the splitting process, the OA first increased and then decreased. This is reasonable because the classification difficulty commonly decreases when a large study area is divided into smaller subzones. However, when the divided subzones are too small, the generated samples probably become less representative because the sample diversity decreases, leading to a low classification accuracy. In the merging process, the accuracy continuously increases and reaches the highest value in the final merging step. It indicates that the proposed optimal zoning method is able to acquire the best zoning map for winter wheat classification.
Figure 5. Optimal zoning results and the distribution of training samples in each subzone.
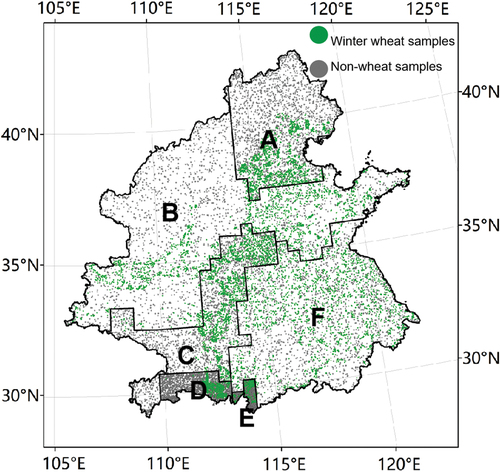
Figure 6. (a) The splitting and the merging process of the study area. (b) The change of classification accuracy (OA) during the splitting and merging process.
4.2. Winter wheat mapping results
Based on the optimal zoning result and the generated samples (), six different classifiers for each subzone were trained by the corresponding training samples. Then, these trained classifiers were respectively used for classifying winter wheat from 2013 to 2022 in their corresponding subzones. Finally, the 30 m winter wheat maps in the North China Plain from 2013 to 2023 were generated.
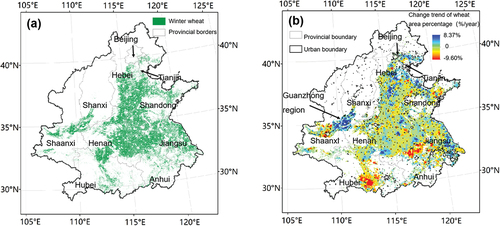
The winter wheat maps generated from Landsat data () show similar spatial patterns with previous studies (Dong et al., Citation2020; Qiu et al., Citation2017; Zhang et al., Citation2021). However, our data additionally reflect the long-term changes of winter wheat thanks to the long time series of Landsat 8 OLI since 2013. We calculated winter wheat coverage in 5-km grid for each year and conducted linear trend analysis for each grid from 2013 to 2022. As shown in , there is a significant spatial heterogeneity in the long-term trend of winter wheat coverage. In general, obvious decreasing trends are observed in southern boundary of winter wheat planting region, including southern Hubei and central Anhui, which might be induced by the dryland-to-paddy policy in these two provinces (Yang, Citation2021; Zhu, Li, et al., Citation2021; Zhu, Zou, et al., Citation2021). In comparison, areas with increasing trends are more prominent in the northern part of the study area, such as Hebei, northern Shandong, and northeastern part of Guanzhong region (a plain region across Shaanxi and Shanxi provinces). This northward shift of winter wheat planting areas might be attributed to a combination of factors, such as expanded irrigation and climate warming (Fan et al., Citation2020). Furthermore, scattered areas with decreasing winter wheat could also be found around the urban areas due to the urban expansion.
Figure 7. (a) Produced 30 m winter wheat map in 2022; (b) change trend of winter wheat from 2013 to 2022 at 5-km grid. The urban boundary is accessed from He et al. (Citation2019).
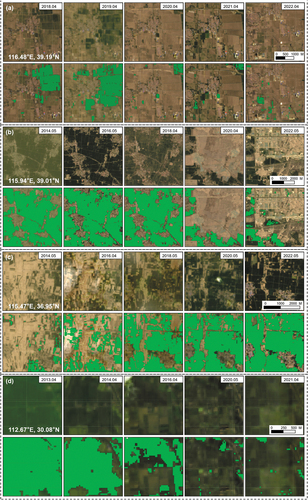
illustrates four detailed examples of the winter wheat changes. Overall, the extracted winter wheat match well with the Landsat images acquired in April or May when the winter wheat should show a dark green color. (located in Gu’an County, Hebei Province) shows a decrease of winter wheat recently, due to the cropland fallow since 2020; (located in Xiong’an New Area, Hebei Province) shows a significant reduction of winter wheat, because of the large-scale construction in Xiong’an New Area an; (located in Zhoushan County, Henan Province) illustrates a rapid increase of winter wheat, driven by the increased irrigation in the region; (located in Jiangling County, Hubei Province) shows a decrease of winter wheat, because of the conversion of winter wheat fields into paddy rice fields.
Figure 8. Spatial details of winter wheat maps in different years.
4.3. Quality evaluation of winter wheat map
4.3.1. Accuracy assessment based on field survey samples
The classification accuracy of winter wheat was calculated for each year from 2015 to 2022, based on the field survey sample. Since the samples accessed from Qiu et al. (Citation2022) only contained positive samples without negative samples, only the PA was calculated. As shown in , the OA for each year ranged from 85.2% to 94.3%; the Kappa coefficient ranged from 0.692 to 0.873; and the PA ranged from 75.0% to 97.0%. The accuracy validation results indicate that our method can map the winter wheat with reasonable accuracies across different years.
Table 4. The accuracy indices of the winter wheat maps from 2015 to 2023.
4.3.2. Comparison with census data
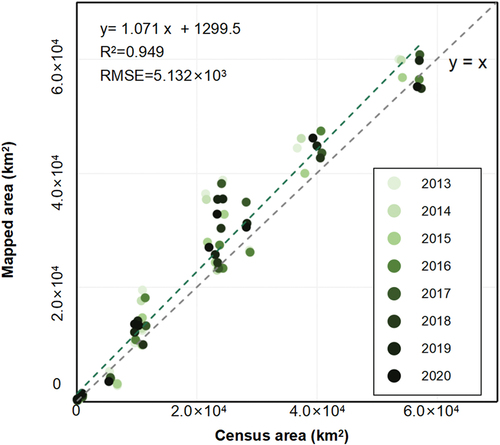
The winter wheat areas obtained from the winter wheat maps were compared with the census area at the provincial level for the years of 2013–2020. shows that there is a good consistency between the mapped area and the census area with an R-squared value of 0.949.
Figure 9. The comparison of the mapped area of winter wheat with the census area at the province level during 2013–2020.
4.3.3. Comparison with existing mapping products derived from Sentinel-2 data
Since Sentinel-2 data have higher spatial and temporal resolution, it is reasonable to assume that the winter wheat maps derived from Sentinel-2 data have higher reliability and thus can also serve as references for evaluating our produced winter wheat maps based on Landsat data. As shown in , our produced winter wheat maps have good agreement with the maps derived from Sentinel-2 data. The OA calculated based on these Sentinel-2 derived maps range from 80.4% to 89.3%. Considering that these Sentinel-2 derived maps also contain classification errors (officially reported OA ranged from 88% to 94%), such a level of agreement indicates that our produced map based on Landsat data is not much worse than the Sentinel-derived maps.
Table 5. Accuracies assessment based on Sentinel-2 derived maps.
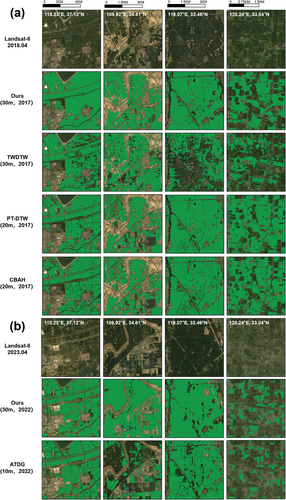
further shows several detailed comparisons of our winter wheat maps and other Sentinel-2 derived maps for the years of 2017 and 2022. In general, our map shows similar spatial pattern to the Sentinel-2 derived maps in most examples. However, the Sentinel-2 derived maps, especially ATDG, exhibit more detailed parcel boundaries due to the higher spatial resolution.
Figure 10. Details of winter wheat maps obtained using the optimal zoning method and other methods for the years 2017(a) and 2022(b).
5. Discussion
5.1. Superiority of the proposed optimal zoning method in crop mapping
Previous studies have made many improvements in various aspects of crop mapping with remote sensing data, including fusing more data sources (Blickensdörfer et al., Citation2022; Gu et al., Citation2023; Werner et al., Citation2024), developing more advanced classifiers or matching methods (Belgiu & Csillik, Citation2018; Li et al., Citation2024; Wang et al., Citation2021); generating training samples with less labor (Belgiu et al., Citation2021; Xuan et al., Citation2023; Zang et al., Citation2023); and designing more effective classification features (Qu et al., Citation2021; Xu et al., Citation2023; Zang et al., Citation2020). However, little attention was paid to improving the zoning strategy commonly used in large-scale crop mapping. The zoning strategies used in previous studies were often originally designed for other purposes (e.g. climate classification, agricultural management), thus might not be suitable for crop mapping.
This study firstly developed a specific zoning method for crop mapping by maximizing the internal similarity of classification features within one zone while minimizing the similarity across different zones. To verify the superiority of the proposed optimal zoning method over traditional zoning methods in winter wheat mapping, we compared the classification accuracy based on the proposed zoning method with those based on Köppen climate zoning, the wheat planting zoning (), and the non-zoning. For each zoning method, we repeated the 10 times of the classification experiments (4,000 positive and negative training samples of winter wheat each randomly selected in each subzone). The mean and standard deviation of OA are reported in . Accuracies were only evaluated for the years of 2017, 2018, 2019, and 2022, because the sample sets in these years include both the positive and negative samples. The superiority of the proposed optimal zoning methods over other zoning methods varies across different years due to the different spatial distribution of the validation samples. In 2017 and 2018, the validation samples are mainly located in northern areas () with relatively simple crop structures, resulting in high classification accuracies for all zoning methods. In 2019, the validation sample set includes samples from rapeseed planting areas in Hubei province. Due to the similar phenology of rapeseed and winter wheat in this region, traditional zoning methods show particularly low classification accuracies for this year. In contrast, the proposed zoning method achieves much better accuracy by generating a subzone D () in this area to train a specific classifier that can effectively discriminate between these two crops.
Table 6. Accuracy assessment of the classification results based on different zoning methods. Bold font and underlining indicate the highest and second highest accuracy, respectively.
We also investigate the accuracy improvements of the optimal zoning method relative to non-zoning method in different subzones (). Significant improvements can be found in subzones D and F due to their diversified planting types such as winter rapeseed, paddy rice, and other crops with growing seasons overlapping with winter wheat. Such complicated cropping structure greatly reduces the classification accuracy and thus provides improvement opportunities for the optimal zoning method. For subzones A and B, the crop diversity is low (there is few other winter crop), leading to high classification accuracies. Thus, the potential benefits of optimal zoning are limited. For subzones C and E, both methods achieve 100% accuracy; however, it is meaningless due to the very limited validation samples. In summary, the optimal zoning method mainly contributes to reducing the classification difficulty in the areas with complicated cropping types, which is consistent with its designing objective.
Table 7. Accuracy improvements of the optimal zoning compared to non-zoning in different subzones.
We further examine the similarity and the difference in the spatial pattern of different zoning results (). Large mountain ranges often form the important boundaries among different zones due to the significant climate difference between two sides of the mountains. For example, all of the three zoning maps have similar boundaries near Qinling mountains range, a famous boundary between north and south China. And the proposed zoning and Köppen climate zoning maps also show consistent boundaries near Taihang mountain range. But Taihang mountain range is not included in the wheat planting zoning because of no wheat planting in its west side. Huaihe river, also a famous landmark for separating north and south China due to the 0°C isotherm in January, is also considered to be a zoning boundary in both the Köppen climate zoning and the wheat planting zoning. However, there is actually no sharp climate transition across this river. Thus, it is reasonable to be excluded in our proposed zoning result. Instead, our method generates a north-south boundary between zones C and F, which does not exist in the other two traditional zoning results. It might be induced by the elevation rise from east to west in this region. In the northeast part of the study area, the proposed zoning boundaries are somehow coincided with both the Köppen climate zoning boundaries and the administrative boundary of Shandong and Hebei province. Both the climate and the agricultural policy difference could contribute to separate subzones in this area. In summary, the proposed zoning method directly considers the classification features that could vary across different natural and artificial conditions, thus can better benefit the crop mapping compared to the traditional zoning methods that mainly consider the natural factors.
Figure 11. Different spatial patterns of different zoning results: optimal zoning (a), Köppen climate zoning (b) and wheat planting zoning (c).
5.2. Sensitivity analysis of CCI threshold
The CCI threshold (Threshold) is the most important parameter in the splitting and merging process, deciding whether to split down or merge up. In order to explore the effect of threshold setting on zoning and crop mapping accuracy, we compared the zoning and classification results at different CCI thresholds, i.e. 0.99, 0.97, and 0.95 ( and ). It shows that the classification accuracy achieves the best when the CCI threshold is 0.97.
Figure 12. Optimal zoning results based on different CCI thresholds: 0.95 (a), 0.97 (b) and 0.99 (c).
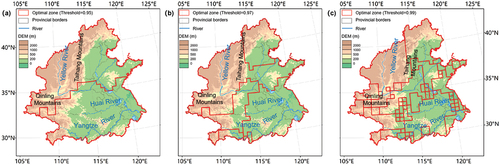
Table 8. Comparison of classification result accuracy of different CCI thresholds. Bold font indicates that accuracy ranks first, and underlining indicates that accuracy ranks second.
Overall, if the CCI threshold is too high (0.99), the generated subzones become relatively small, leading to inadequate diversity of generated samples for classifier training. And if the threshold is too low (0.95), the subzones become too large, resulting in high heterogeneity of classification features. However, no matter how the CCI threshold is set, 0.97, or 0.99, or 0.95, the corresponding mapping accuracy is better than that of other zoning methods.
5.3. The potential and challenges of winter wheat mapping in a longer term
In this study, we mapped the winter wheat only after 2013 because Landsat-8 OLI was launched in 2013. However, the Landsat 5 TM and Landsat 7 ETM+, which have similar spatial, spectral and temporal resolutions with Landsat 8 OLI, have been available since 1984. They thus can support for a much longer term of winter wheat mapping in the study area. Unfortunately, it remains several challenges in transferring the proposed mapping approach to the elder Landsat data. Firstly, while the USGS assumes that all Level 1 Landsat data are radiometrically calibrated and consistently geolocated, spectral inconsistency is still inevitable due to the different wavelength sensitivities (Sulla-Menashe et al., Citation2016; Teillet et al., Citation2001). Secondly, the proposed optimal zoning for winter wheat mapping was determined based on the CCI calculated in 2017. While it is reasonable to assume that the optimal zoning is stable in a ten-year term, it is likely to shift in the longer term due to the climate change, crop technique advancement and economic development. Thirdly, we trained the classifiers by the training samples in 2017 and used them to classify winter wheat in the other years. It is acceptable if the classification features keep stable across different years. However, the wheat growth condition and phenology could vary across different years, thus also alter the classification features and lead to a decrease in classification accuracy (Gadiraju & Vatsavai, Citation2020). Therefore, it is crucial to develop transferring technology with the consideration of the sensor inconsistence, zoning shifting and classification feature varying, for a longer-term mapping of winter wheat in the study area.
5.4. Remaining issues
There are some remaining issues to be resolved in this study.
First, although the 30 m resolution is the highest available for long-term mapping of winter wheat, mixed pixels are still unavoidable. Mixed pixel effect not only introduces about classification uncertainty but also brings about area bias in the fragmented agricultural landscapes (Dong et al., Citation2022; Ozdogan & Woodcock, Citation2006). Thus, it should be noticed that the comparison with census data provides only a reference rather than a rigorous validation (Dong et al., Citation2020). Spectral unmixing or sub-pixel mapping techniques offer potential solutions to the issue. However, obtaining the required training samples with coverage information presents significant challenges, thereby limiting their applications at a large scale.
Second, insufficient observation frequency is another serious challenge for crop mapping based on Landsat data. Previous studies have demonstrated that insufficient effective observations can significantly reduce the mapping accuracy of crops such as winter wheat and winter rapeseed (Dong et al., Citation2020; Zang et al., Citation2020). Spatio-temporal fusion of Landsat and MODIS data might offer a potential solution to this issue.
Third, although we particularly consider excluding winter rapeseed in the proposed approach, there are still other crops that could potentially be confused with winter wheat. For example, garlic is an important winter crop with a similar phenology to winter wheat in this study area, which is likely to introduce mapping errors in our produced winter wheat maps. However, such mapping errors should be marginal for two reasons. On the one hand, garlic accounts for a very small proportion (less than 1%) of winter crops in the study area. On the other hand, although garlic is not specifically considered in the mapping approach, the strict selection rule of the winter wheat samples (i.e. the intersection of three wheat maps) helps to exclude the misclassified garlic pixels in the sample set.
Finally, the validation samples were mainly collected along roadsides for saving cost, which may lead to biases in the representativeness of the samples. Rigorous accuracy assessment requires better sampling strategies (Olofsson et al., Citation2014; Stehman & Foody, Citation2019), but these are constrained by labor and time costs.
6. Conclusion
This study established a mapping approach for annual winter wheat in the North China Plain based on Landsat data. Firstly, a sample generation rule is specifically designed for winter wheat mapping in this area by considering the confusion between winter wheat and rapeseed in the existing crop mapping products. Secondly, an optimal zoning method for crop classification is proposed to reduce the classification feature heterogeneity over a large area. Comparative experiments showed that the proposed zoning method effectively helps to improve the mapping accuracy compared to the traditional zoning methods. It indicates that the proposed optimal zoning method can reduce the classification difficulty on the sparse Landsat time-series data and thus has potential to support long-term crop mapping.
With the proposed approach, we produced annual 30 m winter wheat map from 2013–2022 in the North China Plain, which achieves a good classification accuracy and a good agreement with census data. The produced map is opened for public to support further analysis of spatiotemporal dynamics of winter wheat in the North China Plain.
Disclosure statement
No potential conflict of interest was reported by the author(s).
Data availability statement
The Landsat-8 data used in this paper are available in GEE. The produced wheat maps are shared in GEE (https://code.earthengine.google.com/0bedafeeb6899c8a92e23a4e64782206?noload=1) and Zenodo (https://doi.org/10.5281/zenodo.10522027).
The validation data in this study are available from the corresponding author, X.H.Chen, upon reasonable request.
Additional information
Funding
Notes on contributors

Yifei Liu
Yifei Liu received the B.E. degree in remote sensing science and technology from China University of Geosciences, Wuhan, China, in 2021. She is pursuing the M.E. degree with the school of Beijing Normal University, Beijing, China. Her research interest is crop mapping with remote sensing.

Xuehong Chen
Xuehong Chen received the B.S. degree in physics and the M.S. degree in civil engineering from Beijing Normal University, Beijing, China, in 2006 and 2009, respectively, and the Ph.D. degree in earth and environmental science from Nagoya University, Nagoya, Japan, in 2012. He is currently an Associate Professor with the Institute of Remote Sensing Science and Engineering, Faculty of Geographical Science, Beijing Normal University. His research interests include data fusion, change detection and crop mapping with remote sensing.

Jin Chen
Jin Chen received the B.A. and M.S. degrees in geography from Beijing Normal University, Beijing, China, in 1989 and 1992, respectively, and the Ph.D. degree in civil engineering from Kyushu University, Fukuoka, Japan, in 2000. He was a Postdoctoral Researcher with the University of California, Berkeley, CA, USA, from 2000 to 2001, and with the National Institute of Environmental Studies, Tsukuba, Japan, from 2001 to 2004. He is currently a Professor with the Institute of Remote Sensing Science and Engineering, Faculty of Geographical Science, Beijing Normal University. His research interests include remote sensing modeling and vegetation parameter retrieval through the inversion of remote sensing model.
References
- Asgarian, A., Soffianian, A., & Pourmanafi, S. (2016). Crop type mapping in a highly fragmented and heterogeneous agricultural landscape: A case of central Iran using multi-temporal Landsat 8 imagery. Computers Electronics in Agriculture, 127, 531–540. https://doi.org/10.1016/j.compag.2016.07.019
- Belgiu, M., Bijker, W., Csillik, O., & Stein, A. (2021). Phenology-based sample generation for supervised crop type classification. International Journal of Applied Earth Observation and Geoinformation, 95, 102264. https://doi.org/10.1016/j.jag.2020.102264
- Belgiu, M., & Csillik, O. (2018). Sentinel-2 cropland mapping using pixel-based and object-based time-weighted dynamic time warping analysis. Remote Sensing of Environment, 204, 509–523. https://doi.org/10.1016/j.rse.2017.10.005
- Blickensdörfer, L., Schwieder, M., Pflugmacher, D., Nendel, C., Erasmi, S., & Hostert, P. (2022). Mapping of crop types and crop sequences with combined time series of Sentinel-1, Sentinel-2 and Landsat 8 data for Germany. Remote Sensing of Environment, 269, 112831. https://doi.org/10.1016/j.rse.2021.112831
- Cai, Z. G. (2010). 中国小麦种植区划研究 [Study on Chinese wheat planting regionalization]. Journal of Triticeae Crops, 30(5), 886–895.
- Chen, X., Guo, Z., Chen, J., Yang, W., Yao, Y., Zhang, C., & Cao, X. (2019). Replacing the red band with the red-SWIR band (0.74 ρ red+ 0.26 ρ swir) can reduce the sensitivity of vegetation indices to soil background. Remote Sensing, 11(7), 851. https://doi.org/10.3390/rs11070851
- Dong, Q., Chen, X., Chen, J., Yin, D., Zhang, C., Xu, F., & Stein, A. (2022). Bias of area counted from sub-pixel map: Origin and correction. Science of Remote Sensing, 6, 100069. https://doi.org/10.1016/j.srs.2022.100069
- Dong, Q., Chen, X., Chen, J., Zhang, C., Liu, L., Cao, X., & Cui, X. (2020). Mapping winter wheat in North China using Sentinel 2A/B data: A method based on phenology-time weighted dynamic time warping. Remote Sensing, 12(8), 1274. https://doi.org/10.3390/rs12081274
- Dong, J., Fu, Y., Wang, J., Tian, H., Fu, S., Niu, Z., & Yuan, W. (2020). Early-season mapping of winter wheat in China based on Landsat and Sentinel images. Earth System Science Data, 12(4), 3081–3095. https://doi.org/10.5194/essd-12-3081-2020
- Fan, L., Chen, S., Liang, S., Sun, X., Chen, H., You, L., & Yang, P. (2020). Assessing long-term spatial movement of wheat area across China. Agricultural Systems, 185, 102933. https://doi.org/10.1016/j.agsy.2020.102933
- FAO. (2014). FAO statistical yearbook 2014, Asia and the Pacific, food and agriculture. (pp. 71–99).
- Gadiraju, K. K., & Vatsavai, R. R. (2020). Comparative analysis of deep transfer learning performance on crop classification. Proceedings of the 9th ACM SIGSPATIAL International Workshop on Analytics for Big Geospatial Data, Article 1. https://doi.org/10.1145/3423336.3431369
- Gu, Z., Chen, J., Chen, Y., Qiu, Y., Zhu, X., & Chen, X. (2023). Agri-Fuse: A novel spatiotemporal fusion method designed for agricultural scenarios with diverse phenological changes. Remote Sensing of Environment, 299, 113874. https://doi.org/10.1016/j.rse.2023.113874
- He, C., Liu, Z., Gou, S., Zhang, Q., Zhang, J., & Xu, L. (2019). Detecting global urban expansion over the last three decades using a fully convolutional network. Environmental Research Letters, 14(3), 034008. https://doi.org/10.1088/1748-9326/aaf936
- He, T., Xie, C., Liu, Q., Guan, S., & Liu, G. (2019). Evaluation and comparison of random forest and A-LSTM networks for large-scale winter wheat identification. Remote Sensing, 11(14), 1665. https://doi.org/10.3390/rs11141665
- Horowitz, S. L., & Pavlidis, T. (1976). Picture segmentation by a tree traversal algorithm. Journal of the ACM, 23(2), 368–388. https://doi.org/10.1145/321941.321956
- Huang, X., Song, Y., Yang, J., Wang, W., Ren, H., Dong, M., & Li, J. (2022). Toward accurate mapping of 30-m time-series global impervious surface area (GISA). International Journal of Applied Earth Observation and Geoinformation, 109, 102787. https://doi.org/10.1016/j.jag.2022.102787
- Jin, S., Homer, C., Yang, L., Danielson, P., Dewitz, J., Li, C., & Howard, D. (2019). Overall methodology design for the United States national land cover database 2016 products. Remote Sensing, 11(24), 2971. https://doi.org/10.3390/rs11242971
- Liang, S., & Wang, J. (2019). Advanced remote sensing: Terrestrial information extraction and applications. pp. 871–914 https://doi.org/10.1016/B978-0-12-815826-5.00024-6. https://public.ebookcentral.proquest.com/choice/publicfullrecord.aspx?p=5986168
- Li, M., Feng, X., & Belgiu, M. (2024). Mapping tobacco planting areas in smallholder farmlands using Phenological-Spatial-Temporal LSTM from time-series Sentinel-1 SAR images. International Journal of Applied Earth Observation and Geoinformation, 129, 103826. https://doi.org/10.1016/j.jag.2024.103826
- Li, S., Li, F., Gao, M., Li, Z., Leng, P., Duan, S., & Ren, J. (2021). A new method for winter wheat mapping based on spectral reconstruction technology. Remote Sensing, 13(9), 1810. https://doi.org/10.3390/rs13091810
- Liu, T., & Chen, X. (2018). Application of deep learning in globeland30-2010 product refinement. The International Archives of the Photogrammetry. Remote Sensing Spatial Information Sciences, 42, 1111–1116. https://doi.org/10.5194/isprs-archives-XLII-3-1111-2018
- Liu, J., Feng, Q., Gong, J., Zhou, J., Liang, J., & Li, Y. (2018). Winter wheat mapping using a random forest classifier combined with multi-temporal and multi-sensor data. International Journal of Digital Earth, 11(8), 783–802. https://doi.org/10.1080/17538947.2017.1356388
- Liu, Y., Zhang, H., Zhang, M., Cui, Z., Lei, K., Zhang, J., & Ji, P. (2022). Vietnam wetland cover map: Using hydro-periods Sentinel-2 images and google earth engine to explore the mapping method of tropical wetland. International Journal of Applied Earth Observation and Geoinformation, 115, 103122. https://doi.org/10.1016/j.jag.2022.103122
- Li, C., Xian, G., Zhou, Q., & Pengra, B. W. (2021). A novel automatic phenology learning (APL) method of training sample selection using multiple datasets for time-series land cover mapping. Remote Sensing of Environment, 266, 112670. https://doi.org/10.1016/j.rse.2021.112670
- Li, R., Xu, M., Chen, Z., Gao, B., Cai, J., Shen, F., & Chen, D. (2021). Phenology-based classification of crop species and rotation types using fused MODIS and Landsat data: The comparison of a random-forest-based model and a decision-rule-based model. Soil Tillage Research, 206, 104838. https://doi.org/10.1016/j.still.2020.104838
- Massey, R., Sankey, T. T., Congalton, R. G., Yadav, K., Thenkabail, P. S., Ozdogan, M., & Meador, A. J. S. (2017). MODIS phenology-derived, multi-year distribution of conterminous U.S. crop types. Remote Sensing of Environment, 198, 490–503. https://doi.org/10.1016/j.rse.2017.06.033
- Maus, V., Cmara, G., Cartaxo, R., Sanchez, A., Ramos, F. M., & Queiroz, G. R. D. (2016). A time-weighted dynamic time warping method for land-use and land-cover mapping. IEEE Journal of Selected Topics in Applied Earth ObservationsRemote Sensing, 9(8), 3729–3739. https://doi.org/10.1109/JSTARS.2016.2517118
- Nabil, M., Zhang, M., Wu, B., Bofana, J., & Elnashar, A. (2022). Constructing a 30 m African cropland layer for 2016 by integrating multiple remote sensing, crowdsourced, and auxiliary datasets. Big Earth Data, 6(1), 54–76. https://doi.org/10.1080/20964471.2021.1914400
- Nasrallah, A., Baghdadi, N., Mhawej, M., Faour, G., Darwish, T., Belhouchette, H., & Darwich, S. (2018). A novel approach for mapping wheat areas using high resolution Sentinel-2 images. Sensors, 18(7), 2089. https://doi.org/10.3390/s18072089
- Olofsson, P., Foody, G. M., Herold, M., Stehman, S. V., Woodcock, C. E., & Wulder, M. A. (2014). Good practices for estimating area and assessing accuracy of land change. Remote Sensing of Environment, 148, 42–57. https://doi.org/10.1016/j.rse.2014.02.015
- Ozdogan, M., & Woodcock, C. E. (2006). Resolution dependent errors in remote sensing of cultivated areas. Remote Sensing of Environment, 103(2), 203–217. https://doi.org/10.1016/j.rse.2006.04.004
- Pan, Y., Li, L., Zhang, J., Liang, S., Zhu, X., & Sulla-Menashe, D. (2012). Winter wheat area estimation from MODIS-EVI time series data using the crop proportion phenology index. Remote Sensing of Environment, 119, 232–242. https://doi.org/10.1016/j.rse.2011.10.011
- Peel, M. C., Finlayson, B. L., & McMahon, T. A. (2007). Updated world map of the Köppen-Geiger climate classification. Hydrology Earth System Sciences, 11(5), 1633–1644. https://doi.org/10.5194/hess-11-1633-2007
- Qiu, B., Hu, X., Chen, C., Tang, Z., Yang, P., Zhu, X., & Jian, Z. (2022). Maps of cropping patterns in China during 2015–2021. Scientific Data, 9(1), 479. https://doi.org/10.1038/s41597-022-01589-8
- Qiu, B., Li, W., Tang, Z., Chen, C., & Qi, W. (2015). Mapping paddy rice areas based on vegetation phenology and surface moisture conditions. Ecological Indicators, 56, 79–86. https://doi.org/10.1016/j.ecolind.2015.03.039
- Qiu, B., Luo, Y., Tang, Z., Chen, C., Lu, D., Huang, H., & Xu, W. (2017). Winter wheat mapping combining variations before and after estimated heading dates. ISPRS Journal of Photogrammetry & Remote Sensing, 123, 35–46. https://doi.org/10.1016/j.isprsjprs.2016.09.016
- Qu, C., Li, P., & Zhang, C. (2021). A spectral index for winter wheat mapping using multi-temporal Landsat NDVI data of key growth stages. ISPRS Journal of Photogrammetry & Remote Sensing, 175, 431–447. https://doi.org/10.1016/j.isprsjprs.2021.03.015
- Shen, R., Dong, J., Yuan, W., Han, W., Ye, T., & Zhao, W. (2022). A 30 m resolution distribution map of maize for China based on Landsat and Sentinel images. Journal of Remote Sensing, 5, 1–12. https://doi.org/10.34133/2022/9846712
- Skakun, S., Vermote, E., Roger, J. C., & Franch, B. (2017). Combined use of Landsat-8 and Sentinel-2A images for winter crop mapping and winter wheat yield assessment at regional scale. AIMS Geosciences, 3(2), 163. https://doi.org/10.3934/geosci.2017.2.163
- Song, Y., & Wang, J. (2019). Mapping winter wheat planting area and monitoring its phenology using Sentinel-1 backscatter time series. Remote Sensing, 11(4), 449. https://doi.org/10.3390/rs11040449
- Stehman, S. V., & Foody, G. M. (2019). Key issues in rigorous accuracy assessment of land cover products. Remote Sensing of Environment, 231, 111199. https://doi.org/10.1016/j.rse.2019.05.018
- Sulla-Menashe, D., Friedl, M. A., & Woodcock, C. E. (2016). Sources of bias and variability in long-term Landsat time series over Canadian boreal forests. Remote Sensing of Environment, 177, 206–219. https://doi.org/10.1016/j.rse.2016.02.041
- Sun, H., Xu, A., Lin, H., Zhang, L., & Mei, Y. (2012). Winter wheat mapping using temporal signatures of MODIS vegetation index data. International Journal of Remote Sensing, 33(16), 5026–5042. https://doi.org/10.1080/01431161.2012.657366
- Tao, J.-B., Wu, W.-B., Zhou, Y., Wang, Y., & Jiang, Y. (2017). Mapping winter wheat using phenological feature of peak before winter on the North China Plain based on time-series MODIS data. Journal of Integrative Agriculture, 16(2), 348–359. https://doi.org/10.1016/S2095-3119(15)61304-1
- Teillet, P., Barker, J., Markham, B., Irish, R., Fedosejevs, G., & Storey, J. (2001). Radiometric cross-calibration of the Landsat-7 ETM+ and Landsat-5 TM sensors based on tandem data sets. Remote Sensing of Environment, 78(1–2), 39–54. https://doi.org/10.1016/S0034-4257(01)00248-6
- Tian, H., Wang, Y., Chen, T., Zhang, L., & Qin, Y. (2021). Early-season mapping of winter crops using Sentinel-2 optical imagery. Remote Sensing, 13(19), 3822. https://doi.org/10.3390/rs13193822
- Tran, K. H., Zhang, H. K., McMaine, J. T., Zhang, X., & Luo, D. (2022). 10 m crop type mapping using Sentinel-2 reflectance and 30 m cropland data layer product. International Journal of Applied Earth Observation and Geoinformation, 107, 102692. https://doi.org/10.1016/j.jag.2022.102692
- Wang, S., Azzari, G., & Lobell, D. B. (2019). Crop type mapping without field-level labels: Random forest transfer and unsupervised clustering techniques. Remote Sensing of Environment, 222, 303–317. https://doi.org/10.1016/j.rse.2018.12.026
- Wang, C., Chen, J., Wu, J., Tang, Y., Shi, P., Black, T. A., & Zhu, K. (2017). A snow-free vegetation index for improved monitoring of vegetation spring green-up date in deciduous ecosystems. Remote Sensing of Environment, 196, 1–12. https://doi.org/10.1016/j.rse.2017.04.031
- Wang, Y., Zhang, Z., Feng, L., Ma, Y., & Du, Q. (2021). A new attention-based CNN approach for crop mapping using time series Sentinel-2 images. Computers and Electronics in Agriculture, 184, 106090. https://doi.org/10.1016/j.compag.2021.106090
- Wardlow, B. D., Egbert, S. L., & Kastens, J. H. (2007). Analysis of time-series MODIS 250 m vegetation index data for crop classification in the U.S. Central Great Plains. Remote Sensing of Environment, 108(3), 290–310. https://doi.org/10.1016/j.rse.2006.11.021
- Weiss, M., Jacob, F., & Duveiller, G. (2020). Remote sensing for agricultural applications: A meta-review. Remote Sensing of Environment, 236, 111402. https://doi.org/10.1016/j.rse.2019.111402
- Werner, J. P. S., Belgiu, M., Bueno, I. T., Dos Reis, A. A., Toro, A. P. S. G. D., Antunes, J. F. G., Figueiredo, G. K. D. A., Lamparelli, R. A. C., Magalhães, P. S. G., Coutinho, A. C., Esquerdo, J. C. D. M., & Figueiredo, G. K. D. A. (2024). Mapping integrated crop–livestock systems using fused Sentinel-2 and PlanetScope time series and deep learning. Remote Sensing, 16(8), 1421. https://doi.org/10.3390/rs16081421
- Xiao, X., Boles, S., Frolking, S., Salas, W., Moore Iii, B., Li, C., & Zhao, R. (2002). Observation of flooding and rice transplanting of paddy rice fields at the site to landscape scales in China using VEGETATION sensor data. International Journal of Remote Sensing, 23(15), 3009–3022. https://doi.org/10.1080/01431160110107734
- Xiao, X., Boles, S., Liu, J., Zhuang, D., Frolking, S., Li, C., & Moore, B. (2005). Mapping paddy rice agriculture in southern China using multi-temporal MODIS images. Remote Sensing of Environment, 95(4), 480–492. https://doi.org/10.1016/j.rse.2004.12.009
- Xiao, X., Zhang, Q., Braswell, B., Urbanski, S., Boles, S., Wofsy, S., & Ojima, D. (2004). Modeling gross primary production of temperate deciduous broadleaf forest using satellite images and climate data. Remote Sensing of Environment, 91(2), 256–270. https://doi.org/10.1016/j.rse.2004.03.010
- Xing, H., Hou, D., Wang, S., Yu, M., & Meng, F. (2021). O-LCMapping: A Google Earth Engine-based web toolkit for supporting online land cover classification. Earth Science Informatics, 14(1), 529–541. https://doi.org/10.1007/s12145-020-00562-6
- Xuan, F., Dong, Y., Li, J., Li, X., Su, W., Huang, X., & Zhang, Y. (2023). Mapping crop type in Northeast China during 2013–2021 using automatic sampling and tile-based image classification. International Journal of Applied Earth Observation and Geoinformation, 117, 103178. https://doi.org/10.1016/j.jag.2022.103178
- Xu, F., Li, Z., Zhang, S., Huang, N., Quan, Z., Zhang, W., & Prishchepov, A. V. (2020). Mapping winter wheat with combinations of temporally aggregated Sentinel-2 and Landsat-8 data in Shandong province, China. Remote Sensing, 12(12), 2065. https://doi.org/10.3390/rs12122065
- Xu, S., Zhu, X., Chen, J., Zhu, X., Duan, M., Qiu, B., & Cao, R. (2023). A robust index to extract paddy fields in cloudy regions from SAR time series. Remote Sensing of Environment, 285, 113374. https://doi.org/10.1016/j.rse.2022.113374
- Yang, D. (2021). 安徽首个“旱改水”稻田喜获丰收 [Anhui’s first “drought to water” paddy field has achieved a bumper harvest]. https://www.moa.gov.cn/xw/qg/202109/t20210930_6378693.htm
- Yang, G., Li, X., Liu, P., Yao, X., Zhu, Y., Cao, W., & Cheng, T. (2023). Automated in-season mapping of winter wheat in China with training data generation and model transfer. ISPRS Journal of Photogrammetry & Remote Sensing, 202, 422–438. https://doi.org/10.1016/j.isprsjprs.2023.07.004
- Yang, Y., Tao, B., Ren, W., Zourarakis, D. P., Masri, B. E., Sun, Z., & Tian, Q. (2019). An improved approach considering intraclass variability for mapping winter wheat using multitemporal MODIS EVI images. Remote Sensing, 11(10), 1191. https://doi.org/10.3390/rs11101191
- Yang, G., Yu, W., Yao, X., Zheng, H., Cao, Q., Zhu, Y., & Cheng, T. (2021). AGTOC: A novel approach to winter wheat mapping by automatic generation of training samples and one-class classification on Google Earth Engine. International Journal of Applied Earth Observation and Geoinformation, 102, 102446. https://doi.org/10.1016/j.jag.2021.102446
- Yu, Z., Tian, Q., Pan, Q., Yu, S., Wang, D., Duan, C., & Niu, Y. (2002). Theory and practice of ultra-high-yield cultivation of winter wheat in Huanghuai wheat area. The Crop Journal, 28(5), 577–585.
- Zang, Y., Chen, X., Chen, J., Tian, Y., Shi, Y., Cao, X., & Cui, X. (2020). Remote sensing index for mapping canola flowers using MODIS data. Remote Sensing, 12(23), 3912. https://doi.org/10.3390/rs12233912
- Zang, Y., Qiu, Y., Chen, X., Chen, J., Yang, W., Liu, Y., & Cao, X. (2023). Mapping rapeseed in China during 2017–2021 using Sentinel data: An automated approach integrating rule-based sample generation and a one-class classifier (RSG-OC). GIScience & Remote Sensing, 60(1), 2163576. https://doi.org/10.1080/15481603.2022.2163576
- Zhang, W., Brandt, M., Prishchepov, A. V., Li, Z., & Fensholt, R. (2021). Mapping the dynamics of winter wheat in the North China Plain from dense Landsat time series (1999 to 2019). Remote Sensing, 13(6), 1170. https://doi.org/10.3390/rs13061170
- Zhang, D., Fang, S., She, B., Zhang, H., Jin, N., Xia, H., & Ding, Y. (2019). Winter wheat mapping based on Sentinel-2 data in heterogeneous planting conditions. Remote Sensing, 11(22), 2647. https://doi.org/10.3390/rs11222647
- Zhang, X., Qiu, F., & Qin, F. (2019). Identification and mapping of winter wheat by integrating temporal change information and Kullback–Leibler divergence. International Journal of Applied Earth Observation Geoinformation, 76, 26–39. https://doi.org/10.1016/j.jag.2018.11.002
- Zhao, G., Chang, X., Wang, D., Tao, Z., Wang, Y., Yang, Y., & Zhu, Y. (2018). General situation and development of wheat production. Crops, 18(4), 1–7.
- Zhou, Z.-H. (2016). 机器学习 [Machine learning]. Tsinghua University Press.
- Zhu, H., Li, B., & Wang, Z. (2021). 旱地改水田 产量翻一番 湖北4年“旱改水”6.5万亩 [Conversion of dry land into paddy fields, doubling the output of Hubei Province’s “Drought to Water” in 4 years has been 65,000 mu]. https://zrzyt.hubei.gov.cn/bmdt/ztzl/yggdbhjyjyyd/mtbdyggd/202101/t20210106_3201229.shtml
- Zhu, H., Zou, H., Yang, W., & Wang, B. (2021). 湖北基本形成数量、质量、生态一体耕地保护格局 [Hubei has basically formed a pattern of cultivated land protection integrating quantity, quality and ecology]. https://www.hubei.gov.cn/hbfb/bmdt/202101/t20210121_3298458.shtml