
 ?Mathematical formulae have been encoded as MathML and are displayed in this HTML version using MathJax in order to improve their display. Uncheck the box to turn MathJax off. This feature requires Javascript. Click on a formula to zoom.
ABSTRACT
The native Caledonian pinewoods of Scotland, UK contain a unique and unexplored biodiversity of below-ground ectomycorrhizal fungi which may constitute a valuable source of microbial genetics resources for woodland restoration. In this study we test the sampling effort, taxa detection (ectomycorrhiza morpho-anatotyping) and relative abundance measurements (ectomycorrhizal root tip number vs. dry weight) of below-ground ectomycorrhizal fungal communities in a planted Pinus sylvestris Caledonian woodland. A total of 18 replicated sampling points were set up at differential distance along a 125 m transect, in a 50-yr-old, stem exclusion: thicket phase, Pinus sylvestris pinewood stand. A total of 11 ectomycorrhizal morpho-anatotypes were detected from 6689 ectomycorrhizal root tips counted and weighing 992.6 mg dry weight. The major ectomycorrhizal taxa were Meliniomyces bicolor and Cortinarius spp. accounting ~50% of total pine roots. A highly significant relationship (r2 = 0.16, p < 0.000) was found between Sørensen dissimilarity in soil cores and distance apart. In this study, the spatial arrangement of samples indicated that over short distances the dissimilarity was lower in contrast with the longer distances along the transect.
1. Introduction
Scots pine (Pinus sylvestris L.) is the most widespread European pine and is distributed from southern boreal habitats to Atlantic and central continental Europe (Richardson and Rundel Citation1998; Tóth et al. Citation2017). In Scotland, the remnant Caledonian native pine woodland (Pinus sylvestris L.) is a species-rich habitat harbouring a characteristic and specialised biota (Quine and Humphrey Citation2010; Bain Citation2013). Ectomycorrhizal (EcM) fungi are species-rich communities playing a central role in ecosystem processes in boreal forests and native pinewoods (Dahlberg Citation2001; Lindea van der et al. Citation2010; Tedersoo et al. Citation2014). They establish complex bipartite and tripartite mutualistic networks with overstorey and understorey plants allowing them to share nutrient resources and relaxing the competition (Villarreal-Ruiz et al. Citation2004, Citation2012; Fodor Citation2013). Estimations of fungal species richness in Scotland suggest that 8000–15,000 taxa are present and between 35 and 40% are mycorrhizal, mainly based on above-ground sporocarp presence (Watling Citation1997; Iskipp Citation2000). In contrast, the EcM fungi below-ground presence and dynamics is poorly studied in native pine woodlands regardless of its relevance to generate predictive tools to improve management plans to overcome the impact of human activities that restricted their 1.5 million ha original surface to less than 1% (Newton et al. Citation2001). For this reason, restoration of native Caledonian pinewoods represents a priority for the EU Habitats and Species Directive, the UK’s Biodiversity Action Plan and the Scottish Natural Heritage, the statutory conservation agency, in order to maintain their unique biodiversity and sustainable use in the long term (Hampson and Peterken Citation1998; Forestry Commission Citation2003; Featherstone Citation2010).
This research was undertaken to study the biodiversity and ecology of below-ground ectomycorrhizal fungi in a Scots pine (P. sylvestris L.) planted woodland to answer the following questions:
What is the relationship between number and dry weight (DW) of ectomycorrhizal fungal morpho-anatotypes as descriptors of relative abundance?
Are samples taken close together more similar in species composition and community structure than to those taken further apart?
2. Materials and methods
2.1. Study area and stand description
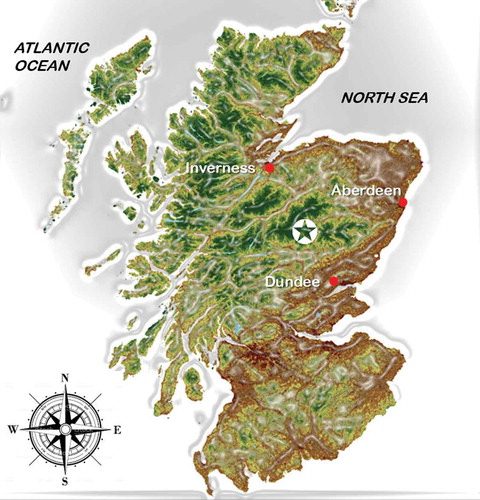
This study was performed in a 50-year-old, (stem exclusion: thicket phase, sensu Mason et al. Citation2004) planted (Pinus sylvestris L.) Caledonian pinewood (stand 8, 57° 02ʹ 01ʺ N, 002° 52ʹ 52ʺ W, 214 m a.s.l.) as part of an EcM chronosequence pilot study at Glen Tanar Nature Reserve, Aberdeenshire, NE Scotland, UK (National Grid Reference No. 470950, see Villarreal-Ruiz Citation2006), . Because it was difficult to locate a 50-year-old naturally regenerated stand in order to construct the full chronosequence, the problem was overcome by selecting a large plantation within the forest area that met most of Oliver’s (Citation1982) selection criteria. Scots pine seedlings were planted from local seeds and some naturally regenerated seedlings might also be present (Callander and Mac Kenzie Citation1991; Atterson and Ross Citation2002). The study site is part of the Grampian Region and the climate is of the cool temperate oceanic type (Steven and Carlisle Citation1959; Clark Citation1995). The soil type in Glen Tanar is predominantly freely drained podzols derived from granitic solifluction deposits with a thin layer of raw humus (FitzPatrick Citation1977; Vickers and Palmer Citation2000). The overstorey vegetation is dominated by Pinus sylvestris L., and the understorey plants are Calluna vulgaris L. (Hull.), Vaccinium myrtillus L, V. vitis-idaea L. and Deschampsia flexuosa (L.) Trim.
Figure 1. Study area geographic location (✪) of Glen Tanar National Nature Reserve with Caledonian native pine woodland (Pinus sylvestris L.), after Anonymous (Citation2014)
2.2. Experimental design and samples processing
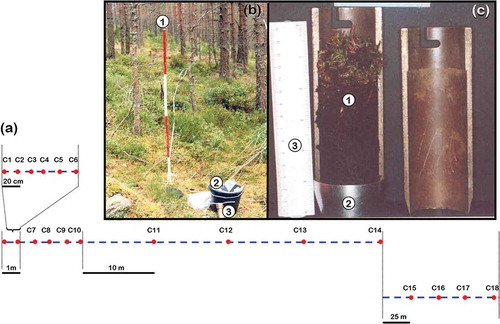
A total of 18 soil cores were taken at set distances along a 125 m transect with replicated sampling points as follows: (1) 6 each 20 cm (2) 4 each 1 m, (3) 4 each 10 m, (4) 4 each 25 m, . Soil cores were taken with a split soil core sampler (diameter 4.5 cm; depth 12 cm, ). Each time the corer was driven into the soil profile as far as possible and obstructions such as stones and rocks affected the depth sampled were removed. Soil samples were wrapped with aluminium foil, placed in sealed plastic bags and transferred to the lab and kept in a cold room at 4°C until processed. Each soil sample was individually soaked for 30 min in tap water and transferred to a sieve series (0.5, 1.0 and 2 mm).
Figure 2. Sampling procedure along a 125 m transect with replicated sampling points at differential set points in a 50-year-old Scots pine (stand 8) at Glen Tanar Nature Reserve. (a) Illustration of transect line (dashed line) and replicated sampling points (dots). (b) Field sampling procedure in stand 8. (1) transect line, (2) soil samples in a bucket, (3) split soil core sampler. (c) Detail of soil sample (1) in the split soil core sampler (2) (3) Ruler 15 cm
2.3. Data collection and measurements
The living EcM root tips were carefully hand-sorted using fine forceps under a Wild M5 Heerbrugg stereo microscope (12×) by wet sieving. The pine ectomycorrhizal root tips were characterised morphologically (morphotyping) using mantle colour and texture of extramatical hyphae or rhizomorphs, root tip branching pattern, and presence, colour and general morphology and texture of extramatrical hyphae and/or rhizomorphs (Agerer Citation1991). Each ectomycorrhizal morphotype was photographed in a Leica stereomicroscope and the most abundant ectomycorrhizal types were briefly described following Agerer (Citation2002). In order to corroborate the homogeneity of EcM morphotypes groups, the anatomical characterisation (anatotyping) was performed by free hand longitudinal and cross-sections (in order to confirm the presence of a Hartig net), mantle scrapes and rhizomorphs mounted first in water and later in 85% lactic acid (Agerer Citation1991). The mounted slides were observed using phase contrast, differential interference contrast and fluorescence microscopy at ×40 to ×100 magnification, and photographed using a Carl Zeiss Axiophot D-7082 photomicroscope. Duplicates of single EcM types were preserved in FEA solution (formaldehyde:ethanol 70%: acetic acid (5: 90: 5 v/v/v) as voucher specimens following Agerer et al. (Citation2000). Sorted homogeneous EcM morpho-anatotypes were counted and dried at 60°C for 48 h and placed in a perspex single door desiccator chamber with silica gel and subsequently the DW of each EcM morpho-anatotype taxa was recorded using a Mettler AJ100 analytical balance. A database of all ectomycorrhizal types detected was constructed based on macro and/or microscopic observations following Agerer (Citation2002), and subsequently identified using classical methods. The exploration type of each EcM morph-anatotype was determined accordingly with Agerer (Citation2001).
2.4. Data analysis
The multivariate analysis was performed using different routines in PC-ORD version 3.0 and 4.0 for Windows (McCune and Mefford Citation1999) as follows: The total number of EcM taxa across all the sample replicated points along the transect was estimated accordingly with McCune and Grace (Citation2002). The “true” species richness in the study area was estimated using: (a) the first-order jackknife estimator (Heltshe & Forrester Citation1993; Palmer Citation1990):
where S = the observed number of species; r1 = the number of species occurring in one sample unit; n = the number of sample units.
(b) The second-order jackknife estimator (Burnham and Overton Citation1979; Palmer Citation1991):
where r2 = number of species occurring in exactly two sample units.
A dissimilarity index between all possible pairs of cores along the transect was computed using routines in PC-ORD. The index used was the Sørensen (Bray and Curtis Citation1957) ecological distance measure (McCune and Mefford Citation1999). Statistics were performed by using SPSS® v. 12.0.1. package. EcM fungal parameters: number of EcM root tips versus DW were plotted by regression analyses (Dytham Citation2003).
3. Results
3.1. Species richness and frequency
A total of 11 EcM morpho-anatotypes fungal groups were recognised (, ) from a total of 6689 pine root tips recovered and counted from the 18 soil cores taken along the transect. The total biomass of the EcM morpho-anatotypes fungal community was 992.6 mg DW.
The major EcM fungal taxa were Meliniomyces bicolor Hambl. and Sigler and Cortinarius spp. colonising around 50% of pine roots, followed by nine taxa colonising the remaining pine roots. It is important to state that all pine roots recovered were colonised by EcM fungi. The five most frequent EcM taxa found in soil cores along the transect were: Cortinarius sp. (14/18) followed by M. bicolor (13/18), “Unknown” and Lactarius sp. (7/18) each, and Cenococcum geophilum Fr. (6/18).
Table 1. EcM taxa found in the Scots pine plantation based on morpho- and/or anatomy, exploration-types and percentage of overall relative abundance in number
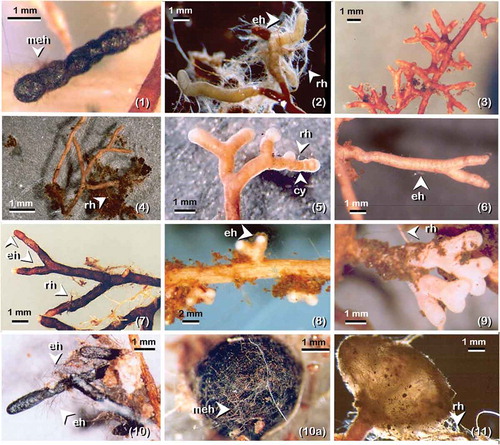
Figure 3. Ectomycorrhizal morpho-anatotypes associated with Pinus sylvestris in the experimental stand at Glen Tanar Nature Reserve; the order is based on relative abundance (in percent of number) as in . (1) Meliniomyces bicolor with complete melanised mantle covered with melanised emanating hyphae (meh); (2) Cortinarius spp. showing emanating hypae (eh) and rhizomorph (rh); (3) Unknown 1; (4) Lactarius sp.1 with rhizomorph (rh); (5) Gomphidius cf. roseus with distinctive profuse cystidia (cy) on outer mantle and short rhizomorph (rh); (6) Lactarius cf. rufus showing very fine emanating hypa (eh); (7) Pseudotomentella tristis with emanating hypa (eh) and rhizomorph (rh); (8) Lactarius sp.2 with amanating hypha (eh); (9) Unknown 2; (10) Cenococcum geophilum short distance ET-EcM with emanating hypa (eh); (10a) Cenococcum geophilum sclerotia covered with melanised hypae (mh); (11) Suillus variegatus long distance ET-EcM with rhizomorph (rh)
3.2. Relative abundance descriptors: root tip number versus DW
EcM relative abundance expressed as root tip number or DW gave a different picture of fungal community structure along the transect in the Scots pine stand changing the distribution of the EcM taxa, . When expressed by root tips number, the predominant taxa was M. bicolor accounting with 26% followed by Cortinarius spp. with 24%. However, when the relative abundance was expressed in DW, a switch on dominance was observed with Cortinarius spp. as the most abundant with 37% followed by M. bicolor with 17%. When the number of EcM root tips was plotted against the DW for each group, there was a positive relationship (r2 = 0.676, p < 0.01); however, only 68% of the relationship was explained, .
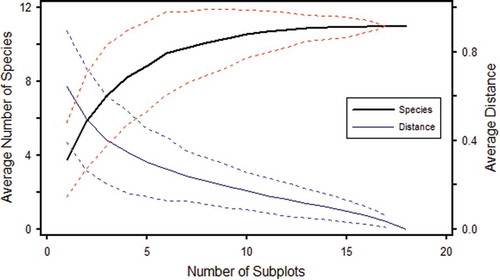
The fungal species effort curve shows that 15 to 18 soil cores (diameter 4.5 cm; depth 12 cm) are required to collect all the EcM fungal taxa in the Scots pine stand sampled. First jackknife estimation indicates that no increase in the number of EcM taxa is expected by increasing the number of soil cores in this particular 50-year-old pine woodland, .
Figure 4. Comparative analysis of the per cent of relative abundance of 11 EcM fungal taxa along the transect. (a) Community structure based on per cent of EcM root tips number (n = 6689). (b) Community structure based on per cent of EcM dry weight (n = 992.6 mg)
Figure 5. Relationship between number of EcM root tips (n = 6689) and dry weight (n = 992.6 mg). Result of regression analysis: r2 = 0.676, p < 0.01
Figure 6. Species effort curve (heavy line) of 11 taxa recognised from 18 soil cores taken along a 125 m transect. The average of Sørensen (Bray-Curtis) distance between the subsamples is represented by the distance curve (light line). Dotted lines represent ± standard deviation
3.3. Relationship between EcM taxa dissimilarity and sample points
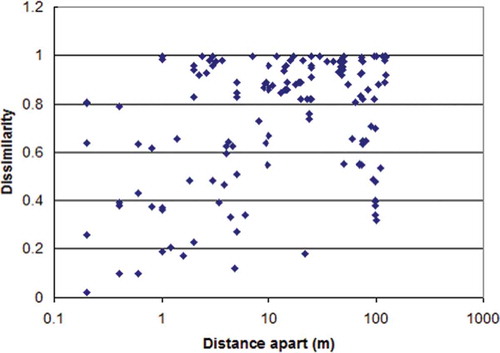
The Sørensen distance between each pair of plots was then plotted against the physical distance apart of that pair of plots along the transect, . A highly significant relationship (r2 = 0.16, p < 0.001) was found between Sørensen dissimilarity in soil cores and distance apart.
Figure 7. Relationship between taxa dissimilarity of 18 soil cores taken at set distances along a 125 m transect using Sørensen (Bray & Curtis) distance
4. Discussion
4.1. EcM taxa detection
In this study, we confirm that the divide of EcM types into morphological groups based on gross morphology (morphotyping), and testing the hypothesis by anatomical characterisation (anatotyping) when discrepancies were observed is of great importance for the recognition and identification of EcM taxa in ecological studies, in line with Agerer (Citation2002). Although this was a time-consuming exercise, it proved crucial to the detection of mixed taxa, e.g. Piceirhiza bicolorata-like EcM formed by Meliniomyces bicolor are frequently misidentified with Cenococcum geophilum EcM confirming Vrålstad et al.’s (Citation2002) findings. In the case of the genus Cortinarius with “white” EcM (and considering that this genus is diverse in the study stand), we performed “identification probes” sensu Agerer (Citation1991) tracing sporome-EcM, revealing that different taxa of Cortinarius frequently shared morpho-anatomical attributes which is in line with Rosling et al.’s (Citation2003) findings. As a result, in the current study no further identification attempts were made from “blind probes” sensu Agerer (Citation1991), grouping similar white EcM types in the taxon Cortinarius spp. for practical reasons. In some cases, distinctive sclerotia (≥0.5 to ≤1.0 mm) of C. geophilum (. 10(a)) were present in soil cores 10 and 11 where the EcM morphotype was absent. Because is well known that C. geophilum lacks an apparent sexual stage (Horton and Bruns Citation2001) and that under environmental stress forms abundant sclerotia (Massicotte et al. Citation1992), this resting structure could be considered as an indicator of fungal presence in future ecological studies.
4.2. Why EcM fungal community change with descriptors?
The disparity found between the number and DW of EcM morpho-anatotypes can be explained in the general morphology of each mycobiont on pine roots, particularly the amount of extramatrical hyphae (explotation types sensu Agerer Citation2001). In the case of Meliniomyces bicolor (Figure 3.1) versus Cortinarius spp., .2, the short emanating hypha arising from the mantle (short distance exploration type, Agerer Citation2001) in the former and the dense emanating elements attached to organic debris in the latter (medium distance fringe exploration type, Agerer Citation2001) made a clear distinction. Both taxa had almost the same level of abundance as number of root tips; however, Cortinarius spp. have twice the biomass than M. bicolor. Another study case is the tuberculate ectomycorrhiza of Suillus variegatus (Swartz ex Fr.) Kuntze with long distance exploration type (Agerer Citation2001), which increases in relative abundance when expressed by weight. These tubercules may contain 10 to 50 root tips (mean 32.75 ± 19.10 SD, n = 5) covered by a thick peridium-like layer. Because the removal of this peridium-like layer is needed to count the number of root tips (which is a time-consuming task), in future studies the tuberculate ectomycorrhizas of Suillus spp. will be considered as a unit according to their putative storage functional importance as discussed by Smith and Read (Citation1997) and scored as one EcM root tip for practical reasons.
4.3. EcM community sampling effort and distribution
Ectomycorrhizal fungi are complex communities contrasting with the relatively simple host plant communities in boreal forests (Erland and Taylor Citation2002). High species richness, patchiness and their apparent non-random distribution are attributes of EcM fungal communities to be considered when developing reliable sampling protocols in ecological studies (Horton and Bruns Citation2001; Taylor Citation2002). In this study sampling, 18 soil cores (diameter 4.5 cm; depth 12 cm) along a transect is enough to collect most of EcM taxa occurring in the top 12 cm soil layer in this 50-year-old (stem exclusion: thicket phase) planted Pinus sylvestris stand. Testing sampling effort and EcM species detection in a 50-year-old Scots pine forest, Taylor (Citation2002) report that Cortinarius was the most abundant genus in sporocarp abundance (42.3%) and species richness (25) but poorly represented (1.6%) as below-ground EcM which contrast with our findings where Cortinarius spp. was well represented below-ground in number and total biomass DW. Genney et al.’s (Citation2006) study on a UK Scots pine stand showed that some species like Cadophora finlandia= Meliniomyces bicolor was distributed evenly with soil depth while the Cortinarius spp. EcM was concentrated in the upper 10 cm which is in line with the present study findings. Methods of scoring ectomycorrhizas by number of root tips versus DW provide a different picture of species composition; however, we found a relationship between the two measures and we can conclude that the number of EcM root tips is more suitable and less time consuming if we combine with a meticulous morpho-anatotyping study. The use of transects across gradients are helpful to describe maximum variation over short distances in a short period of time (Kent and Coker Citation1999; Toljander et al. Citation2006). However, in the current study the spatial arrangement of samples indicated that over short distances the dissimilarity was lower in contrast with the longer distances, suggesting that a random sampling across a wider plot could be more suitable in Scots pine woodlands.
Acknowledgements
We are grateful to Glen Tanar Estate for permission to sample at the field site. The senior author is grateful to the University of Aberdeen, UK, CONACYT (No. 41173) and Colegio de Postgraduados, Mexico and to Regius Prof. Dr. I.J. Alexander, Prof. Dr. I.C. Anderson, Prof. Dr. R. Agerer and Prof. Dr. R. Watling for support and advice. We acknowledge the Associate Editor and the two anonymous referees for their constructive and useful comments on the manuscript.
Disclosure statement
No potential conflict of interest was reported by the authors.
Correction Statement
This article was originally published with errors. This version has been corrected. Please see Erratum (https://doi.org/10.1080/21501203.2017.1407529).
Additional information
Funding
References
- Agerer R. 1987–2002. Colour atlas of ectomycorrhizae. 1–12th delivery, Einhorn, Schwäbisch Gmünd.
- Agerer R. 1991. Characterization of ectomycorrhiza. In: Norris JR, Read DJ, Varma AK, editors. Techniques for the study of mycorrhiza. Methods in microbiology 23:25–73.
- Agerer R, Ammirati J, Blanz P, Courtecuisse R, Desjardin DE, Gams W, Hallenberg N, Halling R, Hawksworth DL, Horak E, Korf RP, Mueller GM, Oberwinkler F, Rambold, G, Summerbell RC, Tribel D and Watling R. 2000. Open letter to the scientific community of mycologists. Canadian Journal of Botany 78:981–983
- Agerer R. 2001. Exploration types of ectomycorrhizae: a proposal to classify ectomycorrhizal systems according to their patterns of differentiation and putative ecological importance. Mycorrhiza. 11:107–114.
- Agerer R. 2002. A proposal to encode ectomycorrhizae for ecological studies, in: Agerer R., ed. Colour Atlas of Ectomycorrhizae, 12th delivery, Einhorn, Schwäbisch Gmünd, pp. 57i–62i.
- Anonymous. 2014. Mapping Scotland’s wildness Map 1 – Perceived naturalness. Geographic Information Group SNH Version: 1 Job ID: 64918 02/04/14. Scottish Natural Heritage, Edinburgh
- Atterson J, Ross I. 2002. Man and woodlands. In: Gimingham C, editor. The ecology, land use and conservation of the Cairngorms. Packard Publishing Limited, Chichester; p. 120–129.
- Bain C. 2013. The ancient pinewoods of Scotland. Dingwall: Sandstone Press.
- Bray JR, Curtis JT. 1957. An ordination of upland forest communities of southern Wisconsin. Ecol Monogr. 27:325–349.
- Burnham KP, Overton WS. 1979. Robust estimation of population size when capture probabilities vary among animals. Ecology. 60:927-936.
- Callander RF, Mac Kenzie NA 1991. The native pine woodlands of Highland Deeside. Unpublished report for the Nature Conservancy Council (NE Region), Aberdeen.
- Clark PDP. 1995. Forestry in Grampian. Forestry. 68:175–185.
- Dahlberg A. 2001. Community ecology of ectomycorrhizal fungi: an advancing interdisciplinary field. New Phytologist. 150:555–562.
- Dytham C. 2003. Choosing and using statistics: a biologist’s guide. 2nd edition. Oxford: Blackwell Publishing.
- Erland S and Taylor AFS. 2002. Diversity of ecto-mycorrhizal fungal communities in relation to the abiotic environment. In: Mycorrhizal ecology. van der Heiden MGA and Sanders IR (eds). Ecological Studies, Springer, Berlin, pp. 163–200.
- Featherstone AW. 2010. Restoring biodiversity in the native pinewoods of the Caledonian Forest. Reforesting Scotland. 41(Spring/Summer):17–21.
- FitzPatrick EA. 1977. Soils of the native pinewoods of Scotland. In: Bunce RGH, Jeffers JNR, editors. Native pinewoods of Scotland. Cambridge: Institute of Terrestrial Ecology; p. 199–212.
- Fodor E. 2013. Linking biodiversity to mutualistic networks – woody species and ectomycorrhizal fungi. Ann For Res. 56(1):53–78.
- Forestry Commission. 2003. The management of semi-natural woodlands: 7. Native pinewoods. Edinburgh: Forestry commission practice guide, Forestry Commission: 28.
- Genney DR, Anderson IC, Alexander IJ. 2006. Fine-scale distribution of pine ectomycorrhizas and their extramatrical mycelium. New Phytologist. 170:381–390.
- Hampson AM, Peterken GF. 1998. Enhancing the biodiversity of Scotland’s forest resources through the development of a network of forest habitats. Biodivers Conserv. 7:179–192.
- Heltshe JF, Forrester NE. 1993. Estimating species richness using the jackknife procedure. Biometrics. 39:1-12.
- Horton TR, Bruns TD. 2001. The molecular revolution in ectomycorrhizal ecology: peeking into the black-box. Mol Ecol. 10:1855–1871.
- Iskipp C. 2000. Biodiversity in Scotland investigating the national heritage. WWF/SNH Data Support Sheet. 1(June):26.
- Kent M, Coker P. 1999. Vegetation description and analysis: a practical approach. West Sussex: John Wiley & Sons; p. 363.
- Lindea van der S, Alexander IJ, Anderson IC. 2010. Do stipitate hydnoid fungi have the ability to colonise new native pine forest? Fungal Ecology. 3:89–93.
- Mason WL, Hampson A, Edwards C. 2004. Managing the pinewoods of Scotland. Edinburgh: Forestry Commission.
- Massicotte HB, Trappe JM, Peterson RL, Melville LH. 1992. Studies on Cenococcum geophilum. II. Sclerotium morphology, germination, and formation in pure culture and growth pouches. Can J Bot. 70:125–132.
- McCune B, Grace JB. 2002. Analysis of ecological communities. Gleneden Beach (OR): MjM Software Design; p. 300.
- McCune B, Mefford MJ. 1999. Multivariate analysis of ecological data, version 4 for Windows. Gleneden Beach: MjM Software Design; p. 237.
- Newton AC, Stirling M, Crowell M. 2001. Current approaches to native woodland restoration in Scotland. Bot J Scotland. 53:169–195.
- Oliver CD. 1982. Stand development-its uses and methods of study. In: Means JE, editors. Forest succession and stand development research in the Northwest. Corvallis: Forest Research Laboratory, Oregon State University; p. 100–112.
- Palmer MW. 1990. The estimation of species richness by extrapolation. Ecology. 72:1195-1198.
- Palmer MW. 1991. Estimating species richness: the second order jackknife reconsidered. Ecology 72:1512–1513.
- Quine CP, Humphrey JW. 2010. Plantations of exotic tree species in Britain: irrelevant for biodiversity or novel habitat for native species? Biodiversity Conservat. 19:1503–1512.
- Richardson DM, Rundel PW. 1998. Ecology and biogeography of Pinus: and introduction. In: Richardson DM, editor. Ecology and biogeography of Pinus. Cambridge: Cambridge University Press; p. 3–46.
- Rosling A, Landerweert R, Lindahl BD, Larsson KH, Kuyper TW, Taylor AFS, Finlay RD. 2003. Vertical distribution of ectomycorrhizal fungal taxa in a podzol soil profile. New Phytologist. 159:775–783.
- Smith SE, Read DJ. 1997. Mycorrhizal symbiosis. 2nd edition. New York: Academic Press; p. 787.
- Steven HM, Carlisle A. 1959. The native pinewoods of Scotland. Edinburgh: Oliver and Boyd.
- Taylor AFS. 2002. Fungal diversity in ectomycorrhizal communities: sampling effort and species detection. Plant and Soil. 244:19–28.
- Tedersoo L, Bahram M, Põlme S, Kõljalg U, Yorou NS, Wijesundera R, Villarreal Ruiz L, Vasco Palacios AM, Quang Thu P, Suija A, et al. 2014. Global diversity and geography of soil fungi. Science. 346(6213):1–10. doi:10.1126/science.1256688
- Toljander JF, Eberhardt U, Toljander YK, Paul LR, Taylor AFS. 2006. Species composition of an ectomycorrhizal fungal community along a local nutrient gradient in a boreal forest. New Phytologist. 170:873–884.
- Tóth EG, Köbölkuti ZA, Pedryc A, Höhn M. 2017. Evolutionary history and phylogeography of Scots pine (Pinus sylvestris L.) in Europe based on molecular markers. J For Res. 28(4):637–651.
- Vickers AD, Palmer SCF. 2000. The influence of canopy and other factors upon the regeneration of Scots pine and its associated ground flora within Glen Tanar National Nature Reserve. Forestry. 73:37–49.
- Villarreal-Ruiz L 2006. Biodiversity and ecology of native pinewood ectomycorrhizal fungi across a chronosequence and their in vitro interactions with ericaceous plants [ PhD Thesis]. University of Aberdeen, Aberdeen, UK, 235 p.
- Villarreal-Ruiz L, Anderson IC, Alexander IJ. 2004. Interaction between an isolate from the Hymenoscyphus ericae aggregate and roots of Pinus and Vaccinium. New Phytologist. 164:183–192.
- Villarreal-Ruiz L, Neri-Luna C, Anderson IC, Alexander IJ. 2012. In vitro interactions between ectomycorrhizal fungi and ericaceous plants. Symbiosis. 56:67–75.
- Vrålstad T, Schumacher T, Taylor AFS. 2002. Mycorrhizal synthesis between fungal strains of the Hymenoscyphus ericae aggregate and potential ectomycorrhizal and ericoid hosts. New Phytologist. 153. 143–152.
- Watling R. 1997. Biodiversity of lichenised and non-lichenised fungi in Scotland. In: Fleming LV, Newton AC, Vickery JA, Usher MB, editors. Biodiversity in Scotland: status, trends and initiatives. The Stationery Office, Edinburgh; p. 77–88.