
ABSTRACT
The endophytic fungal community associated with leaves of Ficus carica L. (Moraceae) from Argentina was investigated. Fifteen fungal isolates were isolated and identified by molecular methods into the genera Alternaria, Cladosporium, Curvularia, Diaporthe, Epicoccum, Myrothecium, Neofusicoccum, Nigrospora, Preussia and Ustilago. Cladosporium cladosporioides and Curvularia lunata were the most frequently isolated species. The fungal metabolic profiles were obtained by automated TLC and NMR and analysed by PC Analysis. Antifungal and antibacterial activity was assessed by bioautographic assays. In addition, the biotransforming ability of the fungal isolates was tested on F. carica extracts. Five isolates (33.3%) exhibited inhibitory activity against at least one of the microorganisms tested. Most of the fungal endophytes were able to metabolise the flavonoid rutin 1, and the coumarin psoralen 3 present in F. carica extracts. Further investigations of the psoralen biotransforming ability performed by the selected endophyte Alternaria alternata F8 showed the accumulation of the 6,7-furan-hydrocoumaric acid derivative 4 as the main biotransformation product. Our results corroborate that F. carica can live symbiotically with rich and diverse endophytic communities adding insights about their ecological interactions.
1. Introduction
The fig tree (Ficus carica L., Moraceae) is one of the most appreciated Moraceae species, widely employed by people since the beginning of humanity. This worldwide-valued plant possesses both important nutritional and ethnobotanical properties. The fruit (fig) is used in popular medicine to treat various conditions, especially due to its latex content. Preparations based on F. carica leaves have shown beneficial effects in gastrointestinal, respiratory, and cardiovascular diseases (Barolo et al. Citation2014). Phytochemical investigations have demonstrated that the common fig has a wide variety of secondary metabolites (volatile terpenoids, shikimate derivatives, higher terpenoids, steroids, organic acids, flavonoids, and furanocoumarins among others). Many of the mentioned secondary metabolites have been also characterised in the latex of the different varieties of F. carica, although enzymes with protease, lipase, and other activities are found predominantly in this fluid (Castelli and López Citation2022).
Ficus carica leaves are very popular as a traditional medicine. However, it has been stated that they possess moderate toxicity when consumed. Scientific investigations have shown that triterpenoids (mainly calotropenyl acetate, methylmaslinate and lupeol acetate) contained in the methanol extract have in vivo irritant effects (Saeed and Sabir Citation2002). Furanocoumarins like psoralen can act as highly potent inhibitors of drug metabolising enzymes like cytochrome P450 (CYP) 3A and other CYP isoenzymes (Guo et al. Citation2000; Ren et al. Citation2020); besides on their phototoxicity potential, demonstrated after topical applications of F. carica leaves (Li et al. Citation2021).
Despite the large amount of available information, there is limited literature on the role of F. carica as a host of endophytic fungi. An endophytic fungus is capable of living its entire life cycle or part of it within the tissues of the plant without producing symptoms of infection (Wilson Citation1995; Bacon and White Citation2000; Schulz and Boyle Citation2006). Rosli et al. (Citation2020) described the isolation and characterisation of 11 endophytic fungi of F. carica from China and studied their ability as biocontrol agents for phytopathogenic fungi; more recently Abdou et al. (Citation2021) reported the isolation of five endophytic fungi of F. carica from Saudi Arabia and studied their antimicrobial and cytotoxic capacity. On the other hand, some fungal endophytes earlier isolated from F. carica have been studied as producers of bioactive metabolites: Alternaria sp. FL25 (Feng and Ma Citation2010), Aspergillus tamarii (Zhang et al. Citation2012a; Ma et al. Citation2016), Fusarium solani (Zhang et al. Citation2012b), and Fusarium sp. (Liang et al. Citation2016).
Metabolomics is an emerging research field which uses technological skills in analytical chemistry to measure and compare the metabolites present in a given complex natural sample (Nagarajan et al. Citation2022). In a previous work, direct sample injection and electrospray ionisation combined with high-resolution mass spectrometry (DI–ESI–HRMS) and automated thin-layer chromatography (ATLC) data associated with the non-supervised statistical analysis PCA (principal component analysis) were used to characterise a population of 24 Diaporthe spp. endophytic isolates from Peperomia obtusifolia (Piperaceae) aerial parts, demonstrating that ATLC plus PCA was as robust as DI–ESI–HRMS plus PCA to establish metabolic relationships amongst them (Ruiz Mostacero et al. Citation2021). NMR is also a powerful tool to discriminate metabolites in a mixture, which has been successfully employed along with thin-layer chromatography (TLC) for discriminating the anti-inflammatory capacity of metabolites produced by fungal endophytes from Crescentia alata (Flores-Vallejo et al. Citation2020). Moreover, a combination of high-performance thin-layer chromatography (HPTLC) with chemical and biochemical derivatisation was successfully used to characterise the potential anti-cancer effect of Penicillium decumbens MBS 3.2, isolated from the stem of the Malayan marine plant Sonneratia sp. (Lim et al. Citation2021). In this study, the analysis of fungal extracts and their comparison were performed by ATLC and 1H NMR, both analysed with PCA.
The aim of the present work was to characterise the endophytic fungal community associated with leaves of an Argentinean F. carica tree, the ability of the fungal isolates to produce antimicrobial compounds against different fungi and bacteria as well as their capacity to grow using F. carica components as the main substrate.
2. Methods and materials
2.1. Sample collection and isolation of endophytic fungi
Sixty-year-old healthy F. carica leaves with their petiole were collected in April 2015, from a plantation in Montes de Oca, Santa Fe, Argentina (32° 40’ 47” S, 61° 48’ 09” W) (Figure S1). The dried plant material was deposited in the Collection of the Herbarium of the Faculty of Agricultural Sciences, National University of Rosario, Zavalla, Argentina, with the number Barolo 10,477 (UNR). The collected material was transferred to the laboratory within 24 h and the isolation procedure of endophytic fungi was carried out. The surface sterilisation and isolation of fungal endophytes were carried out following the procedures described by Schulz et al. (Citation2002). The leaves were washed thoroughly with running tap water and neutral soap. In sterile conditions, the leaves were immersed in 1% sodium hypochlorite solution for 5 min and dried with sterile filter paper, and subsequently transferred to 70% ethanol solution for 1 min and dried with sterile filter paper. The surface-sterilised samples were rinsed three times with sterile distilled water and dried with sterile filter paper. Sterile samples were aseptically crumbled into small fragments, evenly placed on Petri dishes containing potato dextrose agar (PDA), Sabouraud glucose agar (SGA), Czapek agar (CA) and water agar (WA), all incubated until 40 days at 28 °C. Additionally, fragments of fresh leaves were frozen under liquid N2 and crushed in a mortar before application on Petri dishes as described.
To confirm that the disinfection process was successful, a 0.1-mL aliquot of the water used for the last washing step was spotted and incubated on PDA dishes. The cultures were monitored every day for checking the growth of endophytic fungi. Each colony that emerged from the plant fragments was subcultured on PDA plates, and brought into a pure culture. After incubation at 28 °C for 7–10 days, culture purity was assessed using colony morphology analysis (Figure S2). The pure cultures were recorded and maintained on PDA for further investigations. For long-term storage, the fungal colonies were put in 5% (v/v) glucose and 10% (v/v) glycerol at −80 °C.
2.2. Endophytic fungal identification
Genomic DNA was extracted according to a procedure described before (Tang et al. Citation1992). Briefly, isolates were subcultured in GYEP (glucose, yeast extract, peptone) broth for 15 days at 24 °C in Petri dishes. Mycelium was placed on filter paper to remove excessive moisture and then transferred to a 50-mL polypropylene tube containing 8 glass beads (4 mm, Schott Duran). The tube was immersed in liquid nitrogen for 30 s and vortexed for 30 s. A volume of 0.8 mL of extraction buffer (0.2 M Tris–HCl pH 7.6, 0.5 mol/L NaCl, 10 mM EDTA, 1% SDS) was added, and the mixture was gently mixed. An equal volume of phenol (Phe): chloroform (CHCl3) (1:1) was added to the mixture, mixed and transferred to a microfuge tube and centrifuged for 15 min at 12,000 × g. The aqueous phase was successively re-extracted with one volume of Phe:CHCl3 (1:1) and CHCl3. DNA was precipitated with 0.6 volume/mL of isopropanol, washed with 70% ethanol and resuspended in water containing 0.2 mg/mL RNAse A (Invitrogen). Genomic DNA was stored at −20 °C until use. DNA segments comprising the ITS1 and ITS2 regions were amplified with primers ITS1 (5´-TCCGTAGGTGAACCTGCGG-3´) and ITS4 (5´-TCCTCCGCTTATTGATATGC-3´) (White et al. Citation1990) in a Veriti 96 Well Thermal Cycler (Applied Biosystems). The reaction mixture contained 0.5 μmol/L each primer (GBT oligos, Argentina), 0.2 mmol/L each deoxynucleoside phosphate (Invitrogen), 1.5 mmol/L MgCl2, 2.5 U Taq Polymerase (Invitrogen) and 25 ng DNA in a final volume of 50 μL. The parameters were one initial cycle of 2 min at 94 °C, followed by 35 cycles of 30 s at 94 °C, 30 s at 58 °C and 1 min at 72 °C and one final cycle of 5 min at 72 °C. As a negative control, the template DNA was replaced by sterile distilled water. The reaction products were analysed in a 2% agarose gel (Invitrogen) and purified by the Axyprep PCR Clean-up kit (Axygen) following manufacturer’s instructions. PCR products were sequenced (Macrogen, Korea) using the ITS4 primer. Sequences were edited (Chromas Lite 2.1.1, www.technelysium.com.au) and compared with the GenBank database using the BLAST search program (http://www.ncbi.nlm.nih.gov/BLAST). Sequence similarities greater than 99% were considered for species-level identification. Sequences generated in this study were submitted to the GenBank database under accession numbers MH165214–MH165228 ().
Table 1. Molecular identification of endophytic fungi isolated from Ficus carica.
2.3. Extract preparation of fungal endophytes
The fungi were cultured for 21 days at 28 °C in the dark in Petri dishes (90 mm diameter) with PDA (Britania®). A punctual sowing was done in the centre of each dish; two dishes were used for each fungus. After that time, the culture medium was cut into 5-mm side cubes to increase the solvent contact surface and subjected to maceration with ethyl acetate (EtOAc), with three successive extractions performed every 24 h with 50 mL each and sonication by 15 min. The organic phase was dried over Na2SO4 anhydrous, filtered and the solvent removed under rotary evaporation at 30 °C. Sterile PDA medium was extracted using the same procedure. The sterile PDA extract was used as the control in the screening procedure. The crude extracts were stored at −20 °C until use.
2.4. Chemical profiling of extracts from F. carica fungal endophytes
2.4.1. Automated thin layer chromatography (ATLC)
The extracts were applied in chromatograms (TLC, silica gel 60 F254, 1.05554.0001 Merck®) in 4 mm bands (ATS4, Camag®) and automatically developed up to 7 cm (ADC2, Camag®), using three different mobile phases: hexane (Hex):EtOAc (7:3); dichloromethane (DCM):EtOAc:methanol (MeOH) (9:0.5:1) and EtOAc:MeOH:H2O (7.7:1.3:1). UV 254 nm, UV 366 nm, Vis radiation and 10% H2SO4 in MeOH plus heating were alternatively used for the detection (Wagner and Bladt Citation1996). The plates were digitised (TLC Visualiser, Camag®) and data were processed using the software VisionCATS v2.0 (Camag®) and analysed with rTLC software for PCA statistical test (Fichou et al. Citation2016).
2.4.2. Nuclear Magnetic Resonance
The 1H NMR spectra of the extracts were performed at 25 °C in a Bruker® AV-300, 300 MHz operating at a frequency of 300.13 MHz. Each spectrum of 1H NMR was made with CDCl3 as a solvent and consisted of 64 scans. Extract solutions were from 11 to 36 mg/mL. The data were processed, normalised and PCA statistical analysis was carried out with the software Bionumerics v7.6 trial version.
2.5. Biotransformation of F. carica compounds by the fungal endophytes
Three solid media were formulated with fragmented dried leaves of F. carica in a final concentration of 1.5%, 7.5% and 15.0%, respectively, supplemented with 2% glucose and 1.5% agar. The media were sterilised at 121 °C by 15 min before plating.
Alternaria alternata F8 was employed to determine the maximum % of F. carica material to be added to the medium which allowed a normal fungal growth, compared with the corresponding PDA growth. One central spot of F8 grown on PDA (28 °C, dark, 14 days) was applied into each Petri plate (90 × 15 mm) and incubated at 28 °C for 21 days. After that, the agar was completely fragmented into small pieces (3 × 3 mm approximately) and extracted with EtOAc (3 × 20 mL) assisted by sonication 15 min each. The EtOAc extracts were treated with Na2SO4 anhydrous, filtered and the solvent was evaporated under reduced pressure. Each extract was maintained at −20 °C until use.
The medium supplemented with 7.5% F. carica was selected amongst the three tested options (1.5%, 7.5%, and 15%) and then evaluated with all the 15 endophytic fungi isolated, in a similar way as described above.
2.5.1. Marker compounds for monitoring biotransformation
Solutions of 1 mg/mL of rutin (compound 1) (56,448 Sigma-Aldrich®) and 8-methoxypsoralen (compound 2) (232,726 Sigma-Aldrich®) prepared in MeOH and DCM, respectively, were employed as marker compounds.
2.6. Isolation and purification of psoralen (compound 3) from the F. carica leaves organic extract
2.6.1. Extract preparation and purification process
A Hex maceration of fragmented previously dried (40 days at 24–26 °C) leaves (409.34 g) of F. carica was carried out. Three successive extractions of 1 L were carried out (3.0 L) to get 8.52 g of Hex extract after solvent evaporation under reduced pressure. An aliquot of 5.0290 g of extract was dissolved in a mixture of 130 mL of MeOH and 70 mL of Hex. The precipitate (1.1491 g) was separated and then three successive extractions were carried out with Hex (50 mL each), obtaining a Hex fraction and a MeOH fraction (M) of 1.3985 g. The M fraction was submitted to a chromatographic separation with Silica gel 60 Merck® (0.040–0.063 mm) developed with a gradient starting with Hex:EtOAc 90:10, increasing 10% EtOAc every 1 dead volume (100 mL), then EtOAc 100%, EtOAc:MeOH 50:50 and ending with MeOH 100%. Seven fractions (M1 to M7) were obtained, with a yield of 86.62%. Fraction M4 (121.6 mg) was separated in Sephadex LH-20 column eluted with CHCl3:MeOH 90:10. Sub-fractions M4B and M4C were combined (52.6 mg) and separated in a chromatographic column with Silica gel 60 Merck® (0.040–0.063 mm) developed with a solvent gradient, starting with 100% DCM and increasing the proportion of EtOAc up to 100% EtOAc, ending with 100% MeOH. Seven sub-fractions (M4BCa-M4BCg) were obtained and evaluated by TLC. M4BCb sub-fraction (15.4 mg) showed acceptable purity by TLC and was characterised by GC–MS, HRMS–MS and NMR (1H; 13C; COSY; HSQC; HMBC) resulting compatible with psoralen 3 (Supplementary material S3–S12). The purification process was scaled-up to obtain enough psoralen 3 for the biotransformation experiments.
2.6.2. Characterisation of psoralen 3
2.6.2.1. GC–MS
An automatic GC–MS Shimadzu® chromatograph, model QP-2010 Plus, autosampler AOC-20i and SPL1 injector were used. The software used for data analysis was GCMS Solutions v-2.53 SU1 LabSolutions®, Shimadzu Corp. The parameters used for GC were: He as carrier gas, flow rate of 1 mL/min, injection temperature: 250 °C and temperature program from 50 °C to 310 °C at 25 °C/min; capillary column: SPB-1 (30 m × 0.25 mm, 0.25 μm) and for MS: electronic impact with energy of 70 eV.
2.6.2.2. HRMS–MS and NMR experiments
A Bruker® MICRO QTOF II LCMS equipment was used, with a collision energy of 4 eV. For NMR experiments, the sample was analysed in a Bruker® Avance AV-300 NMR spectrometer, operating at a frequency of 1H of 300 MHz and 75 MHz (13C).
2.7. Quantification of psoralen 3 content in the F. carica 7.5% culture medium
Different volumes (in duplicate) of a standard solution of 0.5 mg/mL psoralen 3 (3 µg, 1.5 µg, 1 µg, 0.5 µg and 0.25 µg) and samples of the EtOAc extract of the F. carica 7.5% culture medium were automatically applied (ATS 4 and ACD 2, Camag®) on TLC chromatoplates (Silica gel 60 F254, 1.05554.0001 Merck®) in 4 mm bands and developed to 7 cm. A mixture of DCM:EtOAc:MeOH (9:0.5:1) was used as a mobile phase; the detection was performed by UV 254 nm, UV 366 nm and visible after application of 10% KOH in ethanol as spray reagent (Reich and Schibli Citation2007). The plates were digitised (TLC Visualiser and TLC Scanner, Camag®) and processed with the VisionCATS v4.0 software. The calibration curve was performed based on the height of the corresponding peaks versus the mass (µg) of the standard and adjusted to a polynomial function provided by the VisionCATS v4.0 software. Psoralen content in samples of the EtOAc extract of the F. carica 7.5% culture medium was determined by interpolation. The psoralen concentration was determined as 46 µg/mL (coefficient of variation = 4.85%, Suppl. Mat. Figure S13).
2.8. Metabolisation of psoralen 3 by A. alternata F8
The medium with psoralen 3 was prepared with 1.5% agar, 2% glucose, and 0.0046% psoralen 3. After homogenisation, the preparation was sterilised by fluent steam for 15 min.
For the metabolisation process, 8 mL of the medium were added to a 60-mm diameter Petri dish. After solidification, central spots of A. alternata F8 mycelium from PDA 14 days colonies were added, and the plates were incubated by 7, 14, or 21 days at 28 °C in darkness. The following controls were included in duplicate:
Control medium (without psoralen 3, T0C, T7C, T14C, T21C).
Psoralen (control medium + psoralen 3, T0P, T7P, T14P, T21P).
A. alternaria F8 (control medium + psoralen 3, T0F8, T7F8, T14F8, T21F8).
After the incubation period, the agar was fragmented and extracted with EtOAc, as described above. The EtOAc extracts were analysed by ATLC, GC–MS, and/or HRMS, LC MS/MS.
The HRMS spectra of the extracts were performed in a LC MS MICRO QTOF II Bruker® equipment, with a collision energy of 10 eV.
The LC MS/MS experiments were performed in an LCMS DAD–ESI–QTOF MS Bruker®. The HPLC method employed a flow rate of 0.4 mL/min, column temperature of 35 °C, column Phenomenex, Luna® 5 µm C18 (2) 100A; 250 × 4.6 mm and the mobile phase consisted of 0.5% of formic acid (FA) in ultrapure water (v/v, solvent A) and 0.5% FA in MeOH (v/v, solvent B), starting with 20% and changing to 50% B for 3 min, held for 5 min, followed by a second ramp to 70% B in 7 min, held for 5 min, a third ramp to 80% B in 1 min, maintained for 9 min, remaining at this last condition for 10 min before the next run (Llorente et al. Citation2014). The Mass spectra were recorded in negative (−) mode in a range between 50 and 800 m/z. The ionisation source conditions were capillary voltage 4500 V, nebulisation gas 4.0 bar (N2), drying gas 8.0 L/min (N2), drying temperature 200 °C, collision gas Ar (argon) and collision energy 10 eV. As an internal calibrant, 40 mmol/L sodium formate was used.
The HRMS and LC MS/MS experiments were performed at the Instituto de Ciencia y Tecnología de alimentos Córdoba (ICYTAC–UNC–CONICET Citation2022), Argentina (https://www.icytac.conicet.unc.edu.ar/servicios/hplc-hrms/).
2.8.1. Scale up and purification of 6,7-furan-hydrocoumaric acid 4
Ninety Petri plates were inoculated as described above, and after incubation the agar was fragmented and extracted with EtOAc. The solvent was eliminated by evaporation under reduced pressure to obtain 84.9 mg. A liquid–liquid extraction was performed solubilising the extract in MeOH:H2O (6:4) and extracting with DCM three times. The DCM extract obtained was solubilised in MeOH, and three extractions were performed successively with Hex to eliminate the non-polar compounds. The extract obtained (25.6 mg) was submitted to preparative TLC (Silica gel 60F254, 1.05554.0001 Merck®) using DCM: EtOAc:MeOH:formic acid (9:0.5:1:0.01) as mobile phase. Two sub-fractions were obtained, sub-fraction B (compound 4, 0.8 mg) showed adequate purification and was analysed by 1H NMR in a Bruker® Avance AV-300 NMR spectrometer, operating at a frequency of 1H of 300 MHz (, Figure S14).
Table 4. 1H NMR (300 MHz, CDCl3) spectroscopic data for psoralen (compound 3) and 6,7-furan-hydrocoumaric acid (compound 4).
2.9. Antimicrobial activity assays
2.9.1. Agar overlay bioautography
The methodology employed was previously described in Rahalison et al. (Citation1991) and Ruiz Mostacero et al. (Citation2019). Aliquots of 100 μg, 50 μg and 25 μg of the EtOAc extracts from the fungal endophytes were applied as spots on chromatographic plates (Silica gel 60 F254 Merck®), which were then sterilised with UV radiation 254 nm (CR/UV 30A) for 20 min in a laminar flow chamber ESCO Optimair® Model Sentinel Delta (ABC). Extracts with inhibitory activity were developed by ATLC using one of the three mobile phases described above. Bacterial strains evaluated were Staphylococcus aureus ATCC 25923 and Escherichia coli ATCC 25922; yeasts: Candida albicans ATCC 10231, Candida tropicalis CCC 131–1997, Cryptococcus neoformans ATCC 32264, Rhodotorula rubra CCC 131–2009 and Saccharomyces cerevisiae ATCC 9763; and the filamentous fungi Verticillium sp. and Ascochyta rabiei (isolate AR2).
2.9.2. Minimal Inhibitory Concentration (MIC) of psoralen 3 on A. alternata F8
Broth microdilution tests were performed following the European Committee on Antimicrobial Susceptibility Testing (EUCAST) document (EUCAST Citation2022) with minor modifications. The inoculum was used at a final concentration of 1 × 10⁵ conidia/mL. Chlorothalonil was included as a positive control. Concentrations of psoralen tested ranged from 800 to 12.5 μg/mL. The Minimal Inhibitory Concentration (MIC) was defined as the concentration that produced the complete visual inhibition of fungal growth determined after 72 h incubation at 28 °C. Doubtful microplate wells were observed under light microscope (40×).
3. Results
3.1. Isolation and identification of endophytic fungi
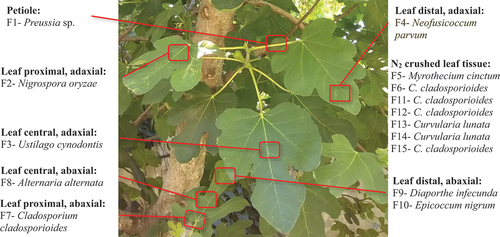
Fifteen tabicated filamentous fungi were isolated from the fresh leaves of F. carica, 13 of which were dematiaceous. Morphological presumptive identification was corroborated by the results of the DNA amplification using ITS1/ITS4 primers for nine isolates: Cladosporium cladosporioides (F6, F7, F11, F12, and F15), Diaporthe infecunda F9, Curvularia lunata (F13 and F14), and Alternaria alternata F8. The identification of the remaining isolates: F1 as Preussia sp., F2 as Nigrospora oryzae, F3 as Ustilago cynodontis, F4 as Neofusicoccum parvum, F5 as Myrothecium cinctum, and F10 as Epicoccum nigrum was carried out on the basis of the ITS amplification results due to the absence of conidial production (). Most of the isolated strains were obtained from the crushed plant material, followed by the midribs ().
Figure 1. Schematic representation of the endophytic fungi isolated and their localisation in Ficus carica tissues.
3.2. Determination of the chemical profiles of extracts of fungi isolated from F. carica
3.2.1. Thin layer chromatography
The profiles of the EtOAc extracts of endophytic fungi and a control extract of the PDA medium were characterised and compared by TLC UV–Vis and with H2SO4 10% spraying derivatisation. Many fluorescent bands were detected at 366 nm employing any of the following mobile phases: Hex:EtOAc (7:3), DCM:EtOAc:MeOH (9:0.5:1) (), and EtOAc:MeOH:H2O (7.7:1.3:1) (not shown).
Figure 2. Chemical profiles of the extracts of the 15 endophytic fungi isolated from Ficus carica. a. ATLC chromatographic profiles obtained at 366 nm with Hex:EtOAc (7:3) as mobile phase, spray reagent: H2SO4 10%. b. ATLC chromatographic profiles obtained at 366 nm with DCM: EtOAc: MeOH (9:0.5:1), spray reagent: H2SO4 10%; white dashed line marks the yellow band at Rf = 0.55 of F8 fungal extract. c. Stacked plot of the 1H NMR (CDCl3) spectra of the extracts of the 15 endophytic fungi isolated from F. carica.
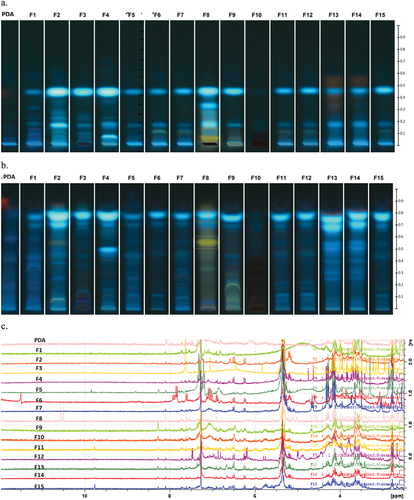
The analysis of the chromatographic profiles of the extracts with Hex: EtOAc 7:3 showed similarity amongst the isolates F6, F7, F11, F12, and F15; also the profiles of F13 and F14 showed similarity amongst them, which is in agreement with their molecular identification, being identified as C. cladosporioides and C. lunata, respectively ().
When DCM:EtOAc:MeOH (9:0.5:1) and EtOAc:MeOH:H2O (7.7:1.3:1) were employed as mobile phases, the metabolic profile of the extract of C. cladosporioides F7 showed some differential bands in comparison with F6, F11, F12, and F15 extracts, both at UV light (366/254 nm) and after derivatisation with H2SO4 10%.
The A. alternata F8 extract was distinguishable with the three mobile phases employed due to a yellow band observed at 366 nm, 254 nm and after derivatisation with H2SO4 10% which was not detected in the other extracts (). This band was observed at Rf = 0.55 with the mobile phase DCM:EtOAc:MeOH (9:0.5:1) ().
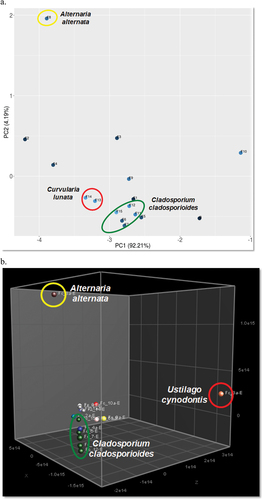
The multivariate analysis PCA of the chromatographic profiles obtained with each chromatographic condition was performed, and Hex:EtOAc (7:3) at 366 nm showed a clearer clustering amongst fungi according to their taxonomic identification. The PC1 accounted for 92.21% of the total variability and the first two PCs explained 96.40% of the variability in the original data. The A. alternata F8 extract appeared completely separated from the other extracts, while it was not clearly observed with the other mobile phases tested ().
Figure 3. a. Biplot of PCA from the TLC (366 nm) of extracts of the 15 endophytic fungi isolated from Ficus carica using Hex:EtOAc (7:3) as mobile phase. b. PCA of the 1H NMR spectra of the extracts of the 15 endophytic fungi isolated from F. carica.
3.2.2. Nuclear magnetic resonance
The spectra of the 1H NMR were typical of complex mixtures with a great variety of signals () and were analysed by multivariate analysis searching patterns associated with their chemical components. The PCA showed the grouping amongst the fungi according to their taxonomic genotipification (e.g. C. cladosporioides). In addition, the PC1 × PC2 × PC3 plot showed a clear differentiation of the A. alternata F8 and U. cynodontis F3 extracts (). The three PCs explained 82.9% of the total variability in the original data.
3.3. Antimicrobial activity of the fungal extracts
The antibacterial screening of the EtOAc extracts of the endophytic fungi performed by agar overlay spot bioautography showed that four extracts (F8, F10, F13, and F14) inhibited S. aureus at 25 μg/spot with zones of inhibition ranging from 11.0 mm to 22.0 mm in the bioautography assay. The extract of E. nigrum F10 showed activity against E. coli at 25 μg/spot with a zone of inhibition of 11.0 mm ().
Table 2. Antimicrobial activity of EtOAc extracts of Ficus carica fungal endophytes by agar overlay bioautography.
In regards to the antifungal activity, the A. alternata F8 extract inhibited C. albicans, C. neoformans and S. cerevisiae at 25–100 μg/spot, and C. lunata F14 extract inhibited R. rubra at 100 μg/spot; meanwhile, D. infecunda F9 extract showed activity against the phytopathogen fungus A. rabiei at 25 μg/spot ().
The EtOAc extracts of the isolates F1–F7, F11, F12, and F15 were inactive to inhibit all the microorganisms tested at 100 μg/spot.
3.3.2. Agar overlay developed bioautography
The TLCs were performed for the active extracts with the mobile phases used to analyse the chemical profiles. The E. nigrum F10 extract inhibited the E. coli growth at an Rf = 0.70 with the mobile-phase EtOAc:MeOH:H2O (7.7:1.3:1), while showed a larger halo (Rf from 0.30 to 0.70) for S. aureus under the same condition. The extracts of C. lunata F13 and F14 presented two inhibition halos against S. aureus, one of them at an Rf = 0.60 greater than the more polar observed at an Rf = 0.08, with the mobile phase DCM:EtOAc:MeOH (9:0.5:1) ().
Figure 4. a. Bioautographic assay of Alternaria alternata F8 and Curvularia lunata F13 and F14 EtOAc extracts against Staphylococcus aureus (100 μg/4 mm band). ATB: vancomycin 0.3 μg/spot. b. Observation at 366 nm. Mobile phase DCM:EtOAc:MeOH (9:0.5:1).
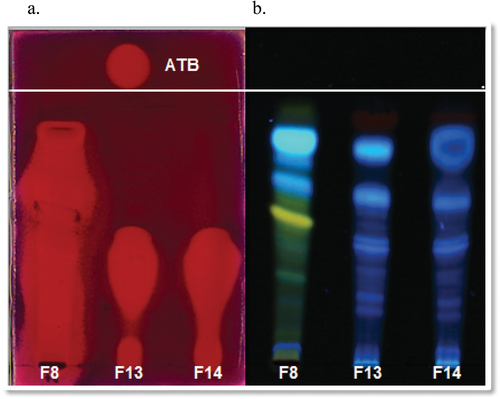
In addition, the A. alternata F8 extract produced a halo of inhibition at an Rf = 0.70 against S. cerevisiae and C. neoformans with DCM:EtOAc:MeOH (9:0.5:1) mobile phase and also showed several halos at different Rfs against S. aureus ().
3.4. Growth of the endophytic fungi on a F. carica formulated medium
To establish conditions for testing the growth of fungal endophytes on F. carica tissues, three different solid media containing F. carica fragmented leaves (15%, 7.5%, and 1.5%) on a matrix of 1.5% agar and 2% glucose were prepared. Their EtOAc extracts were compared with an extract of F. carica leaves showing that both the 15% and 7.5% Fc media showed a better qualitative abundance of metabolites than the 1.5% Fc medium.
To determine eventual inhibitory effects of the three Fc media on the endophytic fungi, was carried out a single test of fungal growth with A. alternata F8. This strain was selected due to its growth characteristics (rate, shape, conidia production, diffusible pigment) under the experimental conditions (10 days, 28 °C, darkness), employing its PDA growth as a reference. Colonies (duplicate) of F8 grown on the 15% Fc medium showed a reduced radial growth and changes in the pigment production, meanwhile the colonies grown on 7.5% and 1.5% media showed no alterations.
The 15% Fc medium was discarded, and the 7.5% Fc was selected for further analysis based on the abundance of F. carica components.
The EtOAc extracts of the 15 endophytes cultured on 7.5% Fc agar plates were compared by ATLC along with the control medium, adding 8-methoxy-psoralen and rutin as marker compounds. The selection was based on the abundance of coumarins (bergapten, umbelliferone, psoralen, etc.), and flavonoids (cyanidin glycosides, rutin, etc.) in F. carica along with the availability of UV–Vis detectable standards in the laboratory.
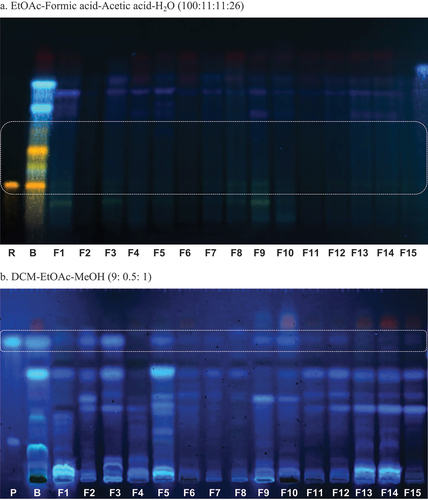
The analysis of the chromatographic profiles and their comparison with the control extract (sample B, ) showed the typical fingerprint of a total plant extract with chlorophylls (red fluorescent bands at 366 nm), and some differences. A single visual analysis showed changes in blue fluorescent bands at 366 nm in the Rf ~0.8 with similar polarity with the standard 8-methoxy-psoralen 2 (Rf = 0.78, DCM-EtOAc-MeOH 9:0.5:1), in many of the fungal extracts. With the exception of N. oryzae F2, U. cynodontis F3, M. cinctum F5, D. infecunda F9 and E. nigrum F10, the fungal chromatographic bands in that Rf were below the detection limit (). Similarly, chromatographic bands corresponding to flavonoids like rutin showed modifications. The control extract showed three yellow bands at 366 nm (Rfs at 0.26, 0.34 and 0.42; EtOAc–HCOOH–HAc–H2O 100:11:11:26) after spraying the plate with Natural Products reagent (Wagner and Bladt Citation1996) which were not detected in the fungal extracts ().
Figure 5. Chromatographic profiles of the EtOAc extracts from the endophytic fungi cultured on the 7.5% Ficus carica medium by 21 days, obtained at 366 nm. P: 8-methoxy-psoralen (0.4 µg/4 mm band), B: control of 7.5% F. carica culture medium, F1- F15: endophytic fungi: 50 µg/4 mm band, R: rutin (0.5 µg/4 mm band). The boxes indicate the Rf of rutin (a) or 8-methoxy-psoralen (b). a. Mobile phase: EtOAc–formic acid–acetic acid–H2O (100:11:11:26). Spray reagent: natural product – PEG. b. Mobile phase: DCM–EtOAc–MeOH (9:0.5:1). Spray reagent: H2SO4 10%.
To get more information about the behaviour of coumarins, a GC–MS analysis of the extracts was performed. The chromatogram of the control extract showed six major peaks between Rt 10.0–12.0 min, being the peak at Rt = 10.2 min presumptively identified as psoralen, and a less intense peak at 10.8 min identified as bergapten by comparison with the NIST (National Institute of Standards and Technology) database. The analysis of the fungal EtOAc extracts showed the disappearance of at least three peaks when compared to the control (peaks with an * in ).
Figure 6. GC–MS chromatograms of the EtOAc extracts from the 15 fungal endophytes grown on the Fc 7.5% medium by 21 days with the spectrum of the peak at Rt = 10.2 min (compound 3) compared with the NIST Database. Note: * intense peaks detected in the Control medium which suffered changes after fungal growth.
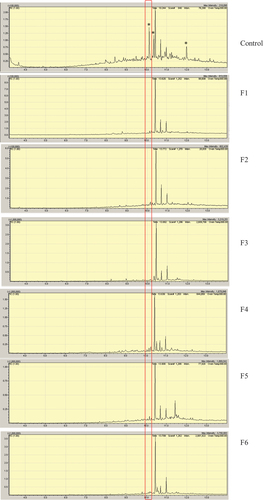
Figure 6. (Continued).
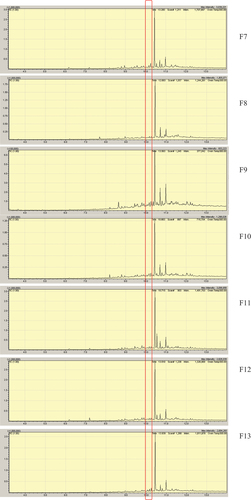
Figure 6. (Continued).
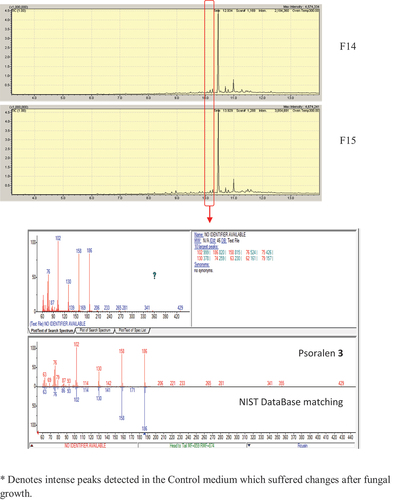
Psoralen is the most abundant coumarin in F. carica (Oliveira et al. Citation2012) and was one of the compounds presumptively detected as absent in the fungal extracts by GC–MS. Further analyses to demonstrate if psoralen effectively was consumed during the fungal growth were performed, starting with its purification.
3.4.1. Isolation and characterisation of psoralen
Psoralen 3 was isolated from the Hex extract of the aerial parts of F. carica leaves by column chromatography on Silica Gel and was characterised by NMR experiments (1H, 13C NMR, HH COSY, HSQC, HMBC), GC–MS and HRMS, being identical to reported data (Elgamal et al. Citation1979; Masuda et al. Citation1998), and corroborating the identity of the peak with Rt = 10.2 min as psoralen 3 (, Suppl. Mat. Fig S3–S12, S15). In addition, the ATLC comparison of the EtOAc fungal extracts (7.5% Fc) with psoralen 3 gave very similar results to those of 8-methoxy-psoralen 2 ().
3.4.2. Qualitative approach to the metabolisation of psoralen 3 by A. alternata F8
To explore more about the degrading process of psoralen 3 by F. carica fungal endophytes, considering that almost all fungal extracts showed similar GC–MS and TLC chromatograms to A. alternata F8, and due to its rapid growth, further investigations were carried out with this endophyte.
The MIC (minimal inhibitory concentration) of psoralen 3 for A. altarnata F8 was determined as 200 μg/mL (Chlorotalonyl, CIM = 1.56 μg/mL). In addition, the culture medium was formulated with 46 μg/mL psoralen on the basis of its content previously determined in the F. carica 7.5% culture medium (Suppl. Mat. Figure S13). F8 cultures were monitored by 7 days, 14 days and 21 days, analysing the EtOAc extracts () obtained from two Petri dishes in each condition by TLC and GC–MS, in comparison with the corresponding controls.
Table 3. Weight (mg) of EtOAc extracts obtained after culturing the fungal endophytes in the medium formulated with psolaren 3 after extraction of two Petri plates.
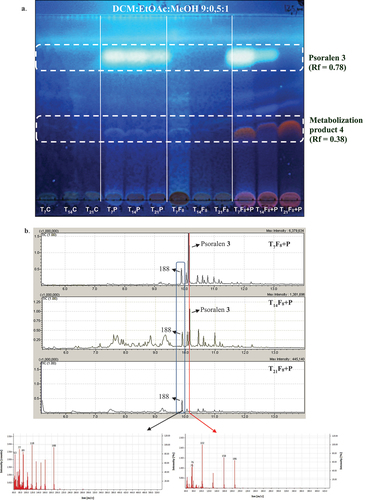
In the TLC analysis (DCM–EtOAc–MeOH 9:0.5:1), the band corresponding to psoralen (Rf = 0.78) was fully detected at day 7 (T7F8 + P) and decreased in intensity at day 14 (T14F8 + P), being undetectable at day 21 at 366 nm even after derivatisation with H2SO4 10% (T21F8 + P, ). At the same time periods, a more polar band (Rf = 0.38) was observed, increasing in intensity over the incubation time. This band was not detected in the control extracts ().
Figure 7. a. TLC analysis of extracts obtained at 7 days, 14 days and 21 days incubation of Alternaria alternata F8 in the psoralen 3 culture medium. Mobile phase DCM:EtOAc:MeOH (9:0.5:1). Detection: UV366 nm after spraying and heating with H2SO4 10%. b. GC–MS analysis of three selected EtOAc extracts belonging to 7 days (T7F8 + P), 14 days (T14F8 + P), and 21 days (T21F8 + P) of incubation of A. alternata F8 in the psoralen 3 culture medium. Detail of the fragmentation patterns of the peaks with Rt = 9.8 min and Rt = 10.2 min (psoralen 3).
The GC–MS analysis of the extracts confirmed the decrease of psoralen (Rt = 10.2 min) at day 7 (T7F8 + P) and 14 (T14F8 + P), being mostly undetectable at day 21 (T21F8 + P). On the other hand, a peak at Rt = 9.9 min with m/z = 188 was the only peak detected at day 21 (T21F8 + P, ). The extracts were also analysed by HRMS direct infusion in both (−) and (+) mode, Figure S16 shows the profiles at 21 days incubation of the extracts.
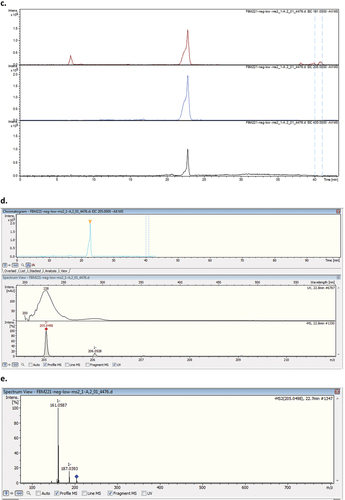
The chromatogram obtained by LC–MS/MS in negative mode of the T21F8 + P extract showed six peaks corresponding to the elution front (peak 1), glucose (peak 2), internal calibration standard traces (peak 3) and to the internal calibration standard (peak 6) (). The peak 4 showed an ion at m/z = 209.0466 already observed by HRMS in the control extract of F8 growth without psoralen (T21F8, Figure S16); meanwhile, the peak 5 showed an ion at m/z = 205.0498, also observed in the direct infusion HRMS analysis of the extract T21F8 + P (Figure S16). The MS2 analysis of the ion at m/z = 205.0498 gave two major fragments with m/z = 161.0587 (100%) and m/z = 187.0393 ().
Figure 8. LC–MS (TIC, negative mode) of the T21F8 + P extract. a. Peak 1 corresponds to the elution front, peaks 3 and 6 are internal calibrant, peak 2 corresponds to glucose, peak 4 could be a fungal metabolite. Peak 5 contains the ion at m/z = 205.0498. b. UV spectrum of peak 5. c. Deconvolution of the peak 5 (m/z = 161, m/z = 205, m/z = 433). d. EIC (205.00) chromatogram with detail of UV spectrum and the HRMS of the peak at Rt = 22.8 min. e. MS2 of the ion at m/z = 205.0498 (Rt = 22.7 min).
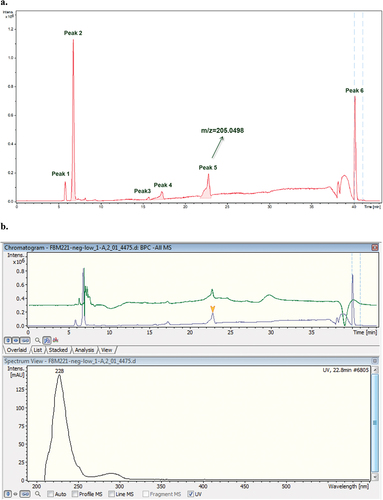
Figure 8. (Continued).
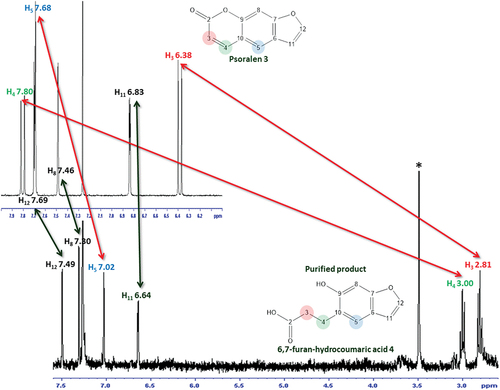
The experiment was scaled up under the same conditions, and the EtOAc extract T21F8 + P scaled was submitted to liquid–liquid partition, analysed by TLC and purified by preparative TLC. The purified fraction (0.8 mg) was more polar than psoralen 3; and its 1H NMR (CDCl3, Figure S14, ) spectrum showed signals at 2.81 ppm (2 H, t, 6.9–6.6 Hz), 3.00 ppm (2 H, t, 6.9–6.6 Hz) corresponding to two methylene groups, and 4 signals corresponding to aromatic hydrogens (7.02, 7.30, 6.64, and 7.49 ppm). The spectrum was compared with that of the psoralen 3 and the proposed structure was the 6,7-furan-hydrocoumaric acid (compound 4, ), a previously described product of biotransformation of psoralen (Marumoto and Miyazawa Citation2011). The HRMS analysis in negative mode showed an ion at m/z = 205.0498 (theoretical mass = 205.0501; C11H9O4, Δ ppm = −1.46), corresponding to the peak 5 of the LC–MS/MS; its fragmentation pattern was in agreement with previously published data () (Liu et al. Citation2019).
4. Discussion
4.1. Isolation and identification of fungal endophytes
The study of the fungal endophytic community of F. carica leaves allowed the isolation of 15 filamentous fungi. Nine isolates were purified from leaf fragments, noteworthy the rest was obtained after crushing the tissues under N2. Ficus carica contains laticiferous throughout all the tissues; the influence of the latex in the distribution of fungal endophytes in those tissues or even in the latex fluid is unknown. Moreover, latex coagulation after tissue fragmentation could prevent the free growth of fungal hyphae when fragments are placed in contact with the nutrient medium. Grinding the tissue aseptically with liquid N2 resulted in obtaining a greater number of isolations.
The presumptive morphological identification of fungal isolates was complemented by molecular identification which was carried out by PCR amplification with primers ITS1 and ITS4 followed by BLAST searches of the sequences obtained and comparison with sequences downloaded from the public database GenBank.
All the fungal genera isolated in this work have been previously isolated as endophytes; meanwhile, Alternaria, Cladosporium, Diaporthe, Epicoccum, and Ustilago have been already reported as endophytes from plants belonging to the genus Ficus (Feng and Ma Citation2010; Solis et al. Citation2016). However, to our knowledge, this is the first report of Curvularia, Myrothecium, Neofusicoccum, Nigrospora, and Preussia genera as endophytes of this plant genus. Cladosporium cladosporioides (F6, F7, F11, F12, and F15) represented the 27% of the isolated fungi, followed by Curvularia lunata (F13 and F 14, 13%).
Ustilago cynodontis F3 was the only basidiomycete isolated from F. carica leaves. This result is in agreement with previous observations that state that fungi belonging to Basidiomycota phylum are rarely isolated as endophytes. Nevertheless, the genus Ustilago was already reported, associated with Ficus religiosa (Chlebicki Citation2009; Solis et al. Citation2016).
The isolate F1 was identified as Preussia sp., meanwhile, the isolates F2–F15 were identified at species level. Cladosporium cladosporioides (five isolates) and Curvularia lunata (two isolates) were the two most frequently identified species ().
4.2. Chemical profiling
The use of secondary metabolite profiling seems to be of greatest value in ascomycetes and basidiomycetes and has been central in the development of fungal systematics, taxonomy, and ecology in the last decades (Abreu et al. Citation2012). Since metabolite profiles usually are typical of a given organism, the information provided often gives clear-cut classifications and can be used for identification of fungal isolates (Frisvad et al. Citation2008). A high similarity in the metabolic profiles between fungi of the same species (C. lunata and C. cladosporioides) was observed in this work when their extracts were compared by both ATLC () and 1H NMR ().
Here, the combination of 1H NMR metabolomics and multivariate statistical analysis showed a valuable, flexible, and accurate strategy for interpreting differences amongst fungi of different genera, confirming the results, obtained by the analysis of the ATLC chromatographic profiles. The NMR-based metabolomics is a powerful tool that should be utilised in the evaluation of the production of secondary metabolites by endophytic fungi. These observations are in agreement with our previous work that suggested that DI–ESI–QToF–MS and TLC associated with PCA metabolome analysis gave comparable results (Ruiz Mostacero et al. Citation2021). In addition, both techniques showed a differentiation of A. alternata F8 extract (). Alternaria alternata is a cosmopolitan fungal species widely distributed, both in soil and in organic matter, as a pathogen, saprophyte or symbiont, whose secondary metabolism has been widely studied. In recent years, the rate of isolation of this species as plant endophyte has been greatly increased, giving large amounts of bioactive compounds structurally characterised, with many others that need to be investigated in detail (Lou et al. Citation2013).
4.3. Bioactivity
The antimicrobial activity of the extracts indicated that 33% (A. alternata F8, D. infecunda F9, E. nigrum F10, and C. lunata F13–F14) inhibited at least one of the target microorganisms from the panel. Escherichia coli was inhibited by E. nigrum F10 at 25 μg/spot, meanwhile S. aureus was inhibited by A. alternata F8, E. nigrum F10, and C. lunata F13–F14. With regards to yeasts, C. albicans, C. neoformans and S. cerevisiae were inhibited by A. alternata F8 extract (25–100 μg/spot), and R. rubra was inhibited by C. lunata F14 at 100 μg/spot (, ).
Numerous reports discuss the antimicrobial activity of A. alternata and many of them have characterised the responsible compounds, for example tenuazonic acid was active against Mycobacterium tuberculosis H37Rv (Sonaimuthu et al. Citation2010), rubrofusarin B showed antifungal activity on C. albicans (Shaaban et al. Citation2012) and diketopiperazine dipeptides showed effectiveness by inhibiting sporulation of the pathogen Plasmopara viticola (Musetti et al. Citation2007). Nevertheless, and to the best of our knowledge, this is the first time that the antifungal activity of this organism has been reported on C. neoformans.
Diaporthe infecunda F9 inhibited the phytopathogenic filamentous fungus A. rabiei at 25 μg/spot; our results are in agreement with previous studies that demonstrated the capacity of Diaporthe spp. to inhibit phytopathogenic fungi (Ruiz Mostacero et al. Citation2021).
4.4. Metabolisation of F. carica extracts by fungal endophytes – psoralen biotransformation by A. alternata F8
The in vitro capacity of fungal endophytes to degrade host metabolites is not usually evaluated. However, this strategy could reveal ecological aspects about the relationship between the host plant and the microorganisms living in its tissues. Our approach was performed by formulation of a solid medium with F. carica leaf fragments rather than the organic extracts taking into consideration the similarity of leaf stromal tissue to the in vivo situation.
The analysis of the profiles of the EtOAc extracts after the incubation period with all the fungi was firstly performed with the flavonoid rutin 1 and the coumarin 8-methoxy-psoralen 2 as markers. The ATLC analysis showed several changes () both in the polarity region of rutin 1, with almost the disappearance of rutin 1 and associated bands belonging to related flavonoid glycosides (yellow bands in control extract which were absent in fungal extracts, ) and in the region of coumarins. More detailed investigations showed that a chromatographic band with similar UV profile but less polarity than 8-methoxy-psoralen 2 was almost undetectable in the extracts of the fungi grown on F. carica medium. Further analysis performed by GC–MS on the EtOAc extracts of the control and biotransformed F. carica 7.5% cultures confirmed that psoralen 3 was almost absent in the extracts of fungal endophytes after 21 d of culture, with a marked decrease after days 7 and 14 ().
Flavonoids are bioactive polyphenolic secondary metabolites with diverse chemical structures found in plants (Park et al. Citation2021). Rutin 1 is composed by the flavonol aglycone skeleton quercetin glycosylated with rutinose (6-O-α-L-rhamnosyl-D-glucose) linked in C-3 (Dewick Citation2009). The ability of fungal endophytes to bioconverse flavonoids has been reported. Recently, the biotransforming ability of rutin by the fungus E. nigrum, an endophyte isolated from Salix sp., was reported (Harwoko et al. Citation2019). Noteworthy, E. nigrum was one of the isolated fungal endophytes from F. carica, and our preliminary results indicate that it was able to biotransform rutin 1 as the other fungi, and the related flavonoid glycosides were also detected in the substrate extract Fc 7.5% (see yellowish bands like rutin 1, ).
Psoralen 3 is a furanocoumarin, a group of planar compounds which includes xanthotoxin and bergapten, produced and accumulated in F. carica (Plumlee Citation2004) and other plants to protect them from insects, livestock and microorganisms (Guo et al. Citation2000). Furanocoumarins are primary photosensitising agents (Dodge and Knox Citation1986) that are activated by long-wavelength ultraviolet light (320 to 380 nm) and cause extensive effects because of cross-linking of DNA, and tissue injury involving lipid-membrane alterations, secondary to fatty acid interactions with the activated furanocoumarins (Specht et al. Citation1988). Moreover, the antimicrobial effect of psoralen 3 and other furanocoumarins on filamentous fungi has been reported (Kuete et al. Citation2007).
Psoralen 3 was purified, fully characterised from the Hex extract of leaves of F. carica (Figures S1–S10), and added to a minimal culture medium to explore the ability of A. alternata F8 to biotransform it, as occurred when the Fc 7.5% medium was employed. The concentration of psoralen 3 was defined as 46 μg/mL, the same as that determined in the Fc 7.5% medium, lower than the MIC of psoralen 3 on A. alternata F8, which was determined at 200 μg/mL.
The chromatographic analysis of the EtOAc extracts T7F8 + P, T14F8 + P and T21F8 + P showed the decrease of psoralen 3 and the appearance of a new and more polar chromatographic band, especially in the T21F8 + P extract compared with the corresponding controls T7P, T14P, and T21P. These evidences of psoralen biotransformation to a more polar compound were detected by TLC (Rf = 0.38, mobile phase: DCM–EtOAc–MeOH 9:0.5:1), by LC–HRMS (Rt = 22.8 min, most intense ion at m/z = 205.0498, [M–H]− in the T21F8 + P) (), and confirmed by the purification of the 6,7-hydroxy-coumaric acid 4, which was characterised by 1H NMR and MS (, , Figure S14) (Marumoto and Miyazawa Citation2011).
Figure 9. Comparison of 1H NMR (300 MHz, CDCl3) spectra of psoralen 3 with the 6,7-furan-hydrocoumaric acid 4 purified from the T21F8 + P scaled extract. * MeOH residual.
To generate the 6,7-furan-hydrocoumaric acid 4, A. alternata F8 would hydrolyse the lactone ring of psoralen 3 followed or preceded by reduction of the Δ3,4 insaturation of the lactone ring. The detection of a compound with m/z = 188 at Rt = 9.9 min by GC–MS at the same incubation period in which compound 4 was detected (TLC and LC–MS) should indicate that the reduction of the cis-insaturation of the lactone ring occurred before the hydrolysis of the lactone itself (). Nevertheless, a computer matching of the fragmentation pattern at Rt = 9.9 min with the NIST database gave no results. In nature, the biohydrogenation of α,β-unsaturated esters occurs by reductases capable of catalysing the asymmetric reduction of activated C–C double bonds. Several microorganisms could carry out this processfor example, yeasts can reduce α,β-unsaturated aldehydes, ketones and esters, including lactones (Serra et al. Citation2019).
Figure 10. Proposed sequence of biotransformation of psoralen 3 by Alternaria alternata F8. The solid arrow shows the demonstrated pathway and dashed arrows show a postulated intermediary on the basis of the ion m/z = 188 detected by GC MS.
The biotransformation of furanocoumarins has been previously studied in other fungi. Cunninghamella elegans NRRL 1392 was studied to evaluate the metabolism of furanocoumarins in mammals, using this fungus as a model of metabolism for several xenobiotics; in the particular case of psoralen 3, a hydroxylation reaction occurs to generate bergaptol (Attia et al. Citation2016). Moreover, the biotransformation of psoralen 3 by Glomerella cingulata produced the 6,7-furan-hydrocoumaric acid 4 and 6,7-furan-o-hydrocoumaryl alcohol (Marumoto and Miyazawa Citation2011).
Psoralen 3 is known to possess antimicrobial activity against a broad spectrum of Gram (+), Gram (−) bacteria, and yeasts (Kuete et al. Citation2007). According to Mamoucha et al. (Citation2016), coumarins including psoralen 3, are biosynthesised in midribs where laticifers are located, and transferred and accumulated in the abaxial trichomes of the F. carica leaf. Therefore, while the fungi live inside the plant, they are not in direct contact with psoralen 3, but when forced to get in contact, the metabolisation occurs as a detoxification mechanism, avoiding its effects even at sub-inhibitory concentrations.
In spite more detailed investigations are deserved about the biotransforming process of the metabolites present in F. carica that are metabolised by its fungal endophytes (specially flavonoids like rutin 1 or coumarins different from the psoralen 3) and the biological significance of that our strategy could be useful to reveal more about the in-situ interaction of fungal endophytes with the host plant metabolome.
5. Conclusions
The endophytic fungal community associated with leaves of Ficus carica L. (Moraceae) from Argentina was investigated. Our results corroborate that F. carica can live symbiotically with rich and diverse endophytic communities which could be sources of bioactive molecules, including those able to inhibit bacteria and phytopathogenic fungi.
Fifteen fungal isolates were obtained and identified by molecular methods into the genera Alternaria, Cladosporium, Curvularia, Diaporthe, Epicoccum, Myrothecium, Neofusicoccum, Nigrospora, Preussia and Ustilago. Cladosporium cladosporioides and Curvularia lunata were the most frequently isolated species. Five isolates (33.3%) exhibited inhibitory activity against at least one of the microorganisms tested.
The endophytic A. alternata F8 presented the highest bioactivity spectrum (C. neoformans, C. albicans, S. cerevisiae, S. aureus), in addition to the largest difference in its metabolome profiling, which was demonstrated through multivariate analysis associated with automated TLC and 1H NMR.
The biotransforming ability of all the fungal isolates was tested on the F. carica metabolites. Most of them were able to biotransform the flavonoid rutin 1, and the coumarin psoralen 3. Further investigations of the psoralen biotransforming ability of A. alternata F8 showed the accumulation of the hydroxyfuran coumaric acid derivative 4 which was characterised by 1H NMR. The already demonstrated toxicity of psoralen 3 could be the driving force of the biotransformation process. Our results corroborate that F. carica can live symbiotically with rich and diverse endophytic fungal communities adding insights about their ecological interactions.
Supplemental Material
Download MS Word (2.6 MB)Acknowledgements
This work was supported by Consejo Nacional de Investigaciones Científicas y Técnicas de Argentina (CONICET, PIP 2120), FONCyT (PICT 2015 3508 and PICT 2015 3592), Universidad Nacional de Rosario (UNR, Grant PID 80020180300045UR), and Agencia Santafesina de Ciencia, Tecnología e Innovación (PEICID-2021-161). MIB acknowledges CONICET for the fellowship.
Disclosure statement
No potential conflict of interest was reported by the author(s).
Supplementary material
Supplemental data for this article can be accessed online at https://doi.org/10.1080/21501203.2023.2175500
Correction Statement
This article has been corrected with minor changes. These changes do not impact the academic content of the article.
Additional information
Funding
References
- Abdou R, Mojally M, Attia G. 2021. Investigation of bioactivities of endophytes of Ficus carica L. Fam Moraceae Bull Natl Res Cent. 45:49. doi:10.1186/s42269-021-00505-1.
- Abreu LM, Costa SS, Pfenning LH, Takahashi JA, Larsen TO, Andersen B, Bonfante P. 2012. Chemical and molecular characterization of Phomopsis and Cytospora -like endophytes from different host plants in Brazil. Fungal Biol. 116:249–260. doi:10.1016/j.funbio.2011.11.008.
- Attia GA, Abou-El-seoud KA, Ibrahim A-RS. 2016. Biotransformation of coumarins by Cunninghamella elegans. Af J Pharmacy Pharmacol. 10(18):411–418. doi:10.5897/AJPP2015.4419.
- Bacon CW, White J, Eds. 2000. Microbial Endophytes. 1st ed. CRC Press. doi:10.1201/9781482277302.
- Barolo MI, Ruiz Mostacero N, López SN. 2014. Ficus carica L. Moraceae. 164:119–127.
- Castelli MV, López SN. 2022. Chemistry, Biological activities, and uses of Ficus carica latex. In: Murthy HN, editor. Gums, Resins and Latexes of Plant Origin. Reference Series in Phytochemistry. Cham: Springer. doi:10.1007/978-3-030-91378-6_34.
- Chlebicki A. 2009. Some endophytes of Juncus trifidus from Tatra Mts. in Poland. Acta Mycol. 44(1):11–17. doi:10.5586/am.2009.003.
- Dewick PM. 2009. Medicinal natural products: a biosynthetic approach. 3rd ed. Chichester (UK): John Wiley & Sons; p. 539.
- Dodge AD, Knox JP. 1986. Photosensitizers from plants. Pesticide Sci. 17:579. doi:10.1002/ps.2780170515.
- Elgamal MHA, Elewa NH, Elkhrisy EAM, Duddeck H. 1979. 13C NMR chemical shifts and carbón-proton coupling constants of some furocoumarins and furochromones. Phytochemistry. 18(1):139–143. doi:10.1016/S0031-9422(00)90932-4.
- The European Committee on Antimicrobial Susceptibility Testing - EUCAST. 2022. [accessed 2022 Nov 2]. https://www.eucast.org/eucast_news/news_singleview?tx_ttnews%5Btt_news%5D=481&cHash=8c2e4a8022c212c27ad80e1f24a475e7
- Feng C, Ma Y. 2010. Isolation and Anti-phytopathogenic Activity of Secondary Metabolites from Alternaria sp. FL25, an Endophytic Fungus in Ficus carica. Chin J Appl Environ Biol. 16(1):76–78. doi:10.3724/SP.J.1145.2010.00076.
- Fichou D, Ristivojević P, Morlock GE. 2016. Proof-of-Principle of rTLC, an Open-Source Software Developed for Image Evaluation and Multivariate Analysis of Planar Chromatograms. Anal Chem. 88(24):12494–12501. doi:10.1021/acs.analchem.6b04017.
- Flores-Vallejo RC, Folch-Mallol JL, Sharma A, Cardoso-Taketa A, Alvarez-Berber L, Villarreal ML. 2020. ITS2 ribotyping, in vitro anti-inflammatory screening, and metabolic profiling of fungal endophytes from the Mexican species Crescentia alata Kunth. S Afr J Bot. 134:213–224. doi:10.1016/j.sajb.2019.12.030.
- Frisvad JC, Andersen B, Thrane U. 2008. The use of secondary metabolite profiling in chemotaxonomy of filamentous fungi. Mycol Res. 112(2):231–240. doi:10.1016/j.mycres.2007.08.018.
- Guo LQ, Taniguchi M, Xiao YO, Baba K, Ohta T, Yamazoe Y. 2000. Inhibitory effect of natural furanocoumarins on human microsomal cytochrome P450 3A activity. Jpn J Pharmacol. 82:122–129. doi:10.1254/jjp.82.122.
- Harwoko H, Hartmann R, Daletos G, Ancheeva E, Frank M, Liu Z, Proksch P. 2019. Biotransformation of Host Plant Flavonoids by the Fungal Endophyte Epicoccum nigrum. Chemistry Select. 4:13054–13057.
- Instituto de Ciencia y Tecnología de alimentos Córdoba - ICYTAC-UNC-CONICET. 2022. [Accesed 2022 oct 30].https://www.icytac.conicet.unc.edu.ar/servicios/hplc-hrms/
- Kuete V, Metuno R, Ngameni B, Tsafack AM, Ngandeu F, Fotso GW, Beng VP. 2007. Antimicrobial activity of the methanolic extracts and compounds from Treculia obovoidea (Moraceae). J Ethnopharmacol. 112(3):531–536. doi:10.1016/j.jep.2007.04.010.
- Liang XA, Ma YM, Zhang HC, Liu R. 2016. A new helvolic acid derivative from an endophytic Fusarium sp. of Ficus carica. Nat Prod Res. 30(21):2407–2412. doi:10.1080/14786419.2016.1190722.
- Lim SM, Agatonovic-Kustrin S, Lim FT, Ramasamy K. 2021. High-performance thin layer chromatography-based phytochemical and bioactivity characterisation of anticancer endophytic fungal extracts derived from marine plants. J Pharm and Biomed Anal. doi:10.1016/j.jpba.2020.113702.
- Liu L, Zhang L, Cui Z-X, Liu X-Y, Xu W, Yang X-W. 2019. Transformation of psoralen and isopsoralen by human intestinal microbial in vitro, and the biological activities of its metabolites. Molecules. 24(22):4080. doi:10.3390/molecules24224080.
- Li Z, Yang Y, Liu M, Zhang C, Shao J, Hou X, Tian J, Cui Q. 2021. A comprehensive review on phytochemistry, bioactivities, toxicity studies, and clinical studies on Ficus carica Linn. Leaves Biomed Pharmacother. 137:111393. doi:10.1016/j.biopha.2021.111393.
- Llorente B, López MG, Carrari F, Asís R, Naranjo RDDP, Flawiá MM, Bravo-Almonacid F. 2014. Downregulation of polyphenol oxidase in potato tubers redirects phenylpropanoid metabolism enhancing chlorogenate content and late blight resistance. Mol Breed. 34(4):2049–2063. doi:10.1007/s11032-014-0162-8.
- Lou J, Fu L, Peng Y, Zhou L. 2013. Metabolites from Alternaria fungi and their bioactivities. Molecules. 18(5):5891–5935. doi:10.3390/molecules18055891.
- Ma YM, Liang XA, Zhang HC, Liu R. 2016. Cytotoxic and Antibiotic Cyclic Pentapeptide from an Endophytic Aspergillus tamarii of Ficus carica. J Agric Food Chem, 64(19): 3789−3793. doi:10.1021/acs.jafc.6b01051.
- Mamoucha S, Fokialakis N, Christodoulakis NS. 2016. Leaf structure and histochemistry of Ficus carica (Moraceae), the fig tree. Flora. 218:24–34. doi:10.1016/j.flora.2015.11.003.
- Marumoto S, Miyazawa M. 2011. Microbial reduction of coumarin, psoralen, and xanthyletin by Glomerella cingulata. Tetrahedron. 67(2):495–500. doi:10.1016/j.tet.2010.10.089.
- Masuda T, Takasugi M, Anetai M. 1998. Psoralen and other linear furanocoumarins as phytoalexins in Glehnia littoralis. Phytochemistry. 47(1):13–16. doi:10.1016/S0031-9422(97)00528-1.
- Musetti R, Polizzotto R, Vecchione A, Borselli S, Zulini L, D’Ambrosio M, Di Toppi LS, Pertot I. 2007. Antifungal activity of diketopiperazines extracted from Alternaria alternata against Plasmopara viticola: an ultrastructural study. Micron. 38:643–650. doi:10.1016/j.micron.2006.09.001.
- Nagarajan K, Ibrahim B, Ahmad Bawadikji A, Lim JW, Tong WY, Leong CR, Khaw KY, Tan WN. 2022. Recent Developments in Metabolomics Studies of Endophytic Fungi. J Fungi. 8:28. doi:10.3390/jof8010028.
- Oliveira AP, Baptista P, Andrade PB, Martins F, Pereira JA, Silva BM, Valentão P. 2012. Characterization of Ficus carica L. Food Res Int. 49:710–719.
- Park C-M, Kim G-M, Cha G-S. 2021. Biotransformation of Flavonoids by Newly Isolated and Characterized Lactobacillus pentosus NGI01 Strain from Kimchi. Microorganisms. 9:1075. doi:10.3390/microorganisms9051075.
- Plumlee KH. 2004. Chapter 25 – plants. KH P editor. Clinical Veterinary Toxicology. Mosby. 337–442. doi:10.1016/B0-32-301125-X/50028-5.
- Rahalison L, Hamburger M, Hostettmann K, Monod M, Frenk E. 1991. A bioautographic agar overlay method for the detection of antifungal compounds from higher plants. Phytochem Anal. 2:199–203. doi:10.1002/pca.2800020503.
- Reich E, Schibli A. 2007. High-Performance Thin-Layer Chromatography for the Analysis of Medicinal Plants. Thieme. 280.
- Ren Y, Song X, Tan L, Gui C, Wang M, Liu H, Cao Z, Li Y, Peng C. 2020. A review of the pharmacological properties of psoralen. Front Pharmacol. 11:571535. doi:10.3389/fphar.2020.571535.
- Rosli N, Ashari K, Ahmad A, Nur S. 2020. Isolation and preliminary screening of endophytic fungi from Ficus carica for biocontrol and phosphates solubilisation. Ees. 4:77–84.
- Ruiz Mostacero N, Castelli MV, Barolo MI, Amigot SL, Fulgueira CL, López SN. 2021. Fungal endophytes in Peperomia obtusifolia and their potential as inhibitors of chickpea fungal pathogens. World J Microbiol Biotechnol. 37:14. doi:10.1007/s11274-020-02954-8.
- Ruiz Mostacero N, Castelli MV, Cutró AC, Hollmann A, Batista JJM, Furlan M, Valles J, Fulgueira CL, López SN. 2019. Antibacterial activity of prenylated benzopyrans from Peperomia obtusifolia (Piperaceae). Nat Prod Res. 35(10):1706–1710. doi:10.1080/14786419.2019.1628751.
- Saeed MA, Sabir A. 2002. Irritant potential of triterpenoids from Ficus carica leaves. Fitoterapia. 73(5):417–420. doi:10.1016/S0367-326X(02)00127-2.
- Schulz B, Boyle C. 2006. What are Endophytes? In: Schulz BJE, Boyle CJC, Sieber TN, editors. Microbial Root Endophytes. Soil Biology. Vol. 9. Berlin (Heidelberg): Springer. p. 1–13. doi:10.1007/3-540-33526-9_1.
- Schulz B, Boyle C, Draeger S, Rommert AK, Krohn K. 2002. Endophytic fungi: a source of novel biologically active secondary metabolites. Mycol Res. 106:996–1004. doi:10.1017/S0953756202006342.
- Serra S, Castagna A, Valentino M. 2019. Biocatalytic synthesis of natural dihydrocoumarin by microbial reduction of coumarin. Catalysts. 9(8):665. doi:10.3390/catal9080665.
- Shaaban M, Shaaban KA, Abdel-Aziz MS. 2012. Seven naphtho-γ-pyrones from the marinederived fungus Alternaria alternata: structure elucidation and biological properties. Org Med Chem Lett. 2:6. doi:10.1186/2191-2858-2-6.
- Solis MJL, Cruz TED, Schnittler M, Unterseher M. 2016. The diverse community of leaf-inhabiting fungal endophytes from Philippine natural forests reflects phylogenetic patterns of their host plant species Ficus benjamina, F. elastica and F. religiosa. Mycoscience. 57(2):96–106. doi:10.1016/j.myc.2015.10.002.
- Sonaimuthu V, Parihar S, Thakur JP, Luqman S, Saikia D, Chanotiya CS, Jhonpaul M, Negi AS. 2010. Tenuazonic acid: a promising antitubercular principle from Alternaria alternata. Microbiol Res. 2:63–65.
- Specht KG, Kittler L, Midden WR. 1988. A new biological target of furacoumarins: photochemical formation of covalent adducts with unsaturated fatty acids. Photochem Photobiol. 47:537. doi:10.1111/j.1751-1097.1988.tb08841.x.
- Tang CM, Cohen J, Holden DW. 1992. An Aspergillus fumigatus alkaline protease mutant constructed by gene disruption is deficient in extracellular elastase activity. Mol Microbiol. 6:1663–1671. doi:10.1111/j.1365-2958.1992.tb00891.x.
- Wagner H, Bladt S. 1996. Plant Drug Analysis: a Thin Layer Chromatography Atlas. 2nd ed. Berlin: Springer-Verlag.
- White TJ, Bruns TD, Lee SB, Taylor JW. 1990. Amplification and direct sequencing of fungal ribosomal RNA genes for phylogenetics. In: Innis MA, Gelfand DH, Sninsky JJ, White TJ, editors. PCR Protocols: a guide to methods and applications. New York: Academic Press; p. 315–322.
- Wilson D. 1995. Endophyte: the evolution of a term, and clarification of its use and definition. Oikos. 73:274–276. doi:10.2307/3545919.
- Zhang HC, Ma YM, Liu R. 2012b. Antimicrobial additives from endophytic fungus Fusarium solani of Ficus carica. Appl Mech Mater. 178:783–786.
- Zhang HC, Ma YM, Liu R, Zhou F. 2012a. Endophytic fungus Aspergillus tamarii from Ficus carica L., a new source of indolyl diketopiperazines. Biochem Syst Ecol. 45:31–33. doi:10.1016/j.bse.2012.07.020.