
Abstract
The Great East Japan Earthquake and Tsunami on 11 March 2011 led to the Fukushima Daiichi nuclear disaster. The Japanese government subsequently outlined an evacuation zone around the power plant, and all residents were evacuated. In the absence of cropland or urban vegetation management, land cover was expected to change. The changes in vegetation cover following the nuclear disaster are presented using long-term time series data obtained from Moderate Resolution Imaging Spectroradiometer (MODIS) sensors. Utilizing MODIS 250 m spatial resolution observations, clear signals of vegetation changes were detected following the disaster in 2011. The areas affected were non-forest regions (mostly paddy fields) within the 20 km radius evacuation zone around the power plant. Multi-year comparisons of vegetation seasonality indicated that the changes can be explained by the natural succession of abandoned cropland. The affected area within the 20 km radius is equivalent to about 20% of the total area affected by the tsunami.
1. Introduction
The Great East Japan Earthquake and Tsunami on 11 March 2011 triggered the Fukushima Daiichi nuclear disaster. The damage caused to the Fukushima Daiichi Nuclear Power Plant resulted in unprecedentedly high emissions of radioactive materials into the atmosphere, which would eventually be deposited on land. Correspondingly, high concentrations of radioactive materials were reported around the power plant (e.g. Yasunari et al. Citation2011). Due to the high radiation levels, the Japanese government declared a 20 km evacuation zone around the Fukushima Daiichi Nuclear Power Plant and an irregular zone extending northwest of the power plant in April 2011. As a result of this policy, around 110,000 people were evacuated from that zone by March 2013, 2 years after the disaster (Ministry of Environment Citation2013).
Monitoring of vegetation land cover changes is important for evaluating two types of environmental changes induced by the nuclear disaster and earthquake. The first is associated with direct changes caused by the physical impact of the tsunami; the second is the indirect change related to human decision making. The former was evaluated by Liou et al. (Citation2012) and Ramírez-Herrera and Navarrete-Pacheco (Citation2013) using satellite-based remote sensing data, revealing that coastal areas were affected by the tsunami disaster. The latter could be investigated through land cover and vegetation changes caused by changes in human settlements, which have not been evaluated yet. Remote sensing is the only method by which these environmental changes are analysed, since the area, governed by strict environmental and political conditions, is set as an evaluation zone and direct monitoring is extremely difficult.
The Fukushima Daiichi nuclear disaster is unique in terms of the co-occurrence of earthquake, tsunami, and nuclear accident, and therefore it is important to assess the impacts of the disaster. Previously, the impacts of similar disasters were assessed using remote sensing data in the cases of the Chernobyl nuclear disaster (Hostert et al. Citation2011) and the 2004 Indian Ocean tsunami caused by the Sumatra-Andaman earthquake (Belward et al. Citation2007). These studies reported resulting land use changes using only two images of the pre- and post-disaster periods; utilization of long-term data series is another approach for detecting changes.
Medium spatial resolution data, such as Landsat Enhanced Thematic Mapper Plus (ETM+) data, were conventionally used to detect changes in vegetation status at the local administrative scale. However, frequent cloud cover and low revisiting frequency made detection using such medium spatial resolution sensors difficult. The use of lower spatial resolution data (e.g. 250 m) is another available choice for detecting vegetation changes (Zhan et al. Citation2002; Lunetta et al. Citation2006; Sakamoto et al. Citation2006) due to higher temporal resolution (e.g. daily). Detection of land cover change is effective if we use multi-year data of seasonal variations in the land surface observed by high temporal resolution sensors (Lunetta et al. Citation2006; Alcantara et al. Citation2012).
The purpose of this study is to detect possible land cover and vegetation changes around the Fukushima Daiichi plant after the March 2011 accident, using time series of data acquired by the Moderate Resolution Imaging Spectroradiometer (MODIS) sensors. We hypothesized that there would be changes in land cover and vegetation, which are detectable from satellite data. This study focuses on how land cover and vegetation have been changing within the evacuation zone (20 km radius of the power plant) after the nuclear disaster.
2. Materials and method
2.1. Study region
The study region comprises Fukushima Prefecture, Japan (), which covers an area of 13,783 km2. The region is geographically divided into three sub-regions: Hamadori, Nakadori, and Aizu. Hamadori is the eastern part, extending along the ocean; Nakadori is the central valley; and Aizu is the western, mountainous region of the prefecture. The climate is characterized as cool-temperate with varying snowfall levels: heavy in Aizu, intermediate in Nakadori, and low in Hamadori. The mean annual temperature is 12.8 °C in Fukushima City (1971–2000 average). The dominant land cover class is forest (68%), followed by rice paddy fields (11%). Fukushima is an important prefecture for Japanese agriculture, with the fourth-highest rice production in 2010.
Figure 1. (a) Location of and (b) land cover in Fukushima Prefecture, Japan. Selected analysis areas (b), Futaba, Fukushima-Date, and Koriyama, are marked. The primary land cover class data at 250 m spatial resolution were used as the land cover data.
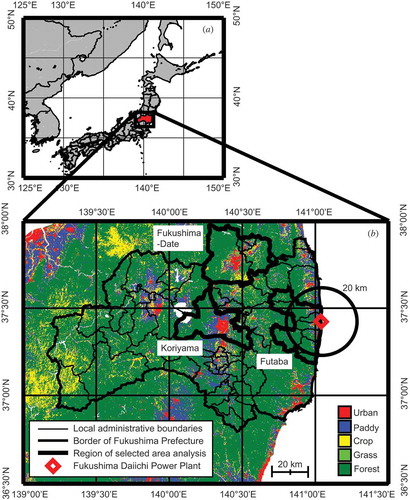
The Fukushima Daiichi Nuclear Power Plant is located in the coastal region of Futaba County (). The two large cities in the prefecture, Fukushima and Koriyama, are located in the Nakadori area, approximately 60 km from the power plant. The highest radiation level regions are distributed in the northwesterly direction from the power plant (Extension Site of the Distribution Map for Radiation Dose, Digital Japan; http://ramap.jmc.or.jp/map/eng/). In April 2011, the evacuation zone was set at a 20 km radius around and to the northwest of the power plant.
2.2. Data
We used both Aqua and Terra MODIS 250 m vegetation index (VI) products (MYD13Q1 and MOD13Q1 Collection 5) (Huete et al. Citation2002) from 2003 to 2013, provided by the United States Geological Survey (Land Processes Distributed Active Archive Center). The data supplied had 250 m spatial resolution and 16 day composite periods. The 16 day composite data were created by selecting the best observation condition data using daily observations. Prior to data analysis, quality control was conducted by removing poor quality data to minimize atmospheric and other possible noise. Only pixels with good quality, as defined by the VI quality assessment (QA) science datasets, were used. Good data were defined as those classified as ‘VI produced with good quality’ or ‘VI produced, but check other QA’, ‘VI usefulness’ is better than lowest quality, ‘no adjacent cloud’, ‘no mixed cloud’, ‘no possible snow’, and ‘no possible shadow’ for all the MYD13 and MOD13 products.
The detailed land use and land cover map provided by the Japanese Aerospace Exploration Agency (JAXA) v14.02 (Hashimoto et al. Citation2014) was used to analyse temporal variations in the VI for specific land cover classes. The dataset was created on a kernel-based machine-learning classification, using multi-temporal Advanced Land Observing Satellite (ALOS) and Advanced Visible and Near Infrared Radiometer type-2 (AVNIR-2) data. The data were produced with 30 m spatial resolution and nine land cover classes, with a reported accuracy of 85%. The 30 m resolution land cover data were further processed to ensure consistency with the spatial resolution of MODIS data. Two datasets for land cover classes, ‘primary land cover class’ and ‘pure-pixel-only land cover class’ were generated. The former was created by assigning the most frequent land cover class in each grid, and the latter by assigning the dominant (>80%) land cover class to each pixel to extract pure pixels (pixels that contain only dominant land cover class).
2.3. Analysis
2.3.1. Selected area analysis
Using the Aqua MODIS normalized difference vegetation index (NDVI) 250 m product, the changes in vegetation after 2011 were analysed for two dominant land cover classes (forest and paddy) in the three selected regions (Futaba, Fukushima – Date, and Koriyama) () through their seasonal variations. These regions were selected because of their extensive paddy field coverage. A large proportion of the Futaba region is within 20 km radius of the power plant and all residents within the 20 km zone were evacuated; Fukushima – Date and Koriyama are located approximately 60 km away. Using the pure-pixel-only land cover class data (Section 2.2), the average NDVI of the corresponding land cover class was calculated for each 16 day period using Aqua MODIS NDVI data. Only good quality pixels (Section 2.2) were used for averaging. Seasonal variations at 16 day temporal periods were analysed. The differences between the pre- (2003–2010) and post-(2011–2013) disaster periods are discussed.
To confirm the robustness of the detected differences in the Aqua MODIS NDVI, two further VI datasets, Aqua MODIS enhanced vegetation index (MYD13Q1 EVI) and Terra MODIS NDVI (MOD13Q1 NDVI), were analysed. Using the same procedure, differences in Aqua MODIS EVI and Terra MODIS NDVI between the pre- (2003–2010) and post-(2011–2013) disaster periods were analysed for each region and land cover class. The potential reasons for the detected VI differences after the earthquake are discussed.
2.3.2. Spatial analysis
Spatial analysis was conducted in the entire Fukushima Prefecture to identify prefecture-wide changes in land cover and vegetation after 2011. Pixels with significant NDVI changes after 2011 were identified using Aqua MODIS NDVI. As the most notable changes in NDVI after the disaster in 2011 were confirmed between mid-September and the end of October (Section 3.1), the average of three 16 day periods (day of year = 265, 281, and 297) in each year was used to calculate the NDVI average and standard deviation from 2003 to 2010. Averages from 2011 to 2013 were also calculated in the same way. In each grid, the standardized anomaly (Z = (Y – X)/σ, where Z is the standardized anomaly, Y is the 2011–2013 average, X is the 2003–2010 average, and σ is the standard deviation of the 2003–2010 data) was calculated based on a similar approach used by Xu et al. (Citation2011). It was assumed that pixels with |Z|>2 could be identified as anomalous pixels (compared with the baseline period 2003–2010) with high confidence.
3. Results
3.1. Selected area analysis
Of all the forest and paddy areas in the three regions, only the paddy areas in Futaba County showed clear NDVI differences before and after the earthquake (). These areas had higher NDVI values in the autumn (mid-September to mid-November) of 2011–2013 and the spring (end of April to May) of 2012 and 2013 than those of the baseline period (2003–2010). Lower NDVI values were observed from spring to early summer (mid-April to June) of 2011 compared with the baseline period (). From 2011 to 2013, seasonal NDVI variations in the paddy areas in Fukushima-Date and Koriyama ( and ) and forest areas in all three regions () were similar to those for the baseline period.
Figure 2. Mean seasonal normalized difference vegetation index (NDVI) variations from 2003 to 2010 (including standard deviations), 2011, 2012, and 2013 averaged over paddy pixels of (a) Futaba, (b) Fukushima-Data, and (c) Koriyama; and forest pixels of (d) Futaba, (e) Fukushima-Date, and (f) Koriyama. The pure-pixel-only land cover class data were used to identify paddy and forest pixels. N denotes the number of pixels in each region and land cover class. The areal average of each region was calculated by screening out poor-quality data.
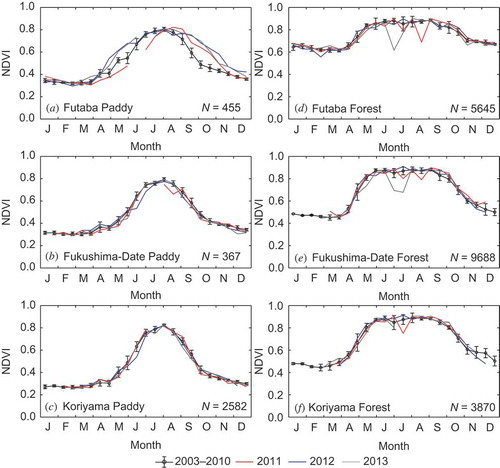
NDVI anomalies detected in paddy areas of Futaba County could be explained by changes in land use after 2011. In the years 2003–2010, the three regions showed similar seasonal variations in paddy NDVI, because the NDVI variations followed similar crop calendars. Rice is generally planted in mid-May, and harvested in mid- to late-September. After the earthquake and nuclear disaster, the residents of Futaba evacuated the region. Routine rice farming ceased and the paddy fields remained bare in the spring and early summer of 2011, resulting in negative anomalies in the NDVI values. During the harvesting season, bare land would typically remain in the paddy field after the harvest, corresponding to a natural drop in the NDVI value. However, after the nuclear disaster, most paddy regions in Futaba were covered with natural grasses that grew throughout summer and remained unmanaged. Similarly, positive NDVI anomalies in 2012 and 2013 can be explained by the presence of natural vegetation such as grasses.
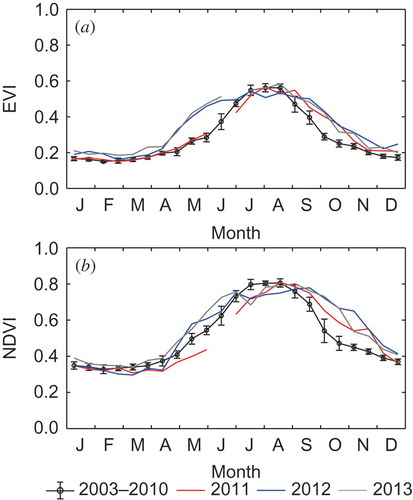
The NDVI anomalies detected after 2011 in the paddy regions of Futaba are consistent between different VIs and satellites (). After 2011, both Aqua MODIS EVI and Terra MODIS NDVI show seasonal anomalies that are consistent with Aqua MODIS NDVI. The one exception is that EVI does not show a negative anomaly in the spring and summer of 2011 (). The differences between NDVI and EVI responses to changes in land cover can be explained by the inclusion of blue band reflectance in EVI. Significantly higher blue band reflectance (blue band reflectances in April are 0.041 ± 0.005 in 2003–2010, 0.057 in 2011, 0.044 in 2012, and 0.049 in 2013) results in lower EVI, while NDVI is significantly higher during spring of 2011 than in normal years.
Figure 3. Seasonal variations in (a) Aqua MODIS enhanced vegetation index (EVI) and (b) Terra MODIS normalized difference vegetation index (NDVI) in paddy pixels of Futaba. Details are same as provided in .
3.2. Spatial analysis
Positive NDVI anomalies from 2011 to 2013 are mostly distributed over the coastal regions around the Fukushima Daiichi Nuclear Power Plant (). These areas were mostly within the 20 km exclusion zone, and are characterized by non-forest vegetation (). The positive NDVI anomalies also occurred in paddy and cropland areas in the surrounding cities of Minamisoma and Iidate (). Those cities were also designated as the evacuation zones, since some areas are within the 20 km region (Minamisoma), and subject to high levels of annual cumulative radiation (Iidate).
Figure 4. Detected normalized difference vegetation index (NDVI) anomalies from 2011 to 2013, using the years 2003–2010 as the baseline periods. Locations of Minamisoma and Iidate are indicated in the figure
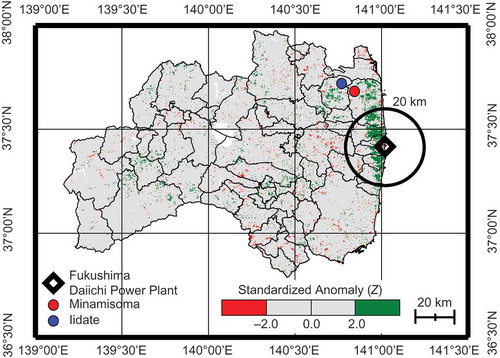
Anomalous pixels within the 20 km exclusion zone were mostly located in the non-forest areas (). Among the various land cover classes, 76% of paddy, 59% of cropland, and 50% of urban pixels showed positive NDVI anomalies after 2011. In contrast, only 7% of forest regions show positive NDVI anomalies. As this study relies on a spatial resolution of 250 m and the land cover within the area is highly heterogeneous, positive NDVI anomalies in forest pixels of the primary land cover class data may be due to the effects of the mixture of different land cover classes within the 250 m pixel.
Table 1. Comparison of positive vegetation index (VI) anomaly areas within a 20 km radius of the Fukushima Daiichi Nuclear Power Plant after 2011 in each land cover class. Areas showed positive anomalies (standardized anomaly (Z) > 2) from 2011 to 2013 compared with the period 2003–2010. Aqua MODIS NDVI and the primary land cover class data were used for the analysis.
4. Discussion and conclusion
Using MODIS 250 m sensor data, significant vegetation and land cover changes were identified around the Fukushima Daiichi Nuclear Power Plant after the Fukushima nuclear disaster. These changes were mostly within paddy, cropland, and urban regions, with minimal changes detected in natural vegetation areas such as forests. The changes identified can be explained by the indirect effects of the Fukushima nuclear disaster, namely the evacuation of residents and abandonment of paddy fields; in other words, the shift from man-made to natural ecosystems. Other possibilities, such as meteorological anomalies and errors and uncertainties in satellite observations, can be ruled-out because their influences are usually more extensive than the anomalies found in the present study. For example, we confirmed that interannual anomalies of temperature and precipitation occurred coherently over Fukushima Prefecture (see supplementary Figure S1), and these climate anomalies do not correspond to the detected VI anomalies. Meanwhile, multiple temporal data (e.g. 3 years) show consistent and localized VI anomalies clustered only around the nuclear plant and mostly in the specific land cover classes (e.g. paddy, cropland, and urban) ( and ).
Changes in vegetation and land cover due to evacuation and abandoned managed lands were extensive in comparison with the area directly affected by the tsunami following the East Japan Earthquake. The tsunami inundated an area estimated to be 461 km2 for all land types (Geospatial Information Authority of Japan Citation2013) and 202 km2 for croplands (Ministry of Agriculture, Forestry and Fisheries Citation2011). This study estimates the area of altered land to be 96.7 km2 (), which is equivalent to 21% of the total area affected by the tsunami, and 48% of the cropland area. Our estimation is limited to the 20 km exclusion zone around the power plant, and the abandoned paddy fields and cropland are unlikely to recover for several decades due to evacuation. Therefore, the impact of the nuclear disaster on land use is even greater than the direct damage by the tsunami, which recovers in several years at most.
This study also demonstrated that environmental changes at the local administration scale can be detected using low spatial resolution (e.g. 250 m) sensors such as MODIS. The advantage of frequent observations (i.e. daily) is important when monitoring land cover changes at interannual time scales. In addition, the use of multiple-year observation data facilitates robust analysis of spatio-temporal changes. Further analysis is required to make estimations for more practical applications for national- and local government-scale assessment. Medium spatial resolution data such as Landsat-series data are appropriate for monitoring changes in spatial details; however, less frequent observation may sometimes make the detection of interannual variations difficult, as a result of cloud cover and other noise.
In summary, detailed analysis of MODIS 250 m VI data detected significant changes in vegetation and land cover around the Fukushima Daiichi Nuclear Power Plant following the East Japan Earthquake and the subsequent nuclear accident. The changes were mostly within non-forest areas surrounding the nuclear plant. These results indicate the regeneration of natural vegetation following the evacuation of residents and abandonment of paddy fields, cropland, and urban vegetation. Continuous monitoring of these regions is important for studying the long-term regeneration of natural ecosystems and for estimating economic losses associated with the abandonment of human settlements. This study also demonstrated that long-term data of a low spatial resolution satellite can be used for monitoring land cover changes in complex and heterogeneous landscapes at local administrative scales.
Disclosure statement
No potential conflict of interest was reported by the authors.
Supplemental data
Supplemental data for this article can be accessed here.
ORCID
Kazuhito Ichii ![]() http://orcid.org/0000-0002-8696-8084
http://orcid.org/0000-0002-8696-8084
Additional information
Funding
References
- Alcantara, C., T. Kuemmerle, A. V. Prishchepov, and V. C. Radeloff. 2012. “Mapping Abandoned Agriculture with Multi-Temporal MODIS Satellite Data.” Remote Sensing of Environment 124: 334–347. doi:10.1016/j.rse.2012.05.019.
- Belward, A. S., H.-J. Stibig, H. Eva, F. Rembold, T. Bucha, A. Hartley, R. Beuchle, D. Khudhairy, M. Michielon, and D. Mollicone. 2007. “Mapping Severe Damage to Land Cover Following the 2004 Indian Ocean Tsunami Using Moderate Spatial Resolution Satellite Imagery.” International Journal of Remote Sensing 28: 2977–2994. doi:10.1080/01431160601091803.
- Geospatial Information Authority of Japan. 2013. Information on the Great East Japan Earthquake in 2011, January 11. [In Japanese.] http://www.gsi.go.jp/BOUSAI/h23_tohoku.html
- Hashimoto, S., T. Tadono, M. Onosato, M. Hori, and K. Shiomi. 2014. “A New Method to Derive Precise Land-Use and Land-Cover Maps Using Multi-Temporal Optical Data.” [ In Japanese.] Journal of Remote Sensing Society of Japan 34: 102–112. http://www.eorc.jaxa.jp/ALOS/lulc/lulc_jindex.htm.
- Hostert, P., T. Kuemmerle, A. Prishchepov, A. Sieber, E. F. Lambin, and V. Radeloff. 2011. “Rapid Land Use Change after Socio-Economic Disturbances: The Collapse of the Soviet Union versus Chernobyl.” Environmental Research Letters 6: 045201. doi:10.1088/1748-9326/6/4/045201.
- Huete, A., K. Didan, T. Miura, E. P. Rodriguez, X. Gao, and L. G. Ferreira. 2002. “Overview of the Radiometric and Biophysical Performance of the MODIS Vegetation Indices.” Remote Sensing of Environment 83: 195–213. doi:10.1016/S0034-4257(02)00096-2.
- Liou, Y. A., H. C. Sha, T. M. Chen, T. S. Wang, Y. T. Li, Y. C. Lai, M. H. Chiang, and L. T. Lu. 2012. “Assessment of Disaster Losses in Rice Paddy Field and Yield After Tsunami Induced by the 2011 Great East Japan Earthquake.” Journal of Marine Science and Technology 20: 628–623. doi:10.6119/JMST-012-0328-2.
- Lunetta, R. S., J. F. Knight, J. Ediriwickrema, J. G. Lyon, and L. D. Worthy. 2006. “Land-Cover Change Detection Using Multi-Temporal MODIS NDVI Data.” Remote Sensing of Environment 105: 142–154. doi:10.1016/j.rse.2006.06.018.
- Ministry of Agriculture, Forestry and Fisheries. 2011. Estimated Cropland Area Damaged by the Tsunami, March 29. [In Japanese.] http://www.maff.go.jp/j/tokei/saigai/pdf/shinsai.pdf
- Ministry of Environment. 2013. Kankyo Hakusho - Junkangata Shakai Hakusho - Seibutsu Tayosei Hakusho. [ In Japanese.] Tokyo: Nikkei Printing. http://www.env.go.jp/policy/hakusyo/h25/pdf/full.pdf.
- Ramírez-Herrera, M. T., and J. A. Navarrete-Pacheco. 2013. “Satellite Data for a Rapid Assessment of Tsunami Inundation Areas after the 2011 Tohoku Tsunami.” Pure and Applied Geophysics 170: 1067–1080. doi:10.1007/s00024-012-0537-x.
- Sakamoto, T., N. Van Nguyen, H. Ohno, N. Ishitsuka, and M. Yokozawa. 2006. “Spatio–Temporal Distribution of Rice Phenology and Cropping Systems in the Mekong Delta with Special Reference to the Seasonal Water Flow of the Mekong and Bassac Rivers.” Remote Sensing of Environment 100: 1–16. doi:10.1016/j.rse.2005.09.007.
- Xu, L., A. Samanta, M. H. Costa, S. Ganguly, R. R. Nemani, and R. B. Myneni. 2011. “Widespread Decline in Greenness of Amazonian Vegetation Due to the 2010 Drought.” Geophysical Research Letters 38: L07402. doi:10.1029/2011GL046824.
- Yasunari, T. J., A. Stohl, R. S. Hayano, J. F. Burkhart, S. Eckhardt, and T. Yasunari. 2011. “Cesium-137 Deposition and Contamination of Japanese Soils Due to the Fukushima Nuclear Accident.” Proceedings of the National Academy of Sciences of the United States of America 108: 19530–19534. doi:10.1073/pnas.1112058108.
- Zhan, X., R. A. Sohlberg, J. R. G. Townshend, C. DiMiceli, M. L. Carroll, J. C. Eastman, M. C. Hansen, and R. S. DeFries. 2002. “Detection of Land Cover Changes Using MODIS 250m Data.” Remote Sensing of Environment 83: 336–350. doi:10.1016/S0034-4257(02)00081-0.