
ABSTRACT
This study validated SNAP-derived LAI from Sentinel-2 and its consistency with existing global LAI products. The validation and inter-comparison experiments were performed on two processing levels, i.e., Top-of-Atmosphere and Bottom-of-Atmosphere reflectances and two spatial resolutions, i.e., 10 m, and 20 m. These were chosen to determine their effect on retrieved LAI accuracy and consistency. The results showed moderate R2, i.e., ~0.6 to ~0.7 between SNAP-derived LAI and in-situ LAI, but with high errors, i.e., RMSE, BIAS, and MAE >2 m2 m–2 with marked differences between processing levels and insignificant differences between spatial resolutions. In contrast, inter-comparison of SNAP-derived LAI with MODIS and Proba-V LAI products revealed moderate to high consistencies, i.e., R2 of ~0.55 and ~0.8 respectively, and RMSE of ~0.5 m2 m–2 and ~0.6 m2 m–2, respectively. The results in this study have implications for future use of SNAP-derived LAI from Sentinel-2 in agricultural landscapes, suggesting its global applicability that is essential for large-scale agricultural monitoring. However, enormous errors in characterizing field-level LAI variability indicate that SNAP-derived LAI is not suitable for precision farming. In fact, from the study, the need for further improvement of LAI retrieval arises, especially to support farm-level agricultural management decisions.
1. Introduction
Globally, improving remotely sensed characterization of biophysical properties of vegetation is of paramount importance for a variety of applications (Davi et al. Citation2009; Zhu et al. Citation2010). In particular, the non-destructive estimation of the Leaf Area Index (LAI) from earth observation data has been topical for decades. LAI is defined as the one-sided green leaf area per unit ground area (Myneni Citation2012), and it is regarded as an essential climate variable (ECV) (GCOS Citation2009). This is mainly due to its significance in characterizing basic information related to vegetation growth and productivity such as foliage density, plant health, and functioning, as well as its significance for modelling water, carbon and energy fluxes between land and atmosphere (Chen et al. Citation2002; Verrelst et al. Citation2015). In agriculture, LAI is essential for, among others, monitoring the variability in crops and rangelands productivity, crop stress and health, biomass, phenology, and yield estimation (Mulla Citation2013; Cho, Ramoelo, and Dziba Citation2017; Novelli et al. Citation2019). Unfortunately, traditional direct LAI (in-situ) measurement methods are spatially and temporally limited, expensive, time-consuming, labour-intensive, and destructive (Alexandridis et al. Citation2013). Therefore, remotely sensed effective LAI (hereafter, LAI) provides a promising alternative for operational agricultural monitoring to support the implementation of global and regional food security mandates such as the United Nations Sustainable Development Goals (UN-SDGs) and Agenda 2063.
The availability of free-of-cost, high resolution space-borne satellite datasets (finer than 30 m) from sensors such as Sentinel-2, advanced open-source tools such as Sentinel Application Platform (SNAP), and the increasingly available analysis-ready data (ARD) offers prospects for accurate, consistent and operational LAI. This should overcome the limitations of coarse spatial resolution (i.e., 300–1000 m) LAI products, such as those derived from Moderate Resolution Imaging Spectroradiometer (MODIS) (Myneni, Knyazikhin, and Park 2015), Advanced Very-High-Resolution Radiometer (AVHRR) (García-Haro et al. Citation2018), Satellite Pour l’Observation de la Terre Vegetation (SPOT-VGT), and Proba-V (Baret et al. Citation2013). Beside better resolution, Sentinel-2’s key advantage over other freely available sensors is its temporal resolution (i.e., ±5 days), which is adequate (if cloud-free) for most agricultural monitoring applications. On the other hand, SNAP Toolbox provides advanced functionalities for any user to perform the atmospheric correction through Sen2Cor tool (Louis et al. Citation2016), and estimate biophysical parameters based on physically-based radiative transfer model, i.e., PROSAIL and robust machine learning algorithm, i.e., Neural Networks (Weiss and Baret Citation2016). However, the validation of SNAP-derived LAI from Sentinel-2 data, as well as its consistency with existing LAI products, were explored by few studies (Bochenek et al. Citation2017; Campos-Taberner et al. Citation2018). This is indispensable since accurate and reliable agricultural monitoring strongly hinges on the consistency and inter-comparability of biophysical parameters such as LAI (Alexandridis, Ovakoglou, and Clevers Citation2019). Furthermore, uncertainties related to the effect of the spatial resolution and processing level of the data on derived biophysical parameters such as LAI need further assessment, especially in Africa, where such studies are rare. Moreover, quantifying uncertainties in remotely sensed products is useful for users and developers interested in the operational use of the product and further development, respectively.
Therefore, the current study sought to validate and inter-compare SNAP-derived LAI from Sentinel-2 Top-Of-Atmosphere (TOA) and Bottom-Of-Atmosphere (BOA) reflectances at two spatial resolutions, i.e., 10 m and 20 m, using in-situ data and global LAI products, i.e., MODIS LAI (MCD15A3 H) with 500 m resolution and Copernicus LAI based on Proba-V data (hereafter, Proba-V LAI) with 300 m resolution. The study was conducted in an African agricultural landscape characterized by large commercial and small-holder farming systems.
2. Study area
The study area is located at latitudes 27°13ʹ0ʺS to 28°8ʹ0ʺS and longitudes 26°0ʹ0ʺE to 27°05ʹ0ʺE, in the vicinity of Bothaville in Free State province, South Africa. The area constitutes the primary agricultural production zone of South Africa and is characterized by warm and wet summers with an average temperature of about 18°C and an annual average rainfall of about 584 mm. On the other hand, winters are cold, with average temperatures of about 5.1°C. Large-scale and small-holder commercial crop cultivation of mainly maize and sunflower occurs on flat, undulating landscapes, with loamy to sandy-loamy soils in summer crop calendar (i.e., from December to May or June) each year.
3. Materials and methods
3.1. Data
3.1.1. Remotely sensed data
Sentinel-2 Multi-Spectral Imager (tile 35JMK) TOA image acquired on the 15th of April 2019 (i.e., Peak of Season) was retrieved from ESA Copernicus Open Access Hub (https://scihub.copernicus.eu/dhus/). The TOA image data was then converted to BOA reflectance, i.e., Level-2A using Sen2Cor version 2.8 (Louis et al.Citation2016). Finally, both TOA and BOA images were then resampled to the two spatial resolutions for Sentinel-2, i.e., 10 m and 20 m using the Sentinel-2 Resampling algorithm available within SNAP Toolbox.
3.1.2. SNAP-derived leaf area index (LAI)
Sentinel-2 TOA and BOA images at two spatial resolutions (10 m and 20 m) were used to derive LAI, using the built-in Biophysical processor, also called Sentinel-2 Land bio-physical processor (SL2P) within SNAP Toolbox. The Biophysical processor uses eight reflectance bands (B3, B4, B5, B6, B7, B8A, B11, and B12), as well as viewing zenith, solar zenith, and relative azimuth angles using radiative transfer models (RTMs), i.e., PROSAIL and Neural Networks algorithm. Further details can be found in Weiss and Baret (Citation2016). SNAP-derived LAI (i.e., 20 m) was rescaled and co-registered to match the spatial resolution of the MODIS LAI product (i.e., 500 m) and of the Proba-V LAI product (i.e., 300 m), using the Nearest Neighbour resampling technique. The resampled SNAP-LAI products (i.e., 500 m and 300 m) were used for comparison to MODIS and Proba-V LAI products.
3.1.3. Global leaf area index (LAI) products
Global LAI products from Proba-V with 300 m spatial resolution (Baret et al. 2013) and MODIS (MCD15A3H.006) with 500 m resolution (Myneni, Knyazikhin, and Park Citation2015) closest to the date of Sentinel-2 acquisition, to ensure comparability, were acquired from Copernicus Global Land Service (http://land.copernicus.eu/global) and Google Earth Engine™ (data provided by NASA LP DAAC, https://lpdaac.usgs.gov/), respectively. Specifically, Proba-V LAI consisted of a temporal composite of 10 days starting from 11th to 20th of April 2019, while MODIS LAI product was a temporal composite of 4 days starting from 11th to 15th of April 2019. The global LAI products were chosen based on their relatively high resolution compared to other existing global products (Camacho et al. Citation2013; Claverie et al. Citation2016) and were used for comparison with SNAP-derived LAI.
3.1.4. In-situ leaf area index (LAI)
In-situ effective leaf area index (LAI) samples were collected in 40 m × 40 m plots along transects randomly selected per field using LICOR 2200 c Plant Canopy Analyser (Li-Cor Citation2012). Within each plot of available LAI measurements, there was one above-canopy and an average of nine (9) below-canopy measurements taken randomly to capture the variability of each crop. These LAI measurements were collected under predominantly clear sky conditions between the 8th and 14th of April 2019 (i.e., Peak of Season). indicates summary statistics for in-situ LAI.
Table 1. Descriptive statistics of measured LAI (m2 m–2) used for validating SNAP-derived LAI.
3.2. Performance metrics
The validation of LAI with in-situ data and comparison with global LAI products was performed using the coefficient of determination (R2), root mean squared error (RMSE), mean absolute error (MAE), and BIAS
4. Results and discussions
4.1. Validation of LAI derived from SNAP
SNAP-derived LAI from Sentinel-2 data at two spatial resolutions and two processing levels, i.e., TOA (L1 C) and BOA (L2A), were validated using in-situ LAI data. The results () show differences between SNAP-derived LAI at various spatial resolutions and processing levels. Specifically, SNAP-derived LAI at 10 m and 20 m spatial resolution showed similar overall agreement with observed (in-situ) LAI, i.e., R2 = 0.69 for L1 C. In comparison, there were marginal differences in overall agreement at 10 m and 20 m, i.e., R2 = 0.67 and 0.68, respectively, for L2A. Nevertheless, the error metrics were mostly similar at both resolutions. Moreover, the results show that LAI derived from TOA reflectances had marginally better agreement with observed LAI, i.e., R2 = 0.69 than that derived from BOA reflectances that achieved R2 ~ 0.68 across all spatial resolutions. Generally, the performance of SNAP-derived LAI, in this study, is better than that found by Pasqualotto et al. (Citation2019), i.e., R2 ~ 0.54, using SNAP-derived LAI from BOA reflectances at 10 m spatial resolution over two agricultural sites in Spain and Italy.
Considering LAI over individual crops, i.e., maize and sunflower, the results show remarkably better agreements with observed LAI over sunflower, i.e., R2 > 0.8 across spatial resolutions and processing levels. In contrast, maize showed moderate R2 values of up to 0.56 and marginal differences between processing levels. As can be expected, the error metrics, i.e., RMSE, MAE, and BIAS, were also the lowest over sunflower, with 10 m and 20 m TOA reflectances achieving equivalent RMSE (i.e., 1.86 m2 m–2), and MAE (i.e., 1.75 m2 m–2). On the other hand, the most significant errors were evident over maize, with RMSE and MAE >2 m2 m–2 across all considered spatial resolutions and processing levels. The magnitude of errors in SNAP-derived LAI from BOA data, found in this study, can be attributed to residual errors of atmospheric correction (AC) using the Sen2Cor procedure. This is because studies have shown that various AC approaches perform differently for different environments, land cover types, and spectral bands (Sola et al. Citation2018; Doxani et al. Citation2018). For example, Sentinel-2 visible bands used in the Biophysical processor are known to be sensitive to Rayleigh and aerosol scattering effects (Martins et al. Citation2017).
In fact, Djamai and Fernandes (Citation2018) show that such uncertainties in BOA data cause proportional uncertainties on derived biophysical parameters. However, this aspect requires further investigation in future studies, for example, by assessing the effect of various AC approaches on retrieval of LAI and other remotely sensed biophysical parameters. Furthermore, an apparent overestimation of LAI values for all crops by SNAP Biophysical processor using both TOA and BOA reflectances is evident in scatter plots () and BIAS. This finding is consistent with Bochenek et al. (Citation2017) that found that SNAP-derived LAI is unreliable due to its overestimation of LAI at varying crop developmental stages. The overestimation of LAI and significant biases observed from SNAP-derived LAI may be due to prior assumptions made from global LAI retrieval algorithms, i.e., Artificial neural networks (ANN) and look-up tables (LUTs) simulated with PROSAIL radiative transfer model (RTM), i.e., PROSPECT+SAIL that may not be calibrated to local conditions. Therefore, as previous studies have demonstrated, models that are calibrated locally may be more robust and increase operational product accuracy (Djamai et al. Citation2019; Jiang et al. Citation2019).
Figure 1. Scatterplots and associated statistical metrics for observed (in-situ) Leaf Area Index (LAI) against predicted LAI from Sentinel-2 at 10 m (a and b) and 20 m (c and d) using Biophysical processor within SNAP Toolbox. Figure 1(a,c) show observed LAI against predicted LAI from TOA data, while ) show observed LAI against predicted LAI from BOA data.
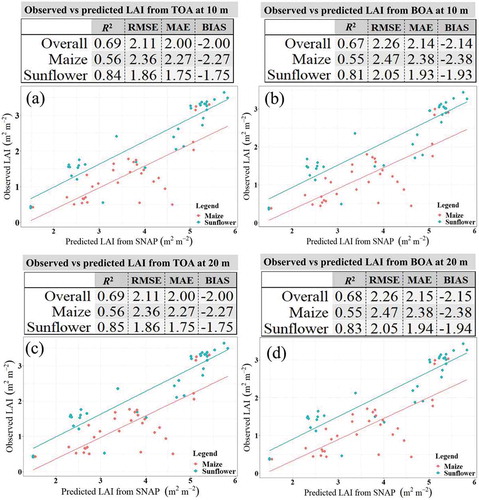
Although not considered in this study, error in in-situ measurements may have a great influence on the validation of satellite-based LAI products and lead to erroneous conclusions. Therefore, future studies should consider this aspect in detail. Overall, the high uncertainties observed in this study necessitate further studies to improve and optimize LAI retrievals, especially for supporting field-level agricultural management decisions, i.e., precision farming.
4.2. Inter-comparison of SNAP LAI with global LAI products
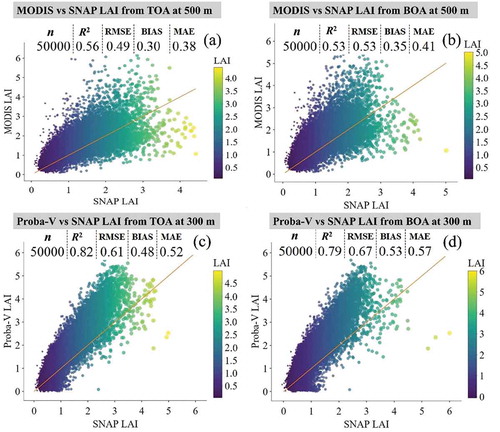
Inter-comparison of SNAP-derived LAI to existing and well-established global LAI products, namely; MODIS LAI (MCD15A3 H) and Proba-V LAI, is essential to determine its consistency and compatibility with such products. Generally, the results () indicate that SNAP-derived LAI from TOA data is more correlated to global LAI products than that from BOA data. As a result, the error metrics, i.e., RMSE, MAE, and BIAS, were also lower in SNAP-derived LAI from TOA than that from BOA data for both MODIS and Proba-V LAI. This may be attributed to errors in the input data, including residual errors of atmospheric correction using Sen2Cor procedure in Sentinel-2 bands since atmospheric correction performance varies by spectral bands (Djamai and Fernandes Citation2018).
Moreover, the difference in algorithmic design and input variables between SNAP-derived LAI and global LAI products may be the reason for moderate R2 for MODIS LAI and relatively higher R2 for Proba-V LAI. For example, MODIS LAI algorithm is biome-specific, uses LUTs generated using 3D RTMs, and input variables include vegetation structural type, sun-sensor geometry, bidirectional reflectance functions (BRFs) at red (648 nm) and near-infrared (NIR, 858 nm) bands, and their uncertainties (Knyazikhin et al. Citation1998). Therefore, misclassification of vegetation type per pixel of interest due to the coarse resolution (Tian et al. Citation2000), might also be a source of error during the comparison with higher resolution Sentinel-2 data. Contrarily, Biophysical processor (i.e., S2LP) is similar to Proba-V LAI algorithm, i.e., both are based on ANN, and more input variables are considered which include the cosine of the: view zenith angle, solar zenith angle, and relative azimuth angle, as well as three Proba-V BOA bands, i.e., blue (470 nm), red (650 nm) and NIR (837 nm). Therefore, SNAP-derived LAI and Proba-V LAI are likely to be similar even though the Biophysical processor incorporates more variables such as visible (except blue band), red-edge (RE), NIR, and shortwave infrared (SWIR) bands and LUTs generated from PROSAIL RTMs. The relatively higher errors in Proba-V may be due to the use of the blue band. In most studies, the blue band is not used because of its high sensitivity to atmospheric contamination, i.e., Rayleigh and aerosol scattering (Martins et al. Citation2017). Furthermore, the higher dimensionality of inputs in the SNAP Biophysical processor may be the reason for higher errors between SNAP-derived LAI and Proba-V LAI (Li et al. Citation2014; Wang et al. Citation2018). Therefore, future studies should focus on the selection of the optimal subset of variables that improves the estimation of LAI.
The agreement between products is also evidenced by separability metrics in , which indicates poor separability (i.e., high similarity) between SNAP-derived LAI and global LAI products. Overall, the results showed that SNAP-derived LAI from TOA data had better consistencies with global LAI products than that from BOA data, owing to relatively higher R2 with global LAI products as well as relatively lower errors, i.e., RMSE, MAE and BIAS.
Table 2. Separability metrics for SNAP LAI distributions with MODIS LAI (MCD15A3 H) and Proba-V LAI products at 500 m and 300 m spatial resolutions, respectively. JM-distance values closer to 2 indicate complete separability between LAI values from SNAP and MODIS/Proba-V LAI, while values < 1 indicate poor separability. M-Statistic < 1 indicates poor separability, while M > 1 indicates good separability.
Despite the relatively coarse resolution, SNAP-derived LAI was more consistent with MODIS LAI than Proba-V LAI, owing to relatively lower errors. This suggests that the aggregation (i.e., down-sampling) of SNAP-derived LAI from 20 m to MODIS and Proba-V spatial resolutions, i.e., 500 m and 300 m, respectively, did not have a significant effect on LAI values. This finding is consistent with Bochenek et al. (Citation2017) that found that aggregation of information to coarser resolution has an insignificant impact on estimated LAI values. Therefore, better consistencies, i.e., lower errors with MODIS LAI, can be attributed to its shorter temporal aggregation, i.e., four days, than Proba-V, which had relatively longer temporal aggregation of 10 days. Overall, downscaling of SNAP-derived LAI to global product resolutions (i.e., 500 m and 300 m) included all the errors and noises existing in the higher resolution product, which may be one of the reasons explaining some of the low-correlating results. Hence, the application of a smoothing technique before applying the downscaling method on high-resolution products might have been beneficial for the accuracy of the relevant results.
Figure 2. Scatterplots of MODIS LAI (MCD15A3 H) against SNAP-derived LAI at 500 m (a and b), and Proba-V LAI against SNAP-derived LAI at 300 m (c and d). Figure 2(a,c), are results for MODIS/Proba-V LAI against SNAP-derived LAI from TOA data, while Figure 2(b,d), are results for comparison with SNAP-derived LAI from BOA data.
5. Conclusions
This study revealed interesting results. First, SNAP-derived LAI correlates moderately well in agricultural landscapes when compared with in-situ LAI data; however, the errors are considerably high for field-level agricultural management. Crop-specific error assessment revealed that SNAP-derived LAI values were overestimated, and accuracy varied by crop type; therefore, future studies should investigate this finding further. Second, the spatial resolution and Sentinel-2 processing levels have an impact on the performance of SNAP-derived LAI; however, the difference in accuracy between different Sentinel-2 resolutions is negligible. The finding is consistent with previous studies (Sprintsin et al. Citation2007; Bochenek et al. Citation2017). On the other hand, marked differences between BOA and TOA derived LAI across resolutions were observed attributable to the residual errors after atmospheric correction procedure in certain bands since atmospheric correction performance varies by different spectral bands of Sentinel-2 (Djamai and Fernandes Citation2018). Therefore, future studies should consider this aspect in more detail, for instance, by quantifying the effect of various atmospheric correction approaches such as Sen2Cor, FORCE, iCor, and MAJA on biophysical parameters retrieval accuracy. Third, SNAP-derived LAI is consistent with global LAI products, however, with marked differences in errors between MODIS LAI (MCD15A3 H) and Proba-V LAI. This indicates its global applicability and potential for operational large-scale agricultural monitoring where within-field variability is not a concern. However, due to poor performance at field-level, SNAP-derived LAI is not suitable for precision agriculture. We hypothesize that a better fit and reduction in errors between SNAP-derived LAI and global LAI products can be achieved if noise-reduction and smoothing techniques were applied on MODIS and Proba-V.
Overall, the poor performance of SNAP-derived LAI when validated against in-situ LAI data, necessitates further improvement to support precision agriculture, while relatively better consistency with global LAI products suggests that it can be applicable and sufficient for large-scale agricultural monitoring. The results have implications for future use of SNAP-derived LAI from Sentinel-2 imagery and ascertain the usefulness of Sentinel-2 data and SNAP Toolbox for supporting regional and national agricultural management decisions and policymaking, towards the achievement of global mandates such as UN-SDGs especially in Africa where such information is limited.
Acknowledgments
We acknowledge ESA/Copernicus for providing data, i.e., freely available from the ESA data hub (https://scihub.copernicus.eu/dhus) and AfriCultuReS project Consortium for providing field data used in this study. We acknowledge the assistance provided by Mr. Johnny Rizos during fieldwork and participating farmers. Last but not least, we acknowledge the voluntary participation of anonymous reviewers in the peer-review process.
Additional information
Funding
References
- Alexandridis, T., D. Stavridou, S. Strati, S. Monachou, and N. Silleos 2013. “LAI Measurement With Hemispherical Photographs At Variable Conditions For Assessment Of Remotely Sensed Estimations.” ESA Living Planet Symposium. Edinburgh, UK: ESA
- Alexandridis, T. K., G. Ovakoglou, and J. G. Clevers. 2019. “Relationship between MODIS EVI and LAI across Time and Space.” Geocarto International 1–15. doi:10.1080/10106049.2019.1573928.
- Baret, F., M. Weiss, R. Lacaze, F. Camacho, H. Makhmara, P. Pacholcyzk, and B. Smets. 2013. “GEOV1: LAI and FAPAR Essential Climate Variables and FCOVER Global Time Series Capitalizing over Existing Products. Part1: Principles of Development and Production.” Remote Sensing of Environment 137: 299–309. doi:10.1016/j.rse.2012.12.027.
- Bochenek, Z., K. Dąbrowska-Zielińska, R. Gurdak, F. NIRO, M. Bartold, and P. Grzybowski. 2017. “Validation of the LAI Biophysical Product Derived from Sentinel-2 and Proba-V Images for Winter Wheat in Western Poland.” Geoinformation Issues 9: 15–26.
- Camacho, F., J. Cernicharo, R. Lacaze, F. Baret, and M. Weiss. 2013. “GEOV1: LAI, FAPAR Essential Climate Variables and FCOVER Global Time Series Capitalizing over Existing Products. Part 2: Validation and Intercomparison with Reference Products.” Remote Sensing of Environment 137: 310–329. doi:10.1016/j.rse.2013.02.030.
- Campos-Taberner, M., F. J. García-Haro, L. Busetto, L. Ranghetti, B. Martínez, M. A. Gilabert, G. Camps-Valls, F. Camacho, and M. Boschetti. 2018. “A Critical Comparison of Remote Sensing Leaf Area Index Estimates over Rice-cultivated Areas: From Sentinel-2 and Landsat-7/8 to MODIS, GEOV1 and EUMETSAT Polar System.” Remote Sensing 10: 763. doi:10.3390/rs10050763.
- Chen, J. M., G. Pavlic, L. Brown, J. Cihlar, S. Leblanc, H. White, R. Hall, D. Peddle, D. King, and J. Trofymow. 2002. “Derivation and Validation of Canada-wide Coarse-resolution Leaf Area Index Maps Using High-resolution Satellite Imagery and Ground Measurements.” Remote Sensing of Environment 80: 165–184. doi:10.1016/S0034-4257(01)00300-5.
- Cho, M. A., A. Ramoelo, and L. Dziba. 2017. “Response of Land Surface Phenology to Variation in Tree Cover during Green-up and Senescence Periods in the Semi-arid Savanna of Southern Africa.” Remote Sensing 9: 689. doi:10.3390/rs9070689.
- Claverie, M., J. Matthews, E. Vermote, and C. Justice. 2016. “A 30+ Year AVHRR LAI and FAPAR Climate Data Record: Algorithm Description and Validation.” Remote Sensing 8: 263. doi:10.3390/rs8030263.
- Davi, H., C. Barbaroux, C. Francois, and E. Dufrêne. 2009. “The Fundamental Role of Reserves and Hydraulic Constraints in Predicting LAI and Carbon Allocation in Forests.” Agricultural and Forest Meteorology 149: 349–361. doi:10.1016/j.agrformet.2008.08.014.
- Djamai, N., and R. Fernandes. 2018. “Comparison of SNAP-derived Sentinel-2A L2A Product to ESA Product over Europe.” Remote Sensing 10: 926. doi:10.3390/rs10060926.
- Djamai, N., R. Fernandes, M. Weiss, H. Mcnairn, and K. Goïta. 2019. “Validation and Comparison of Cropland Leaf Area Index Retrievals from Sentinel-2/MSI Data Using Sl2P Processor and Vegetation Indices Models.” IGARSS 2019-2019 IEEE International Geoscience and Remote Sensing Symposium, 4595–4598. Yokohama, Japan: IEEE.
- Doxani, G., E. Vermote, J.-C. Roger, F. Gascon, S. Adriaensen, D. Frantz, O. Hagolle, A. Hollstein, G. Kirches, and F. LI. 2018. “Atmospheric Correction Inter-comparison Exercise.” Remote Sensing 10: 352. doi:10.3390/rs10020352.
- García-Haro, F. J., M. Campos-Taberner, J. Muñoz-Marí, V. Laparra, F. Camacho, J. Sánchez-Zapero, and G. Camps-Valls. 2018. “Derivation of Global Vegetation Biophysical Parameters from EUMETSAT Polar System.” ISPRS Journal of Photogrammetry and Remote Sensing 139: 57–74. doi:10.1016/j.isprsjprs.2018.03.005.
- GCOS. 2009. “Implementation Plan for the Global Observing System for Climate in Support of the UNFCCC (2010 Update).” Proceedings of the Conference of the Parties (COP), 7–19. Copenhagen, Denmark: Citeseer.
- Jiang, J., M. Weiss, S. Liu, and F. Baret 2019. “The Impact of Canopy Structure Assumption on the Retrieval of GAI and Leaf Chlorophyll Content for Wheat and Maize Crops.” IGARSS 2019-2019 IEEE International Geoscience and Remote Sensing Symposium, 7216–7219. Yokohama, Japan: IEEE.
- Knyazikhin, Y., J. Martonchik, R. B. Myneni, D. Diner, and S. W. Running. 1998. “Synergistic Algorithm for Estimating Vegetation Canopy Leaf Area Index and Fraction of Absorbed Photosynthetically Active Radiation from MODIS and MISR Data.” Journal of Geophysical Research: Atmospheres 103: 32257–32275. doi:10.1029/98JD02462.
- Li, X., Y. Zhang, Y. Bao, J. Luo, X. Jin, X. Xu, X. Song, and G. Yang. 2014. “Exploring the Best Hyperspectral Features for LAI Estimation Using Partial Least Squares Regression.” Remote Sensing 6: 6221–6241. doi:10.3390/rs6076221.
- Li-Cor, I. 2012. LAI-2200 Plant Canopy Analyzer Instruction Manual. Lincoln, NE: LI-COR.
- Louis, J., V. Debaecker, B. Pflug, M. Main-Knorn, J. Bieniarz, U. Mueller-Wilm, E. Cadau, and F. Gascon 2016. “Sentinel-2 Sen2Cor: L2A Processor for Users.” Proceedings Living Planet Symposium 2016, 18. Prague, Czech Republic: Spacebooks Online.
- Martins, V., C. Barbosa, L. De Carvalho, D. Jorge, F. Lobo, and E. Novo. 2017. “Assessment of Atmospheric Correction Methods for Sentinel-2 MSI Images Applied to Amazon Floodplain Lakes.” Remote Sensing 9: 322. doi:10.3390/rs9040322.
- Mulla, D. J. 2013. “Twenty Five Years of Remote Sensing in Precision Agriculture: Key Advances and Remaining Knowledge Gaps.” Biosystems Engineering 114: 358–371. doi:10.1016/j.biosystemseng.2012.08.009.
- Myneni, R. 2012. “MODIS LAI/FPAR Product User’s Guide [Online].” lpdaac.usgs.gov: USGS LP DAAC. https://lpdaac.usgs.gov/sites/default/files/public/modis/docs/MODIS-LAI-FPAR-User-Guide.pdf
- Myneni, R., Y. Knyazikhin, and T. Park 2015. MCD15A3H MODIS/Terra+ Aqua Leaf Area Index/FPAR 4-day L4 Global 500 m SIN Grid V006 [Data Set].
- Novelli, F., H. Spiegel, T. Sandén, and F. Vuolo. 2019. “Assimilation of Sentinel-2 Leaf Area Index Data into a Physically-based Crop Growth Model for Yield Estimation.” Agronomy 9: 255. doi:10.3390/agronomy9050255.
- Pasqualotto, N., J. Delegido, S. Van Wittenberghe, M. Rinaldi, and J. Moreno. 2019. “Multi-Crop Green LAI Estimation with a New Simple Sentinel-2 LAI Index (Seli).” Sensors 19: 904. doi:10.3390/s19040904.
- Sola, I., A. García-Martín, L. Sandonís-Pozo, J. Álvarez-Mozos, F. Pérez-Cabello, M. González-Audícana, and R. M. Llovería. 2018. “Assessment of Atmospheric Correction Methods for Sentinel-2 Images in Mediterranean Landscapes.” International Journal of Applied Earth Observation and Geoinformation 73: 63–76. doi:10.1016/j.jag.2018.05.020.
- Sprintsin, M., A. Karnieli, P. Berliner, E. Rotenberg, D. Yakir, and S. Cohen. 2007. “The Effect of Spatial Resolution on the Accuracy of Leaf Area Index Estimation for a Forest Planted in the Desert Transition Zone.” Remote Sensing of Environment 109: 416–428. doi:10.1016/j.rse.2007.01.020.
- Tian, Y., Y. Zhang, Y. Knyazikhin, R. B. Myneni, J. M. Glassy, G. Dedieu, and S. W. Running. 2000. “Prototyping of MODIS LAI and FPAR Algorithm with LASUR and LANDSAT Data.” IEEE Transactions on Geoscience and Remote Sensing 38: 2387–2401. doi:10.1109/36.868894.
- Verrelst, J., J. P. Rivera, F. Veroustraete, J. Muñoz-marí, J. G. Clevers, G. Camps-valls, and J. Moreno. 2015. “Experimental Sentinel-2 LAI Estimation Using Parametric, Non-parametric and Physical Retrieval methods–A Comparison.” ISPRS Journal of Photogrammetry and Remote Sensing 108: 260–272. doi:10.1016/j.isprsjprs.2015.04.013.
- Wang, L., Q. Chang, J. Yang, X. Zhang, and F. LI. 2018. “Estimation of Paddy Rice Leaf Area Index Using Machine Learning Methods Based on Hyperspectral Data from Multi-year Experiments.” PloS One 13: e0207624. doi:10.1371/journal.pone.0207624.
- Weiss, M., and F. Baret. 2016. S2ToolBox Level 2 Products: LAI, FAPAR, FCOVER. Avignon: Institut National de la Recherche Agronomique (INRA).
- Zhu, Z., C. Yang, M. Cao, and K. Liu. 2010. “Changes of Plant Leaf Area and Its Relationships with Soil Factors in the Process of Grassland Desertification.” Chinese Journal of Ecology 29: 2384–2389.