
 ?Mathematical formulae have been encoded as MathML and are displayed in this HTML version using MathJax in order to improve their display. Uncheck the box to turn MathJax off. This feature requires Javascript. Click on a formula to zoom.
ABSTRACT
This study evaluated the land surface model-simulated soil moisture (SM) product from the China Land Data Assimilation System (CLDAS). This was achieved using three densely instrumented in situ observation networks in China that have different environmental conditions, i.e., the Hebi, Naqu and Heihe sites. The European Space Agency Climate Change Initiative multi-satellite-retrieved SM product (CCI-SM) was also included for inter-comparison purposes. Standard validation scores indicated that the CLDAS-SM product has high correlation and low uncertainty with both surface and root-zone soil moisture observations. The target accuracy (0.04 m3 m−3) was achieved over all three sites. Compared with the CCI-SM product, the CLDAS-SM product showed higher accuracy for the Hebi and Heihe sites but slightly lower accuracy for the Naqu site located at the centre of the Tibetan Plateau. Regionally, the unbiased root mean square difference between the CLDAS-SM and CCI-SM products was noticeably smaller within China than in neighbouring countries. Given that the performance of the CCI-SM product should be unaffected by country boundaries, the better performance of the CLDAS-SM product in China can be attributed primarily to the high-quality meteorological forcing data.
1. Introduction
Soil moisture (SM) is a key variable that modulates energy and water exchanges at the land–atmosphere interface (Dorigo et al. Citation2017). Although SM is measured routinely using in situ networks, such measurements are generally limited in spatial coverage and representativeness (Crow et al. Citation2012). The rapid development of microwave remote sensing and numerical modelling methods has led to the routine availability of satellite-derived or model-simulated SM data at regional/global scales (Karthikeyan et al. Citation2017; Rodell et al. Citation2004). Such data, which have been applied widely in various large-scale modelling and monitoring studies, have demonstrated great potential in many fields, e.g., crop yield prediction (Bolten et al. Citation2010), drought monitoring (Liu, Liu, and Wang Citation2019) and weather prediction (Dharssi et al. Citation2011).
For the optimal use of large-scale SM data, accurate estimation of the error is crucial (Scipal et al. Citation2008). The accuracy of microwave satellite-derived SM is affected primarily by the vegetation optical depth (VOD), radio frequency interference (RFI), topography, snow, soil texture, soil temperature and weather (Al-Yaari et al. Citation2019). The data quality of model-simulated SM generally depends on the accuracy of forcing variables (e.g., precipitation), parameters that describe the land–atmosphere energy/water exchanges, and the model physics (Fang et al. Citation2016). Several studies have investigated satellite-derived and model-simulated SM products using in situ observations from regional or global networks (Albergel et al. Citation2012; Holgate et al. Citation2016). Most of these studies found both types of product satisfactory in capturing the annual cycle and short-term variability of SM; however, the model-simulated SM products tend to show better accuracy and higher consistency with ground observations. Model-simulated SM products have better spatial representativeness than point-based observations, which has led many researchers to argue that they could be used to validate satellite-derived SM products (Albergel et al. Citation2013; Chakravorty et al. Citation2016; Al-Yaari et al. Citation2014).
The objective of this study was to evaluate the recently developed regional China Land Data Assimilation System land surface model-simulated SM (CLDAS-SM) product using three densely instrumented networks in China. To highlight the strengths and weaknesses of the CLDAS in modelling surface SM relative to satellite-derived counterparts, we compared it against the European Space Agency’s Climate Change Initiative (CCI) v04.2 combined product (Dorigo et al. Citation2017), which is widely used and has been rated one of the most accurate satellite products in recent validation studies (Fang et al. Citation2016; Ma et al. Citation2019). To the best of our knowledge, this is the first independent evaluation of the CLDAS-SM product. The results could provide valuable information regarding the use of the CLDAS-SM product as an input for agricultural/hydrological modelling or even as a reference dataset for validating satellite-derived SM products for China.
2. Data
2.1. Observation network
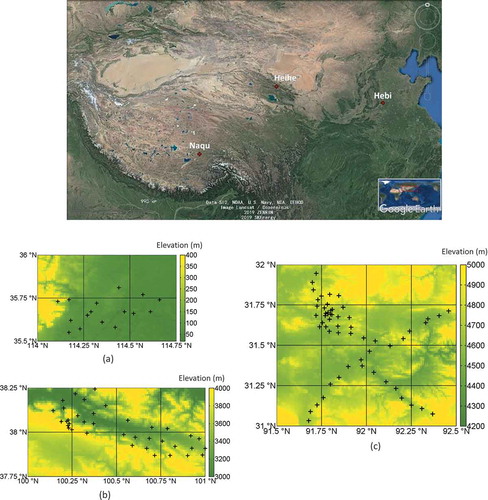
The locations of the Hebi, Naqu and Heihe sites, the layout of the SM sensor network within each site as well as the elevation maps are shown in . Background information on the sensor networks is provided in . The Naqu and Heihe sites, which are both located in western China, are subject to a freeze–thaw cycle. The topography and land cover at the Heihe site are more heterogeneous than that at the Naqu site. The Hebi site is located on the densely populated North China Plain where the climate is warmer and wetter.
Table 1. Background information and sensor networks of each site (VOD is based on LPRM v5 data from AMSR-E C-band data between 2002 and 2011. Topographic complexity is the standard deviation of elevation derived from GTOPO30 data)
Figure 1. Geographic locations of the Hebi, Naqu and Heihe sites, the layout of the soil moisture (SM) sensor network and the elevation map within each site. (a) SM sensor network in the Hebi site; (b) SM sensor network in the Heihe site; (c) SM sensor network in the Naqu site
2.2. CLDAS-SM data
The CLDAS is an operational system developed by the China Meteorological Administration. The product coverage is 0°N–65°N, 60°E–160°E and the spatial resolution is 0.0625°. Observations from more than 30,000 automatic weather stations in China are used to produce high-quality hourly gridded forcing data to drive the CLDAS land surface models. Currently, there are five land surface models in CLDAS: the Community land model 3.5 and the Noah multi-parameterization land surface model with four different parameterization schemes. Simulations of SM with five vertical layers (5 cm, 10 cm, 40 cm, 100 cm, and 200 cm) from these five land surface models are averaged as the final output. A more detailed description can be found in Shi et al. (Citation2011).
3. Methods
In situ observations were quality controlled by screening out data with obvious abnormality. To match the coarse-resolution SM products, we averaged all point observations within one grid cell (0.25°) and discarded grid cells that contained none or only one observation point in the network. Hourly in situ observations and CLDAS-SM data were aggregated to daily mean values. Because frozen and snow-covered soils are masked in the CCI-SM product, only temporally collocated SM data from the surface layer were retained for analysis. With regard to evaluation of the root-zone SM (a depth-weighted average of SM at 5 cm, 10 cm, 20 cm and 40 cm), the CCI-SM product was not included owing to its shallow penetration depth. It should be noted that although each network encompasses more than one grid cell, we compared the averaged SM of multiple grid cells to highlight the differences in product quality among the three networks.
The skill of the coarse-resolution SM products in representing raw values was assessed using four error metrics: the Pearson correlation coefficient (r), bias, root mean square error (RMSE) and unbiased RMSE (ubRMSE) (Entekhabi et al. Citation2010). To understand the performance of the SM products in capturing short-term variations, we calculated the Pearson correlation coefficient between the coarse-scale and observed SM anomalies (). The anomalies were computed using the following formula (Albergel et al. Citation2012):
where is the soil moisture value at day (
).
and
are the mean and standard deviation of the soil moisture over a sliding window (
) of 31 days centred around day (
), respectively.
At regional scale, we assessed the differences between CLDAS-SM and CCI-SM using bias and unbiased root mean square difference (ubRMSD), which represent systematic and random differences, respectively. Please note that the ubRMSD is used as neither product can be considered ground truth.
4. Results
4.1. Evaluation of surface SM
shows the validation scores of the CCI-SM and CLDAS-SM products when compared with upscaled ground surface SM observations. For the Hebi site, CLDAS-SM is generally better than CCI-SM. According to the ubRMSE value, CLDAS-SM achieves the expected accuracy of 0.04 m3 m−3, while CCI-SM exceeds the error limit by 0.002 m3 m−3. Time series comparison shows that low values in the ground observations cannot be captured well by either product, leading to positive bias values ()). The plots of SM observations against CCI-SM show that many points deviate greatly from 1:1 line ()). The Hebi site is located in a developed region with dense meteorological stations. Therefore, the better performance of CLDAS-SM can be attributed to the high quality of the meteorological forcing data, and the lower accuracy of CCI-SM is probably related to the high level of RFI.
Table 2. Validation scores of the CCI-SM and CLDAS-SM products when compared with upscaled in situ surface SM observations (numbers in parentheses indicate sample size)
Figure 2. Comparison of surface soil moisture time series for each site: (a) Hebi, (b) Naqu and (c) Heihe
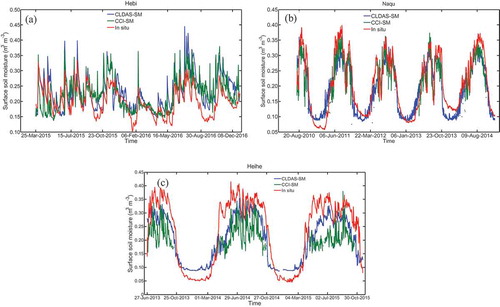
Figure 3. Plots of soil moisture observations against CLDAS-SM and CCI-SM for each site: (a-b) Hebi, (c-d) Naqu and (e-f) Heihe
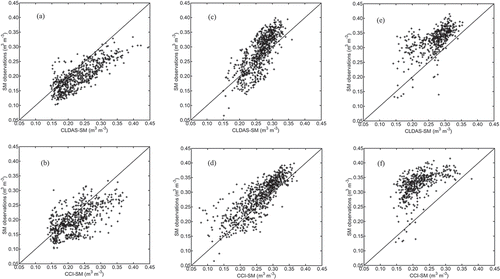
For the Naqu site, both products achieve the target accuracy, although CCI-SM is better than CLDAS-SM in terms of r and ubRMSE. ) shows that both products can capture the dynamics of the observed SM. It should be noted that the intra-annual fluctuation of SM in winter is reasonably large, but that this feature cannot be captured well by land surface modelling presumably because of shortcomings in the model physics regarding frozen soil. The scatterplot ()) shows that CLDAS-SM overestimates low values and underestimates high values, leading to a small bias value but low data variability. By contrast, CCI-SM has similar variability with SM observations ()). The better performance of CCI-SM for the Naqu site could be attributed to two factors. One is that this site is located in remote area which has a low level of RFI. The other is that VOD and topographic complexity in this region are very low (), providing good conditions for SM retrieval from MW satellite.
For the Heihe site, CLDAS-SM is better than CCI-SM in terms of all error metrics. Both products underestimate SM during the warm season ()). Although the CCI-SM underestimation is more severe, it is not that much worse than CLDAS-SM in terms of ubRMSE, indicating that systematic differences account for a large proportion of the RMSE in the CCI-SM product. This feature can also be observed from the scatterplots. ) shows that CCI-SM underestimates SM observations obviously; ) shows that random errors are large when the values of CLDAS-SM are below 0.3 m3 m−3. Validation scores indicate that both SM products are less accurate at the Heihe site than the other two sites, probably because this site is featured with diverse land cover types and large topography complexity.
For all the three sites, ranom is lower than r, indicating that both products are better at capturing seasonal changes rather than short-term variations. also presents the validation scores obtained through comparison of the CLDAS-SM and CCI-SM products. Because the two products are compatible in terms of spatial resolution, almost all the scores are improved, particularly bias and RMSE, which are easily inflated by representativeness errors when coarse-scale SM is compared against point-scale data (Holgate et al. Citation2016).
4.2. Evaluation of root-zone SM
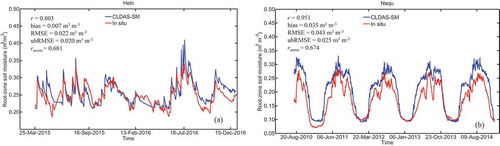
The results obtained through comparison of root-zone SM observations with the modelled equivalents are shown in (there were no root-zone SM observations for the Heihe site). It can be observed that the peaks, valleys and the drying down process are reflected well by the CLDAS-SM, although there is systematic overestimation during summer for the Naqu site. The ubRMSE values for the Hebi and Naqu sites are 0.020 and 0.025 m3 m−3, respectively, i.e., far below the required accuracy, indicating the great potential of CLDAS-SM in agricultural application (e.g., drought monitoring or yield prediction).
Figure 4. Comparison of root-zone soil moisture time series for (a) Hebi and (b) Naqu
4.3. Comparison of CLDAS-SM and CCI-SM products at regional scale
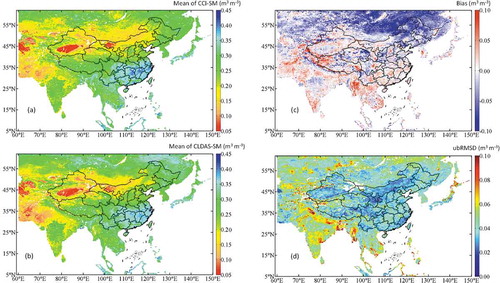
Generally, the CCI-SM product is known to have reasonable quality. Comparison of the CLDAS-SM and CCI-SM products at the regional scale can highlight certain differences in a spatially explicit way that could provide insight into the features of the CLDAS-SM product. It can be seen from that the two products display a similar spatial pattern in terms of annual mean SM. The bias map ()) indicates their differences are small, generally ranging from −0.1 to 0.1 m3 m−3. The ubRMSD map ()) provides the most insightful information. It can be clearly observed that the ubRMSD is noticeably smaller within China than in neighbouring countries. Given that the performance of the CCI-SM product should be unaffected by country boundaries, the better performance of the CLDAS-SM product in China can be attributed primarily to the high-quality meteorological forcing data (no weather station data located outside China are used in CLDAS). This effect is also evident in China. For example, the ubRMSD values in areas with sparse meteorological stations (e.g., northern part of the Tibetan Plateau) are large, indicating potential large uncertainty in the CLDAS-SM product. In areas with dense vegetation (e.g., Northeast China and central-eastern parts of China), the ubRMSD values are also shown reasonably large. Given that the inversion accuracy of microwave SM is usually low in areas with high VOD, this result is probably because the CLDAS-SM in these areas is more accurate.
Figure 5. Regional comparison between the CCI-SM and CLDAS-SM product over 2016–2017: (a) annual mean of CCI-SM, (b) annual mean of CLDAS-SM, (c) bias (CLDAS-SM minus CCI-SM) and (d) ubRMSD
5. Conclusions
This study was the first independent validation of CLDAS-SM using densely instrumented soil moisture networks. According to the ubRMSE metric, CLDAS-SM at the surface and the root-zone level can achieve the target accuracy (0.04 m3 m−3) over the three sites that have different environmental conditions. Comparison with CCI-SM provided additional information on the quality of CLDAS-SM at the surface. It was found that CLDAS-SM outperforms CCI-SM at the Hebi and Heihe sites, whereas it has slightly lower accuracy for the Naqu site, indicating that CCI-SM has advantages in area with sparse meteorological stations. In the near future, the China Meteorological Administration plans to assimilate satellite-derived SM products into CLDAS and operational SM products with improved quality for remote areas are expected.
Acknowledgements
The authors are grateful to the National Tibetan Plateau Data Center (http://data.tpdc.ac.cn) for providing observation data of the Naqu site and the Heihe Plan Science Data Center (http://www.heihedata.org) for providing observation data of the Heihe site.
Additional information
Funding
References
- Albergel, C., W. Dorigo, C. Gruhier, H. Muńoz-Sabater, J. S. Isaksen, L. Kerr, and Y. Wagner. 2012. “Evaluation of Remotely Sensed and Modelled Soil Moisture Products Using Global Ground-based in Situ Observations.” Remote Sensing of Environment 118: 215–226. doi:10.1016/j.rse.2011.11.017.
- Albergel, C., W. Dorigo, R. H. Reichle, G. Balsamo, P. de Rosnay, J. Muoz-sabater, L. Isaksen, R. de Jeu, and W. Wagner. 2013. “Skill and Global Trend Analysis of Soil Moisture from Reanalyses and Microwave Remote Sensing.” Journal of Hydrometeorology 2013: 1259–1276. doi:10.1175/JHM-D-12-0161.1.
- Al-Yaari, A., J.-P. Wigneron, W. Dorigo, A. Colliander, T. Pellarin, S. Hahn, A. Mialon, et al. 2019. “Assessment and Inter-comparison of Recently Developed/reprocessed Microwave Satellite Soil Moisture Products Using ISMN Ground-based Measurements.” Remote Sensing of Environment 224: 289–303. doi:10.1016/j.rse.2019.02.008.
- Al-Yaari, A., J. P. Wigneron, A. Ducharne, Y. H. Kerr, W. Wagner, G. de Lannoy, and A. Mialon. 2014. “Global-scale Comparison of Passive (SMOS) and Active (ASCAT) Satellite Based Microwave Soil Moisture Retrievals with Soil Moisture Simulations (Merraland).” Remote Sensing of Environment 152: 614–626. doi:10.1016/j.rse.2014.07.013.
- Bolten, J. D., W. Crow, X. Zhan, T. J. Jackson, and C. A. Reynolds. 2010. “Evaluating the Utility of Remotely Sensed Soil Moisture Retrievals for Operational Agricultural Drought Monitoring.” IEEE Journal of Selected Topics in Applied Earth Observations and Remote Sensing 3 (1): 57–66. doi:10.1109/JSTARS.2009.2037163.
- Chakravorty, A., B. Chahar, O. Prakash Sharma, and C. T. Dhanya. 2016. “A Regional Scale Performance Evaluation of SMOS and ESA-CCI Soil Moisture Products over India with Simulated Soil Moisture from MERRA-Land.” Remote Sensing of Environment 186: 514–527. doi:10.1016/j.rse.2016.09.011.
- Crow, W. T., A. A. Berg, M. H. Cosh, A. Loew, B. P. Mohanty, R. Panciera, P. de Rosnay, et al. 2012. “Upscaling Sparse Ground-based Soil Moisture Observations for the Validation of Coarse-resolution Satellite Soil Moisture Products.” Reviews of Geophysics 50 (2011RG000372): L19406. DOI:10.1029/2011RG000372.
- Dharssi, I., K. J. Bovis, B. Macpherson, and C. P. Jones. 2011. “Operational Assimilation of ASCAT Surface Soil Wetness at the Met Office.” Hydrology and Earth System Sciences 15 (8): 2729–2746. doi:10.5194/hess-15-2729-2011.
- Dorigo, W., W. Wagner, C. Albergel, F. Albrecht, G. Balsamo, L. Brocca, D. Chung, et al. 2017. “ESA CCI Soil Moisture for Improved Earth System Understanding: State-of-the Art and Future Directions.” Remote Sensing of Environment 203: 185–215. doi:10.1016/j.rse.2017.07.001.
- Entekhabi, D., R. H. Reichle, R. D. Koster, and W. T. Crow. 2010. “Performance Metrics for Soil Moisture Retrieval and Application Requirements.” Journal of Hydrometeorology 11: 832–840. doi:10.1175/2010JHM1223.1.
- Fang, L., C. Hain, X. Zhan, and M. C. Anderson. 2016. “An Inter-comparison of Soil Moisture Data Products from Satellite Remote Sensing and a Land Surface Model.” International Journal of Applied Earth Observation and Geoinformation 48: 37–50. doi:10.1016/j.jag.2015.10.006.
- Holgate, C., R. de Jeu, A. van Dijk, Y. Liu, L. Renzullo, V. Kumar, I. Dharssi, et al. 2016. “Comparison of Remotely Sensed and Modelled Soil Moisture Data Sets across Australia.” Remote Sensing of Environment 186: 479–500. doi:10.1016/j.rse.2016.09.015.
- Kang, J., R. Jin, X. Li, C. Ma, J. Qin, and Y. Zhang. 2017. “High Spatio-temporal Resolution Mapping of Soil Moisture by Integrating Wireless Sensor Network Observations and MODIS Apparent Thermal Inertia in the Babao River Basin, China.” Remote Sensing of Environment 191: 232–245. doi:10.1016/j.rse.2017.01.027.
- Karthikeyan, L., M. Pan, N. Wanders, D. N. Kumar, and E. F. Wood. 2017. “Four Decades of Microwave Satellite Soil Moisture Observations: Part 1. A Review of Retrieval Algorithms.” Advances in Water Resources. doi:10.1016/j.advwatres.2017.09.006.
- Liu, Y., Y. Liu, and W. Wang. 2019. “Inter-comparison of Satellite-retrieved and Global Land Data Assimilation System-simulated Soil Moisture Datasets for Global Drought Analysis.” Remote Sensing of Environment 220: 1–18. doi:10.1016/j.rse.2018.10.026.
- Ma, H., J. Zeng, N. Chen, X. Zhang, M. H. Cosh, and W. Wang. 2019. “Satellite Surface Soil Moisture from SMAP, SMOS, AMSR2 and ESA CCI: A Comprehensive Assessment Using Global Ground-based Observations.” Remote Sensing of Environment 231: 111215. doi:10.1016/j.rse.2019.111215.
- Rodell, M., P. R. Houser, U. Jambor, J. Gottschalck, K. Mitchell, C.-J. Meng, K. Arsenault, et al. 2004. “The Global Land Data Assimilation System.” Bulletin of the American Meteorological Society 85 (3): 381–394. doi:10.1175/BAMS-85-3-381.
- Scipal, K., T. Holmes, R. de Jeu, V. Naeimi, and W. Wagner. 2008. “A Possible Solution for the Problem of Estimating the Error Structure of Global Soil Moisture Data Sets.” Geophysical Research Letters 35 (24): L24403. doi:10.1029/2008GL035599.
- Shi, C., Z. Xie, H. Qian, M. Liang, and X. Yang. 2011. “China Land Soil Moisture EnKF Data Assimilation Based on Satellite Remote Sensing Data.” Science China, Earth Sciences 54 (9): 1430–1440. doi:10.1007/s11430-010-4160-3.
- Yang, K., J. Qin, L. Zhao, Y. Chen, W. Tang, M. Han, Lazhu, Z. Chen, et al. 2013. “A Multiscale Soil Moisture and Freeze–Thaw Monitoring Network on the Third Pole.” Bulletin of the American Meteorological Society 94 (12): 1907–1916. doi:10.1175/BAMS-D-12-00203.1.