
 ?Mathematical formulae have been encoded as MathML and are displayed in this HTML version using MathJax in order to improve their display. Uncheck the box to turn MathJax off. This feature requires Javascript. Click on a formula to zoom.
ABSTRACT
The novel coronavirus infectious disease 2019 (COVID-19) and related lockdown regulations have impacted socio-economic activities, the environment, and human health. Generally, the decision to plant is mostly affected by meteorological conditions, such as rainfall. In contrast, the crop condition depends on management practices such as fertilizer applications and irrigation, in addition to meteorological conditions. However, COVID-19 lockdown regulations restricted the mobility and operation of certain sectors. Consequently, COVID-19 implications on food security are related to trade, transportation and export, farm employment, and incomes. However, its implications on winter cropping are yet unknown. We assessed the effect of COVID-19 on the 2020 winter cropping season, using Sentinel-2 data and Google Earth Engine (GEE) in semi-arid agricultural areas of South Africa. The results indicate lower planted areas at both sites during the COVID-19 year relative to the reference year (2019), i.e., a Decrease Ratio of 0.71 (Bothaville) and 0.30 (Harrismith), respectively. An analysis of winter meteorological conditions showed no significant difference in precipitation between 2020 and 2019, indicating that strict COVID-19 lockdown restrictions, introduced before the start-of-the-season, influenced farmers’ planting decisions.
1. Introduction
The strict lockdown measures introduced in countries across the world as one of the various strategies to mitigate the risk of the novel coronavirus infectious disease 2019 (COVID-19) infection have had adverse impacts on human health and social-economic activities in various countries. The restrictions to movement and industrial activities have led to a reduction in atmospheric emissions in various parts of the world (Baldasano Citation2020; Menut et al. Citation2020; Kganyago and Shikwambana Citation2020). However, the effect on agricultural activities and the performance of various agricultural systems has been limitedly explored. Critically, the performance of agricultural systems is influenced by a range of environmental, meteorological, agricultural inputs (e.g., labour and fertilizers), and management practices. Contrarily, the decision to plant is influenced by market outlooks and meteorological conditions, such as rainfall availability. An assessment of the changes in cropping patterns in response to COVID-19 is critical for understanding its impact on agricultural incomes, jobs, national food security, and progress towards the achievement of Agenda 2063 (A2063) and United Nations Sustainable Development Goals (UN-SDGs).
Earth observation (EO) satellites are particularly useful and a primary means for agricultural assessment and monitoring during COVID-19 lockdown due to their capability to acquire data remotely and repeatedly over large areas at various spatial and temporal resolutions. In particular, their capability to discern and characterize spatio-temporal changes in the landscape at high accuracies is unparalleled, as demonstrated by previous studies (Zhou et al. Citation2018; Massey et al. Citation2017). For example, using a dense time-series of Landsat-8 Operational Land Imager (OLI) coupled with Random Forest (RF) algorithm to map cropland extent in China and Australia, Teluguntla et al. (Citation2018) achieved accuracies of more than 94%. Löw et al. (Citation2013) found accuracies of >85% using a time series of RapidEye images coupled with RF feature selection and support vector machines (SVM) algorithms. Inarguably, as these studies demonstrate, the advent of machine learning algorithms have brought improved mapping accuracies. However, they require site-specific in-situ data for training and validation in different areas. Moreover, although incorporating strategically positioned bands such as red-edge (RE) in Sensors such as RapidEye, Worldview, and Sentinel-2 Multi-Spectral Instrument (MSI) yields better vegetation characterization, literature is flawed with inconsistencies concerning their contribution.
Alternatively, spectral vegetation indices (SVIs) based on the visible-near-infrared (VNIR) regions are popular, simple to implement over vast areas and using various sensors, computationally inexpensive, and require no training data. Moreover, they have been widely used in vegetation analysis, such as for estimating nitrogen (N) content (Ramoelo et al. Citation2015; Battude et al. Citation2016; Bajwa, Mishra, and Norman Citation2010), biomass (Bajwa, Mishra, and Norman Citation2010), yield (Battude et al. Citation2016) and for discriminating crops (Xiong et al. Citation2017). Further, SVIs are related to various biophysical and biochemical properties of vegetation such as leaf pigments (Haboudane et al. Citation2008) and nitrogen (Lee et al. Citation2008), hence essential for non-destructive estimation of agroecological variables such as above-ground biomass (Shen et al. Citation2009), leaf area index (Tillack et al. Citation2014), and changes in vegetation cover (Chen and Gillieson Citation2009). In particular, the normalized difference vegetation index (NDVI) (Rouse Jr Citation1973) offers a rapid assessment of the vegetation vigour and amount. Regardless of its known limitations of saturation, atmospheric interference, and background effects, it remains the most popular and widely used SVI in agricultural applications.
In this context, this study aimed to provide a quick assessment of the impact of COVID-19 lockdown regulations on the winter cropping in Free State province, South Africa. Specifically, we analysed the changes in the winter-planted areas between the reference year (2019) and COVID-19 year (2020) using Sentinel-2 Multi-Spectral Imager (MSI) data and Google Earth Engine (GEE) Cloud Computing Platform (Gorelick et al. Citation2017).
2. Study area
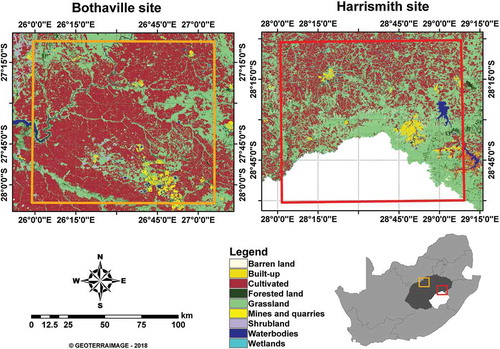
Free State province () is the main agricultural production zone of South Africa, characterized by both commercial medium- to large-scale farming of crops and livestock. Bothaville site, located at latitudes: 27°13ʹ0ʺS to 28°8ʹ0ʺS, and longitudes: 26°0ʹ0ʺE to 27°05ʹ0ʺE, is characterized by warm and wet summers with average temperatures of ~18°C and an annual average rainfall of ~584 mm. Winters are cold, with average temperatures of about 5.1°C (Kganyago et al. Citation2020a). On the other hand, the Harrismith site, located at latitudes: 28°0ʹ0ʺS to 29°0ʹ0ʺS and longitudes: 28°0ʹ0ʺE to 29°8ʹ0ʺE, is characterized by warm and wet summers with an average temperature of 19.2°C and an annual average rainfall of about 115 mm. Winters are mildly cold with average temperatures of 6.9°C and a fair amount of rainfall, i.e., an average of 8 mm, which results in soil moisture sufficient to allow winter wheat cropping (Kganyago et al. Citation2020b).
Figure 1. Location of the study area in free state province (dark grey), South Africa. The two sites, i.e., Bothaville and Harrismith, are highlighted in orange and red, respectively
3. Materials and methods
3.1. Data
3.1.1. Remotely sensed data
Sentinel-2 MSI (Drusch et al., Citation2012) surface reflectance (SR) Collection acquired between May 01 and July 31 covering the study area were analysed in GEE. The MSI images consisted of 12 bands at three different spatial resolutions, i.e., 10 m (band 2-Blue: 490 nm, band 3-Green: 560 nm, band 4-Red: 665 nm, and band 8-NIR1: 842 nm), 20 m (band 5-Red-edge: 705 nm, band 6-Red-edge: 740 nm, band 7-Red-edge: 783 nm, band 8A-NIR2: 865 nm, band 11-SWIR1: 1610 nm, and band 12-SWIR2: 2190 nm) and 60 m (band 1-Deep blue: 443 nm, band 9-NIR3: 945 nm, and band 10-Cirrus: 1375 nm). Moreover, each image comes with quality flags (QA bands). GEE is a Cloud Computing Platform allowing users to interactively analyse and visualize petabytes of Earth observation and other geospatial data without downloading the data, thus eliminating the need for high-end computational resources and the latest software (Gorelick et al. Citation2017; Kumar and Mutanga Citation2018). The period chosen in this study covered the start and peak of the winter growing season (i.e., from May to October or November) and corresponded to level-4 (from May 01 to May 31) and Level-3 lockdown (from June 01 to August 17). These lockdown periods were preceded by a strict lockdown, i.e., level-5 (from March 27 to April 30) (Kganyago and Shikwambana Citation2020). The dominant winter crops are wheat and barley (https://ipad.fas.usda.gov/rssiws/al/crop_calendar/safrica.aspx).
3.1.2. Ancillary data
The Crop Boundaries Dataset was acquired from the South African Department of Agriculture, Land Reform and Rural Development (DALRRD). This dataset consists of boundaries of all the active crop fields (including smallholder and commercial fields) by 2017. The dataset was used to limit the analysis to the known crop fields.
3.2. Data analysis
3.2.1. Mapping winter planted areas
Sentinel-2 MSI collection was subject to the removal of cloud and cloud shadows based on the QA band. Next, each scene was subjected to the computation of the NDVI following EquationEquation 1(1)
(1) ,
where: and
are the Sentinel-2 SR in the near-infrared and red bands, respectively.
Then, multi-temporal NDVI images were temporally composited to determine the greenest pixels or maximum NDVI for the period following EquationEquation 2(2)
(2) . Consequently, further processing was performed on maximum NDVI (i.e., NVDImax) rather than the individual layer.
Where: denote NDVI values for time 1 to time n.
Non-croplands were masked from all the computed NDVI using a crop mask derived from the Crop Boundaries Dataset. The classification of planted areas during the winter growing season was performed using a simple thresholding technique. Specifically, fallow fields, i.e., not planted and bare areas, were classified as those with NDVI values below a threshold of 0.59. In contrast, planted pixels were selected as those above the fallow threshold, i.e., >0.6. The optimal threshold was determined by trial and error and visual interpretation of the MSI false colour images.
Post-processing using the Sieve method with 8 × 8 pixel-window was applied on the classified images to remove ‘salt and pepper’ effects; thus, the minimum mapping unit was approximately 0.5 Ha.
Using the derived planted areas, the cropped arable land fraction (CALF), i.e., the proportion of the planted to the total arable land (Wu et al. Citation2015), was calculated.
3.3. Statistical analysis
3.3.1. Decrease Ratio (DR)
We used Decrease Ratio (DR) (Chen et al. Citation2020) to assess the degree of decrease between winter-planted areas during COVID-19 year (2020) and reference or previous year (2019) (EquationEq. 4(4)
(4) ), respectively.
Where: DRi is the DR for parameter i, and xt2 and xt1 indicate the total planted area at time 2, i.e., 2020 and time 1, i.e., reference or previous year (2019), respectively.
3.3.2. T-test
A t-test was conducted to test the null hypothesis (H0) that there is no significant difference in meteorological conditions (i.e., precipitation and temperature) between COVID-year (2020) and the reference year (2019) at a 95% confidence level (α = 0.05).
4. Results and discussions
4.1. Results
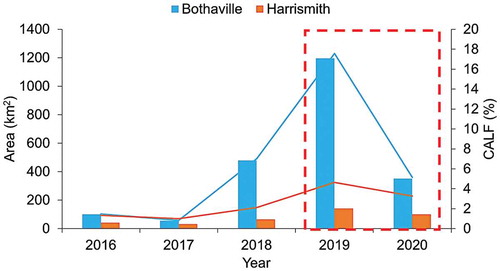
This study conducted a quick assessment of the effect of COVID-19 lockdown on winter cropping using Sentinel-2 data. The results () indicate an apparent decrease in the planted areas and CALF during the winter growing season of 2020 compared to the reference year (2019). Specifically, the planted areas decreased from 1 196 km2 to 351 km2 in Bothaville and from 142 km2 to 100 km2 in Harrismith between reference year (2019) and COVID-19 year (2020), respectively. The decrease in planted areas and CALF was more pronounced in Bothaville than in Harrismith, owing to its vastly planted areas in 2019, i.e., 1 196 km2 (CALF: 17.57%), relative to only 142 km2 (CALF: 4.65%) in Harrismith. Moreover, the total arable land in Bothaville is considerably large, i.e., 6 805 km2, compared to only 3 057 km2 in Harrismith. Accordingly, a higher DR (i.e., 0.71) in Bothaville than in Harrismith, i.e., 0.30, was observed. Consistently, Bothaville seems to exhibit relatively large annual winter-planted areas than Harrismith from 2016 to 2020, possibly attributed to widespread irrigation from the Vaal River and the deeper soils with better water-holding capacities (Barnard and Du Preez Citation2004).
Figure 2. Change in planted areas (km2) and CALF (%) between the reference (2019) and COVID-19 year (2020) (Red box) in Bothaville and Harrismith sites. The data for other years are provided for understanding previous trends
shows the variability in meteorological conditions (i.e., precipitation and rainfall) at the two sites. As can be seen, mean annual precipitation was slightly higher during the COVID-19 year (2020) than the reference year (2019) at both sites, while mean annual temperatures in 2020 were slightly lower than in 2019. Generally, the mean meteorological conditions in 2017 and 2018 were roughly similar to 2019, while 2016 was roughly similar to 2020.
Figure 3. Meteorological conditions (i.e., mean annual precipitation and temperatures) between 2016 and 2020 in Bothaville (a and c) and Harrismith (b and d). The mean is indicated by x, while the median is indicated by a solid line within the box plots. Data sourced from TerraClimate (.Abatzoglou et al. Citation2018) and accessed from Climate Engine (Huntington et al. Citation2017)
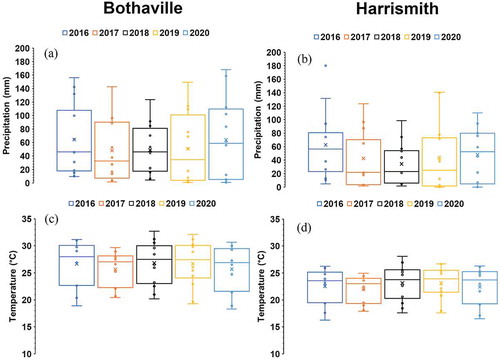
The results () show that the t-test failed to reject the null hypothesis that there is no significant difference in winter precipitation between the COVID-19 year (2020) and reference year (2020) at α = 0.05, i.e., p-value = 0.561 and 0.95 for Bothaville and Harrismith, respectively. In contrast, the t-test rejected the null hypothesis that there is no significant difference in winter temperature between the COVID-19 year (2020) and reference year (2020) at α = 0.05, i.e., p-value = 0.00033 and <0.0001 for Bothaville and Harrismith, respectively.
Table 1. T-test results between meteorological conditions (i.e., precipitation and temperature) of 2019 and 2020
4.2. Discussions
Agricultural statistics such as planted areas are critical information for governments and other interest organizations to formulate policies, monitor markets and food prices, and make import and export decisions to ensure national food security. However, global disease crises such as COVID-19 and associated measures introduced by governments to prevent fatalities and widespread infections create uncertainties in the food supply and demand chains, influence farmers’ decisions to plant and threaten food security. The results imply high uncertainties associated with the lockdown regulations, which restricted the transportation of goods and closure of international trading corridors. The South African Minister of Agriculture, Land Reform and Rural Development announced the COVID-19 Disaster Agricultural Support Fund on 6 April 2020, aimed at distressed small-scale farmers and to avert impacts of COVID-19. Subsequently, at the G20 Agriculture Ministers Meeting on 21 April 2020, the Minister mentioned that the agriculture sector in South Africa continues to operate as per the agricultural calendar, i.e., summer crops harvesting and soil preparation for winter planting (https://www.dalrrd.gov.za/Home/COVID-19-updates). However, as our results show, winter cropping was not expansive compared to 2019 (see ). Therefore, it is anticipated that the strict lockdown restrictions imposed before the 2020 winter cropping season, i.e., level-5, from March 27 to April 30, played a significant role in influencing the decisions to plant, as evidenced by the differences in planted areas between the COVID-19 year (2020) and the reference year (2019), i.e., −845 km2 and −42 km2 for Bothaville and Harrismith, respectively. Moreover, the farmers at these sites, i.e., predominantly medium- to large-scale commercial farmers, were not covered by the announced fund; thus, they found it riskier to commit farm inputs under uncertain policy conditions. This assertion is consistent with Siche (Citation2020), who notes that quarantines and panic resulting from pandemics have devastating impacts on socio-economic activities and food security.
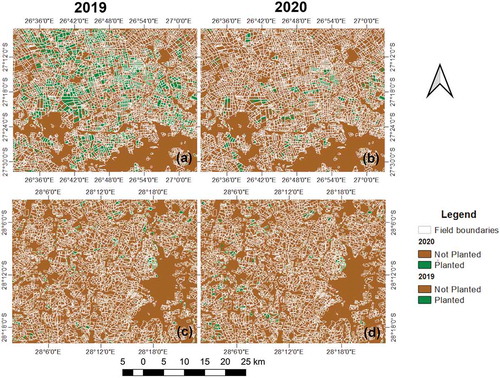
Figure 4. Spatial distribution of winter planted areas in Bothaville (a – b) and Harrismith (c – d) between the reference year (2019) and COVID-19 year (2020)
A similar study (Wang et al. Citation2020) using Sentinel-2 and Moderate Resolution Imaging Spectroradiometer (MODIS) images found no apparent influence of COVID-19 on the crop growth during the period of rapid infections in China, i.e., from late January to mid-March 2020. Their results show better crop growth during COVID-19 year (2020) compared to previous years, thus signalling a strong influence of meteorological conditions. Therefore, other factors that affect the decisions to plant, such as winter precipitation, access to funding, labour and other agricultural inputs, may have also played a role in this study, especially in the preceding years (i.e., 2016–2018) – when COVID-19 was not present and where lower planted areas were observed. However, the factors which explain the relatively low winter planted areas before 2019 were not considered in this study and require further investigation in the future. This study showed that during the 2019 and 2020 winter cropping seasons, the winter precipitation was not significantly different at both sites (). Therefore, it can be deduced that the meteorological conditions (i.e., precipitation and temperature) did not have a considerable effect on winter cropping during the COVID-19 year (2020).
The Crop Boundaries Dataset, used in this study, was outdated, i.e., represented field boundaries in 2017 rather than the current situation. Consequently, it is anticipated that the reported planted areas were underestimated in cases where agricultural expansion has occurred. Moreover, the planted areas threshold was set high (i.e., >0.6) to exclude fallow fields covered with grass and weeds. Although it is unlikely, some late planting and stressed crops may have been omitted by this threshold. Additionally, field data were not available for validating the results. Nevertheless, as a well-established SVI, NDVI based on Sentinel-2 images provided a quick assessment of historical winter planted areas, thus providing essential insights into the consequences of COVID-19 on agriculture and food security. It is anticipated that ongoing projects such as the EU-funded Horizon 2020 project AfriCultuReS (Enhancing Food Security in African Agricultural Systems with the Support of Remote Sensing) – aiming to design, implement and demonstrate integrated agricultural monitoring and early warning decision support system using EO-based products, crowd-sensing, meteorological and climate forecasts (Alexandridis et al. Citation2020) – will aid rapid assessment of the impact of policies on food security in Africa.
5. Conclusion
COVID-19 lockdown, imposed by governments worldwide to contain the spread of the deadly pandemic, impacted various economic sectors, human health and well-being, environment, and agriculture. Although positive environmental effects, due to the restrictions to movement and industrial activities, were observed, impacts on agricultural activities are limitedly studied. We compared the winter planted areas in COVID-19 year (2020) and reference year (2019) to assess the effect of COVD-19 Lockdown on winter cropping in Bothaville and Harrismith sites in South Africa. The results showed a high degree of decline in planted areas, i.e., −845 km2 (DR = 0.7) and −42 km2 (DR = 0.3) for Bothaville and Harrismith, respectively, attributed to the farmer uncertainty and low confidence in the markets due to preceding Level-5 lockdown before the winter planting period, lack of governmental support and lockdown policy uncertainty. However, other factors that influence planting decisions, such as meteorological conditions, financial, and other farming resources, cannot be ruled out. The results showed that precipitation was not significantly different between COVID-19 year (2020) and reference year (2019) at both sites. Overall, Sentinel-2 data allowed a quick assessment of COVID-19 effects on farmers’ decisions to plant, potentially negatively impacting food security, farm employment, and incomes.
Acknowledgments
We acknowledge ESA/Copernicus for providing data, i.e., freely available from the ESA Open Science Hub (https://scihub.copernicus.eu/dhus), the Department of Agriculture, Land Reform and Rural Development (DALRRD) for providing Crop Boundary data, Climate Engine and Google for providing Google Earth Engine (GEE)® platform. Last but not least, we acknowledge the contribution of the editor(s) and anonymous reviewers. This research was conducted as part of the AfriCultuReS project. “This project received funding from the European Union’s Horizon 2020 Research and Innovation Framework Programme under grant agreement No. 774652”.
Additional information
Funding
References
- Abatzoglou, J. T., S. Z. Dobrowski, S. A. Parks, and K. C. Hegewisch. 2018. “TerraClimate, a High-resolution Global Dataset of Monthly Climate and Climatic Water Balance from 1958–2015.” Scientific Data 5 (1): 1–12. doi:https://doi.org/10.1038/sdata.2017.191.
- Alexandridis, T. K., G. Ovakoglou, I. Cherif, M. Gómez Giménez, G. Laneve, D. Kasampalis, D. Moshou, S. Kartsios, M. C. Karypidou, and E. Katragkou. 2020. “Designing AfriCultuReS Services to Support Food Security in Africa.” Transactions in GIS 25(2): 692–720.
- Bajwa, S. G., A. R. Mishra, and R. J. Norman. 2010. “Canopy Reflectance Response to Plant Nitrogen Accumulation in Rice.” Precision Agriculture 11 (5): 488–506. doi:https://doi.org/10.1007/s11119-009-9142-0.
- Baldasano, J. M. 2020. “COVID-19 Lockdown Effects on Air Quality by NO2 in the Cities of Barcelona and Madrid (Spain).” Science of the Total Environment 741: 140353. doi:https://doi.org/10.1016/j.scitotenv.2020.140353.
- Barnard, R. O., and C. C. Du Preez. 2004. “Soil Fertility in South Africa: The Last Twenty Five Years.” South African Journal of Plant and Soil 21 (5): 301–315. doi:https://doi.org/10.1080/02571862.2004.10635066.
- Battude, M., A. A. Bitar, D. Morin, J. Cros, M. Huc, C. M. Sicre, L. D. Valérie, and V. Demarez. 2016. “Estimating Maize Biomass and Yield over Large Areas Using High Spatial and Temporal Resolution Sentinel-2 like Remote Sensing Data.” Remote Sensing of Environment 184: 668–681. doi:https://doi.org/10.1016/j.rse.2016.07.030.
- Chen, Q.-X., C.-L. Huang, Y. Yuan, and H.-P. Tan. 2020. “Influence of COVID-19 Event on Air Quality and Their Association in Mainland China.” Aerosol and Air Quality Research 20: 1541–1551. doi:https://doi.org/10.4209/aaqr.2020.05.0224.
- Chen, Y., and D. Gillieson. 2009. “Evaluation of Landsat TM Vegetation Indices for Estimating Vegetation Cover on Semi-arid Rangelands: A Case Study from Australia.” Canadian Journal of Remote Sensing 35 (5): 435–446. doi:https://doi.org/10.5589/m09-037.
- Drusch, M, U Del Bello, S Carlier, O Colin, V Fernandez, F Gascon, B Hoersch, C Isola, P Laberinti, and P Martimort. 2012. “Sentinel-2: ESA’s optical high-resolution mission for GMES operational services.” Remote Sensing of Environment 120:25–36. https://doi.org/10.1016/j.rse.2011.11.026
- Gorelick, N., M. Hancher, M. Dixon, S. Ilyushchenko, D. Thau, and R. Moore. 2017. “Google Earth Engine: Planetary-scale Geospatial Analysis for Everyone.” Remote Sensing of Environment 202: 18–27. doi:https://doi.org/10.1016/j.rse.2017.06.031.
- Haboudane, D., N. Tremblay, J. R. Miller, and P. Vigneault. 2008. “Remote Estimation of Crop Chlorophyll Content Using Spectral Indices Derived from Hyperspectral Data.” Geoscience and Remote Sensing, IEEE Transactions On 46 (2): 423–437. doi:https://doi.org/10.1109/TGRS.2007.904836.
- Huntington, J. L., K. C. Hegewisch, B. Daudert, C. G. Morton, J. T. Abatzoglou, J. M. Daniel, and T. Erickson. 2017. “Climate Engine: Cloud Computing and Visualization of Climate and Remote Sensing Data for Advanced Natural Resource Monitoring and Process Understanding.” Bulletin of the American Meteorological Society 98 (11): 2397–2410. doi:https://doi.org/10.1175/BAMS-D-15-00324.1.
- Kganyago, M., P. Mhangara, T. Alexandridis, G. Laneve, G. Ovakoglou, and N. Mashiyi. 2020a. “Validation of Sentinel-2 Leaf Area Index (LAI) Product Derived from SNAP Toolbox and Its Comparison with Global LAI Products in an African Semi-arid Agricultural Landscape.” Remote Sensing Letters 11 (10): 883–892. doi:https://doi.org/10.1080/2150704X.2020.1767823.
- Kganyago, M., G. Ovakoglou, P. Mhangara, T. Alexandridis, J. Odindi, C. Adjorlolo, and M. Nosiseko 2020b. “Validation of Atmospheric Correction Approaches for Sentinel-2 under Partly-cloudy Conditions in an African Agricultural Landscape.” Paper presented at the Remote Sensing of Clouds and the Atmosphere XXV, SPIE Remote Sensing, 21-25 September 2020, Online Only, United Kingdom.
- Kganyago, M., and L. Shikwambana. 2020. “Did COVID-19 Lockdown Restrictions Have an Impact on Biomass Burning Emissions in Sub-Saharan Africa?” Aerosol and Air Quality Research 20 21(4), 200470.
- Kumar, L., and O. Mutanga. 2018. “Google Earth Engine Applications since Inception: Usage, Trends, and Potential.” Remote Sensing 10 (10): 1509. doi:https://doi.org/10.3390/rs10101509.
- Lee, Y.-J., C.-M. Yang, K.-W. Chang, and Y. Shen. 2008. “A Simple Spectral Index Using Reflectance of 735 Nm to Assess Nitrogen Status of Rice Canopy.” Agronomy Journal 100 (1): 205–212. doi:https://doi.org/10.2134/agronj2007.0018.
- Löw, F., U. Michel, S. Dech, and C. Conrad. 2013. “Impact of Feature Selection on the Accuracy and Spatial Uncertainty of Per-field Crop Classification Using Support Vector Machines.” ISPRS Journal of Photogrammetry and Remote Sensing 85: 102–119. doi:https://doi.org/10.1016/j.isprsjprs.2013.08.007.
- Massey, R., T. T. Sankey, R. G. Congalton, K. Yadav, P. S. Thenkabail, M. Ozdogan, and A. J. S. Meador. 2017. “MODIS Phenology-derived, Multi-year Distribution of Conterminous US Crop Types.” Remote Sensing of Environment 198: 490–503. doi:https://doi.org/10.1016/j.rse.2017.06.033.
- Menut, L., B. Bessagnet, G. Siour, S. Mailler, R. Pennel, and A. Cholakian. 2020. “Impact of Lockdown Measures to Combat Covid-19 on Air Quality over Western Europe.” Science of the Total Environment 741: 140426. doi:https://doi.org/10.1016/j.scitotenv.2020.140426.
- Ramoelo, A., M. A. Cho, R. Mathieu, S. Madonsela, V. D. K. Ruben, Z. Kaszta, and E. Wolff. 2015. “Monitoring Grass Nutrients and Biomass as Indicators of Rangeland Quality and Quantity Using Random Forest Modelling and WorldView-2 Data.” International Journal of Applied Earth Observation and Geoinformation 43: 43–54. doi:https://doi.org/10.1016/j.jag.2014.12.010.
- Rouse Jr, J. W. 1973. Monitoring the Vernal Advancement and Retrogradation (Green Wave Effect) of Natural Vegetation,Texas A & M University, Remote Sensing Center, NASA Earth Resources Survey Program, Washington, D.C.
- Shen, M., J. Chen, X. Zhu, and Y. Tang. 2009. “Yellow Flowers Can Decrease NDVI and EVI Values: Evidence from a Field Experiment in an Alpine Meadow.” Canadian Journal of Remote Sensing 35 (2): 99–106. doi:https://doi.org/10.5589/m09-003.
- Siche, R. 2020. “What Is the Impact of COVID-19 Disease on Agriculture?” Scientia Agropecuaria 11 (1): 3–6. doi:https://doi.org/10.17268/sci.agropecu.2020.01.00.
- Teluguntla, P., P. S. Thenkabail, A. Oliphant, J. Xiong, M. K. Gumma, R. G. Congalton, K. Yadav, and A. Huete. 2018. “A 30-m Landsat-derived Cropland Extent Product of Australia and China Using Random Forest Machine Learning Algorithm on Google Earth Engine Cloud Computing Platform.” ISPRS Journal of Photogrammetry and Remote Sensing 144: 325–340. doi:https://doi.org/10.1016/j.isprsjprs.2018.07.017.
- Tillack, A., A. Clasen, B. Kleinschmit, and F. Michael. 2014. “Estimation of the Seasonal Leaf Area Index in an Alluvial Forest Using High-resolution Satellite-based Vegetation Indices.” Remote Sensing of Environment 141: 52–63. doi:https://doi.org/10.1016/j.rse.2013.10.018.
- Wang, Y., D. Peng, L. Y. Yaqiong, J. Y. Zhang, L. Zhou, S. Zheng, F. Wang, and L. Cunjun. 2020. “Monitoring Crop Growth during the Period of the Rapid Spread of COVID-19 in China by Remote Sensing.” IEEE Journal of Selected Topics in Applied Earth Observations and Remote Sensing 13: 6195–6205. doi:https://doi.org/10.1109/JSTARS.2020.3029434.
- Wu, B., R. Gommes, M. Zhang, H. Zeng, N. Yan, W. Zou, Y. Zheng, N. Zhang, S. Chang, and Q. Xing. 2015. “Global Crop Monitoring: A Satellite-based Hierarchical Approach.” Remote Sensing 7 (4): 3907–3933. doi:https://doi.org/10.3390/rs70403907.
- Xiong, J., P. Thenkabail, J. Tilton, M. Gumma, P. Teluguntla, A. Oliphant, R. Congalton, K. Yadav, and N. Gorelick. 2017. “Nominal 30-m Cropland Extent Map of Continental Africa by Integrating Pixel-based and Object-based Algorithms Using Sentinel-2 and Landsat-8 Data on Google Earth Engine.” Remote Sensing 9 (10): 1065. doi:https://doi.org/10.3390/rs9101065.
- Zhou, J., L. R. Khot, R. A. Boydston, P. N. Miklas, and L. Porter. 2018. “Low Altitude Remote Sensing Technologies for Crop Stress Monitoring: A Case Study on Spatial and Temporal Monitoring of Irrigated Pinto Bean.” Precision Agriculture 19 (3): 555–569. doi:https://doi.org/10.1007/s11119-017-9539-0.