
 ?Mathematical formulae have been encoded as MathML and are displayed in this HTML version using MathJax in order to improve their display. Uncheck the box to turn MathJax off. This feature requires Javascript. Click on a formula to zoom.
ABSTRACT
A change detection analysis utilizing Very High-resolution (V.H.R.) satellite imagery was performed to evaluate the changes in coastal vegetation in La Parguera, southwestern Puerto Rico, attributable to the increased influx of pelagic Sargassum and its accumulations in cays, bays, inlets and near-shore environments. Imagery was co-registered, corrected for atmospheric effects and masked for water and land. A Normalized Difference Vegetation Index (N.D.V.I.) was used to evaluate the changes in coastal vegetation. N.D.V.I. was used to calculate the differences from 2010 baseline imagery to potential hurricane plus Sargassum impacts (2018 image) and potential Sargassum impacts (2020 image). Results show a total decrease in N.D.V.I. from 2010 to 2020 of 28%, or 3,687,493 m2, and these changes were also observed in true colour images. Total decrease in values in N.D.V.I. was higher from 2018 to 2020, especially for the Isla Cueva site (233,807 m2), and were consistent with the field observations and drone surveys conducted since 2018 in the area. Areas prone to Sargassum accumulation were also identified. This approach provides a quantifiable method to evaluate Sargassum impacts to the coastal vegetation and benthic composition using change detection of V.H.R. images and to separate these effects from other extreme events.
1. Introduction
The floating brown algae Sargassum sp. provide an essential marine habitat in the open ocean. However, since 2011, there has been a dramatic increase in Sargassum biomass in the tropical Atlantic Ocean and Caribbean Sea and consequently, massive accumulations of Sargassum have been reported along the Eastern and Western Caribbean and Florida coasts (Gower and King Citation2019; Wang et al. Citation2019). From mid-2014 until the end of 2015, the Mexican and Caribbean coasts experienced a massive influx of drifting Sargassum that accumulated on the shores (van Tussenbroek et al. Citation2017). This build-up of decaying beach-cast material and nearshore accumulations produced murky brown waters that were called Sargassum-brown-tides (S.b.t.) with persistent reduction in light, oxygen (hypoxia or anoxia) and decreased pH, in addition to the water quality impacts (van Tussenbroek et al. Citation2017; Rodríguez-Martínez et al. Citation2020). Remote sensing and the use of N.D.V.I. have been employed by many researchers to map changes in the coastal vegetation coverage, especially after extreme events (Hu and Smith Citation2018; Van Beusekom et al. Citation2018; Rodgers, Murrah, and Cooke Citation2009). Initial observations in the La Parguera area (SW Puerto Rico) suggest that Sargassum influx and accumulations have increased since 2011, with a significant increase in the peak years of Sargassum influx to the Caribbean (Wang et al. Citation2019). Additionally, original benthic cover and composition, as well as coastal vegetation, may have been displaced and/or significantly impacted by persistent Sargassum accumulations in near-shore areas. The purpose of this study was to evaluate the changes in coastal vegetation in La Parguera area due to Sargassum influx and accumulations in cays, bays, inlets and near-shore environments.
2. Study area
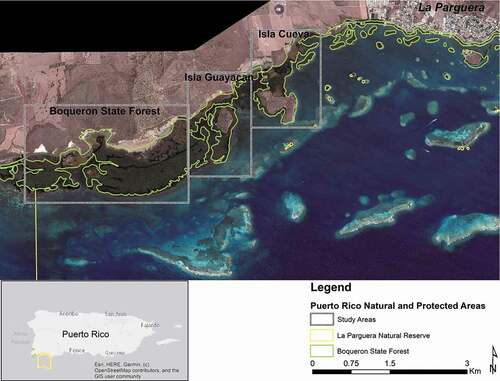
The study area in La Parguera was selected due to the observed increased frequency of events resulting in the accumulation of Sargassum at some of the coral reefs and mangrove-fringed coasts. The constraints to hydrodynamic activity, provided by reefs and mangrove keys in the study area, coupled to the prevalence of south-easterly winds makes the study area particularly vulnerable to Sargassum accumulation. The benthic and coastal vegetation study areas include the Boquerón State Forest and La Parguera Natural Reserve, managed by the Puerto Rico Department of Natural and Environmental Resources (D.N.E.R.). The area of La Parguera is recognized for the exceptional value of its marine resources, which includes extensive coral reef ecosystems, seagrass beds, coastal mangrove fringe and mangrove islands, and two bioluminescent bays (Morelock, Schneidermann, and Bryant Citation1977). The study areas were further subdivided into the Isla Cueva (I.C.), Isla Guayacán (I.G.) and Boquerón State Forest (B.F.) areas ().
Figure 1. Map showing the study areas for La Parguera. The boundaries of La Parguera Natural Reserve and the Boquerón State Forest are displayed
3. Materials and methods
3.1. Satellite imagery
V.H.R. satellite imagery was obtained from 2010 and 2020 to evaluate the study area before the increase of Sargassum influx and accumulation that started in 2011 and to evaluate the current effects of Sargassum accumulation on coastal vegetation respectively.
On 20 September 2017, Puerto Rico was severely impacted by Hurricane Maria, a category 4 hurricane (250 kmh; 155 mph) that crossed the island from southeast to the northwest and produced heavy rainfall that caused record or near-record floods at many locations and impacts to the vegetation (Hu and Smith Citation2018; Pasch, Penny, and Berg Citation2018). To minimize the potential effects of the 2017 hurricane season on the analysis, an additional V.H.R. image (early 2018) was also acquired. The satellite imagery selection was based on the availability of cloud-free data, timeline of the observation (e.g., after Sargassum season, after hurricane impacts) and spatial/spectral resolution of the sensors. The imagery selected and their attributes are described in .
Table 1. V.H.R. Imagery Specifications. PC (Panchromatic), MS (Multi-spectral)
Imagery was pre-processed and ancillary data such as LiDAR data (bathymetry), drone photo survey and field observations were used to improve the pre-processing and quantification of changes. Drone surveys were collected during various dates in 2018–2020 using a DJI Mavic 2 Pro and the images were collected between 0900 and 1100 local time (A.S.T.) to minimize sunglint, high wind and cloud shadows over the area. The LiDAR data were obtained from 2006 N.O.A.A. Bathymetric Lidar: Puerto Rico Southwest (https://catalogue.data.gov/da_DK/dataset/2006-noaa-bathymetric-lidar-puerto-rico-southwest) and were used as reference to evaluate the extent of very shallow areas near the mangroves. These drone surveys provided an additional assessment tool to evaluate and quantify potential changes in the Sargassum accumulation and coastal vegetation.
3.2. Pre-processing
The images were corrected for radiometric and atmospheric effects and were also pan-sharpened to improve the spatial resolution of the multispectral bands. The Pleiades-1 and Geoeye-1 images were acquired, and radiometrically and atmospherically corrected using Dark Object Subtraction atmospheric correction (Chavez Citation1988) in ENVI 5.3 image processing software. A Gram-Schmidt pan-sharpening (Gulcan Citation2014; Laben, Bernard, and Brower Citation2000) was applied to the imagery by including the panchromatic band with ground control points to obtain a multi-spectral image at 0.55 m spatial resolution. This technique improves the spatial resolution of the images, especially in near-shore areas while minimizing the loss of spectral and spatial information (Gulcan Citation2014). The Geoeye-1 imagery was acquired from National Oceanographic and Atmospheric Administration (N.O.A.A.), National Centers for Coastal Ocean Science (NCCOS) as part of the project: Benthic Habitat Mapping off Southwest Puerto Rico (https://coastalscience.noaa.gov/project/benthic-habitat-mapping-off-southwest-puerto-rico/, Bauer et al. Citation2012). Although imagery was collected from different sensors due to limited availability, these pre-processing steps allow a standardization of the images so the changes detected can be attributed to changes in the landscape. The processed GeoEye-1 image was used as the base image for georeferencing. The base image orthorectification was performed using ENVI’s Orthorectify GeoEye-1 with Ground Control module. A water mask was developed and applied using a threshold from the NIR bands for both Pleiades-1 and Geoeye-1 imagery to include the pixels containing water. The thresholds for each image were carefully evaluated to include very shallow areas near coastal areas. LiDAR bathymetry was used to evaluate these very shallow areas near coast to improve the water mask.
3.3. Change detection for vegetation
For the coastal vegetation, changes in the N.D.V.I. index were used to quantify these changes. The N.D.V.I. was used here to assess the state of live green vegetation, and it also indicates a level of photosynthetic activity (Rouse et al. Citation1974). The N.D.V.I. is calculated as follows:
where RED. and N.I.R. are the sensor’s reflectance value in the red (visible) and near-infrared (N.I.R.) regions, respectively. In general, the range of N.D.V.I. values is between −1.0 and +1.0, where negative values can represent water. A water mask was applied to the reduce the effects of water on the N.D.V.I. index.
Once the vegetation index was processed, a change detection technique was used to evaluate the differences in N.D.V.I. from baseline images using map algebra to evaluate possible changes (Hu and Smith Citation2018). The 2010 images were used as a baseline and the 2018 and 2020 images represented the imagery with changes. Since we were interested in potential impacts (negative values), only values that changed to negative from the baseline were used. The image products were re-classified to obtain only the negative change N.D.V.I. pixel values, N.D.V.I. positive and no change values were masked. In our case, a negative N.D.V.I. value represented a potential negative impact to vegetation for that timespan. Change detection images were produced for 2010–2018 and 2018–2020. An additional difference image was produced between 2010 and 2020 images to evaluate the total N.D.V.I. changes between these dates. These change images only included negative N.D.V.I. values present from each selected timespan (2018–2020); so negative values from the previous timespan (2010–2018) were not included. Negative changes can represent a decrease in N.D.V.I. pixel values due to loss of vegetation (e.g., canopy structure) or decrease of vegetation coverage (e.g., change from covered areas to barren or open water areas) (Morawitz et al. Citation2006). A total pixel count and area (in m2) was calculated for each difference imagery and for each study area.
4. Results and discussion
4.1. Imagery changes in coastal vegetation
The processed images were evaluated for change detection using N.D.V.I. products. The overlap of the 2017 hurricanes and potential Sargassum accumulation before 2018 proved difficult to differentiate using change detection alone. Also, lack of availability of a V.H.R. cloud free image with the correct timeline (before hurricanes, early 2017) was also a limitation. Although there are local accounts of Sargassum accumulation before the 2018 season (2013, 2015), none of these compare with 2018, 2019 events in the area in terms of Sargassum influx and accumulation (Wang et al. Citation2019). To simplify the analysis, the images were categorized as: 1) N.D.V.I. negative impacts from 2010 to 2018 (Hurricanes + Sargassum) and 2) N.D.V.I. negative impacts from 2018–2020 (Sargassum). The N.D.V.I. images from all timespans and total pixel area values were summarized for each study area ().
Figure 2. Classified N.D.V.I. imagery products for negative changes for 2010–2020 Hurricane + Sargassum (a), 2018–2020 for Sargassum (b), and total change from 2010 to 2020 (c) for each study area. Red colour indicates negative pixel values. The graph (d) is a summary of the proportion of area with negative change in N.D.V.I. per time-period in percent
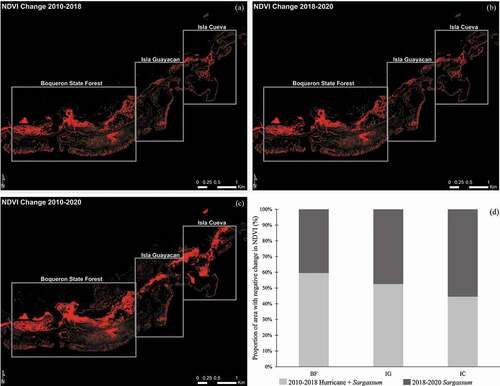
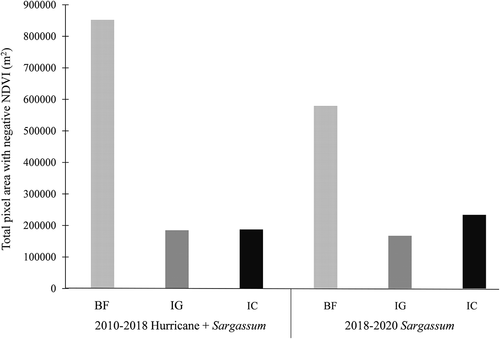
Figure 3. Total pixel areas (m2) with negative changes in N.D.V.I. for each study area in 2010–2018 and 2010–2020
Evaluating the imagery N.D.V.I. imagery products we found that during 2010–2018, the maximum N.D.V.I. change to the vegetation was found at Boquerón State Forest (B.F.), while for Isla Cueva (I.C.), the maximum N.D.V.I. change was observed for the 2018–2020 time period (). However, Isla Guayacán (I.G.) N.D.V.I. changes were not as pronounced for both time periods.
4.2. Area changes in coastal vegetation
Results show a dramatic reduction in vegetation total pixel area, especially for the B.F. site from 2010 to 2020 (852,048 m2), but these were lower for 2018–2020 (579,176 m2), suggesting a recovery from the negative impacts (). I.G. and I.C. sites presented very similar reductions in vegetation total area for 2010–2018 (184,706 m2 and 187,449 m2, respectively). For 2018–2020, I.G. shows a lower reduction in the total area (167,193 m2) when compared to the 2010–2018 timespan. For 2018–2020, I.C. shows reduction in vegetation total pixel area (233,807 m2) for this timespan. This suggests a potential impact at I.C. corresponding to this N.D.V.I. total reduction in area and aligns with the observed Sargassum accumulations from boat and drone surveys at I.C. These changes at the I.C. site can also be observed in the N.D.V.I. images from 2018 to 2020 and 2010 to 2020 ().
Summarizing overall changes, from 2010 to 2020, the study areas presented a negative change in the N.D.V.I. pixel values of 28% of the total pixels. Evaluating the time periods, 17% of these changes occurred for 2010–2018, while 11% of these occurred from 2018 to 2020. While an initial assessment of the results suggests a recovering trend, that is not the case since it took 8 years to accumulate 17% (2010–2018) of the potential impacts, but only 2 years to account for 11% (2018–2020) of new potential impacts, suggesting an accelerated impact.
4.3. Field observations of coastal vegetation changes
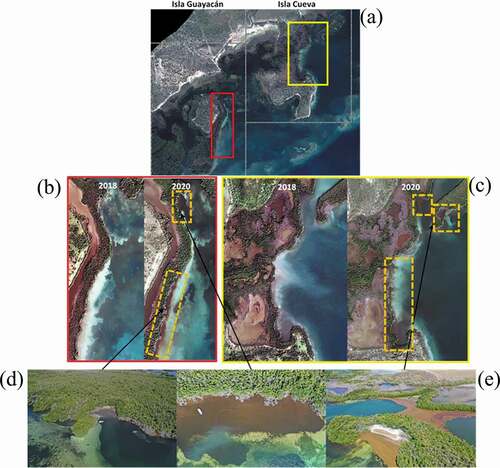
The changes in coastal vegetation identified through the N.D.V.I. imagery analysis are consistent with the field observations and drone surveys conducted since 2018, especially in the I.C. and I.G. sites () that show a decrease in the standing mangrove, canopy cover extent and accumulated Sargassum. The 2018 Sargassum season showed the highest biomass of Sargassum in the Caribbean and Intra-America Seas (Wang et al. Citation2019), with high accumulation occurring in the southwest coast of Puerto Rico. Floating Sargassum mats are driven by southeast winds an accumulate and persist for extended periods of time, especially in Isla Cueva and Isla Guayacán due to their geographic orientation. Also, these observations found that a substantial influx of Sargassum can extend deep inside the fringing mangrove forest during high tide that persists and decomposes there, which can lead to anoxic conditions with potential changes to the biochemistry and hydrodynamics of the mangrove root system (van Tussenbroek et al. Citation2017).
Figure 4. Enhanced areas from satellite imagery (a) showing changes in accumulated Sargassum for both 2018 and 2020 from Isla Guayacán in red box (b) and Isla Cueva in yellow box (c). Dark brown areas within dashed-orange boxes are accumulated Sargassum. Drone images from September 2019 from Isla Guayacán (d) and Isla Cueva (e) location on satellite imagery showing the accumulations of Sargassum.
4.4. Additional effects on the coastal vegetation
Hurricane winds could also have impacted the N.D.V.I. values, since the percentage of negative values was higher than the baseline (2010), especially for the Boquerón Forest site. Hu and Smith (Citation2018) evaluated the N.D.V.I. values for terrestrial vegetation in Puerto Rico after Hurricane Maria (September 2017) and showed that N.D.V.I. values recovered to pre-hurricane levels around 1.5 months (November 2017) after the hurricane impacts and that the vegetation farthest from the storm centre and with lower elevation were the least affected (Cartier Citation2019). Also, mangrove forest canopy cover recovered to 60% of the pre-hurricane conditions between 3 and 6 months post Hurricane Irma in Florida (Radabaugh et al. Citation2019). In addition, the images used for our N.D.V.I. analysis were from January 2018 and January 2020, and our methods ensured that negative N.D.V.I. values from 2018 were not present in the 2020 imagery. This approach improved our change detection because by 2020 canopy cover should have returned to pre-hurricane levels and the images included mainly potential Sargassum impacts.
Several limitations can be found when using N.D.V.I. for change detection analysis that include atmospheric effects, new leaf growth in crops and seasonality (Xue and Su Citation2017). Tidal differences between the images at the time of image capture and image pre-processing steps (e.g., pan-sharpening, orthorectification) can affect the N.D.V.I. estimates. However, these limitations were minimized in the image pre-processing steps by including ancillary data such LiDAR bathymetry and developing image-specific water masks. In addition, the 2018 and 2020 images were selected from the same period (January) to remove any differences in seasonality that might affect the ‘greenness values’ that are obtained from the N.D.V.I.
Major changes to the coastal vegetation ecosystems of La Parguera area were observed which could also have negative repercussions to other highly productive and biodiverse marine resources, such as seagrass beds and coral reefs (United Nations Educational, Scientific and Cultural Organization (UNESCO) Citation1998). Hurricane impacts to coastal vegetation and benthic ecosystems have been documented (Radabaugh et al. Citation2019; Hu and Smith Citation2018), but these can still be considered episodic events providing time for the ecosystem to recover. However, the cumulative and chronic impacts of Sargassum (van Tussenbroek et al. Citation2017; Rodríguez-Martínez et al. Citation2020) may not provide a recovery time to these coastal ecosystems, especially if the system has been severely impacted by a hurricane or storm. The changes to the coastal vegetation and benthic composition we observed in our study occurred in a short time frame but considering that both Sargassum (Wang et al. Citation2019) and extreme weather events such as storms and hurricanes (Keellings and Hernández Ayala Citation2019) will continue and potentially increase, natural resource managers need to consider the combination of these scenarios and its potential long-term impacts to the ecosystems.
5. Conclusions
Significant changes in coastal vegetation from 2010 to 2020 were quantified in the study sites in La Parguera area using the N.D.V.I., and it was possible to differentiate between the hurricane and Sargassum impacts. Further studies should focus on how these accumulations may have a detrimental effect in the biochemistry and hydrodynamics of the mangrove root system, which may result in loss of mangrove forest habitat. Although we quantified that the observed percent increase in the N.D.V.I. negative values could be due to Sargassum, other factors like hydrological changes to the mangrove forests may have also contributed to these changes. Debris accumulations, sediments redistribution or wind damage to canopy structure can have a cumulative effect, which cannot be resolved with the temporal scales used in this study. Drone surveys using multi-spectral cameras combined with optical field surveys may provide a more detailed information and the high-resolution and temporal scale needed. This approach provides a quantifiable method to evaluate Sargassum impacts to the coastal vegetation and benthic composition using change detection of V.H.R. images, and to separate these effects from other extreme events.
Acknowledgments
The authors would like to thank Mariana León-Pérez for providing valuable insight and recommendations to the manuscript.
Data availability statement
Data does not reside on the web, person interested in the data, can contact me via email provided.
Disclosure statement
No potential conflict of interest was reported by the author(s).
Additional information
Funding
References
- Bauer, L. J., K. Edwards, K. K. W. Roberson, M. S. Kendall, S. Tormey, and T. A. Battista. 2012. “Shallow- Water Benthic Habitats of Southwest Puerto Rico.” In NOAA Technical Memorandum NOAA NOS NCCOS 155. Silver Spring, MD. 39 pp.
- Cartier, K. M. S. 2019. “Hurricanes Hit Puerto Rico’s Mangroves Harder than Florida’s.” EOS 100. Published on 12 December 2019. doi:https://doi.org/10.1029/2019EO137889.
- Chavez, P. S., Jr. 1988. “An Improved Dark-object Subtraction Technique for Atmospheric Scattering Correction of Multispectral Data.” Remote Sensing of Environment 24: 459–479. doi:https://doi.org/10.1016/0034-4257(88)90019-3.
- Gower, J., and S. King. July 5 2019. “Seaweed, Seaweed Everywhere.” Science 365 (6448): 27. 2019. doi:https://doi.org/10.1126/science.aay0989.
- Gulcan, S. 2014. “Spectral and Spatial Quality Analysis of Pan-sharpening Algorithms: A Case Study in Istanbul.” European Journal of Remote Sensing 47 (1): 19–28. doi:https://doi.org/10.5721/EuJRS20144702.
- Hu, T., and R. B. Smith. 2018. “The Impact of Hurricane Maria on the Vegetation of Dominica and Puerto Rico Using Multispectral Remote Sensing.” Remote Sensing 10: 827. doi:https://doi.org/10.3390/rs10060827.
- Keellings, D., and J. J. Hernández Ayala. 2019. “Extreme Rainfall Associated with Hurricane Maria over Puerto Rico and Its Connections to Climate Variability and Change.” Geophysical Research Letters 46: 2964–2973. doi:https://doi.org/10.1029/2019GL082077.
- Laben, C. A., V. Bernard, and W. Brower. 2000. “Process for Enhancing the Spatial Resolution of Multispectral Imagery Using Pan-sharpening.” US Patent 6011875 A.
- Morawitz, D. F., T. M. Blewett, A. Cohen, and M. Alberti. 2006. “Using NDVI to Assess Vegetative Land Cover Change in Central Puget Sound.” Environmental Monitoring and Assessment 114 (1–3): 85–106. doi:https://doi.org/10.1007/s10661-006-1679-z.
- Morelock, J., N. Schneidermann, and W. R. Bryant. 1977. “Shelf Reefs, Southwestern Puerto Rico. Reefs and Related Carbonates - Ecology and Sedimentology.” In Studies in Geology, edited by S. H. Frost, M. P. Weiss, and J. B. Saunders, 17–25. Vol. 4. Tulsa, Okla.: American Association Petroleum Geologists.
- Pasch, R. J., A. B. Penny, and R. Berg. 2018. “National Hurricane Center Tropical Cyclone Report Hurricane María (AL152017).” Accessed 20 August 2018. https://www.nhc.noaa.gov/data/tcr/AL152017_María.pdf
- Radabaugh, K. R., R. P. Moyer, A. R. Chappel, E. E. Dontis, C. E. Russo, K. M. Joyse, M. W. Bownik, A. H. Goeckner, and N. S. Khan. 2019. “Mangrove Damage, Delayed Mortality, and Early Recovery following Hurricane Irma at Two Landfall Sites in Southwest Florida, USA.” Estuaries and Coasts. doi:https://doi.org/10.1007/s12237-019-00564-8.
- Rodgers, J. C., A. W. Murrah, and W. H. Cooke. 2009. “The Impact of Hurricane Katrina on the Coastal Vegetation of the Weeks Bay Reserve, Alabama from NDVI Data.” Estuaries and Coasts 32 (3): 496–507. doi:https://doi.org/10.1007/s12237-009-9138-z.
- Rodríguez-Martínez, R. E., P. D. Roy, N. Torrescano-Valle, N. Cabanillas-Terán, S. Carrillo-Domínguez, L. Collado-Vides, M. García-Sánchez, and B. I. van Tussenbroek. 2020. “Element Concentrations in Pelagic Sargassum along the Mexican Caribbean Coast in 2018-2019.” PeerJ 8: e8667. doi:https://doi.org/10.7717/peerj.8667.
- Rouse, J. W., Jr., R. Haas, J. Schell, and D. Deering. 1974. “Monitoring Vegetation Systems in the Great Plains with ERTS.” NASA Special Publication 351: 309.
- United Nations Educational, Scientific and Cultural Organization (UNESCO). 1998. Coastal Region and Small Island Paper 3, La Parguera Puerto Rico. Paris, France: CARICOMP—Caribbean Coral Reef, Seagrass and Mangrove Sites; UNES. Accessed 17 November 2015 http://www.unesco.org/csi/pub/papers/garciab.htm
- Van Beusekom, A. E., N. L. Álvarez-Berríos, W. A. Gould, M. Quiñones, and G. González. 2018. “Hurricane Maria in the U.S. Caribbean: Disturbance Forces, Variation of Effects, and Implications for Future Storms.” Remote Sensing 10 (9): 1386. doi:https://doi.org/10.3390/rs10091386.
- van Tussenbroek, B., . I., H. A. Hernández Aranab, R. E. Rodríguez-Martíneza, J. Espinoza- Avalosb, H. M. Canizales-Floresa, C. E. González-Godoya, M. G. Barba- Santosa, V.-Z. Alejandro., and L. Collado-Vides. 2017. “Severe Impacts of Brown Tides Caused by Sargassum Spp. On Near-shore Caribbean Seagrass Communities.” Marine Pollution Bulletin 122 (1–2): 272–281. doi:https://doi.org/10.1016/j.marpolbul.2017.06.057.
- Wang, M., C. Hu, B. B. Barnes, G. Mitchum, B. Lapointe, and J. P. Montoya. 2019. “The Great Atlantic Sargassum Belt.” Science 365 (6448): 83–87. doi:https://doi.org/10.1126/science.aaw7912.
- Jinru, Xue., and Baofeng Su. “Significant Remote Sensing Vegetation Indices: A Review of Developments and Applications.” Journal of Sensors,vol. 2017. Article ID 1353691,17pages,2017 https://doi.org/https://doi.org/10.1155/2017/135369117.