Abstract
Bee diversity and pollination services delivery in coffee fields are known to be driven by micro, local, landscape and regional drivers. The purpose of this study was to provide empirical documentation of drivers of bee biodiversity and pollination services delivery to coffee (Coffea canephora) under local conditions in Uganda. On-farm pollination experiments were therefore conducted in 30 small-scale coffee farms with contrasting land-use and management characteristics. The results indicated that coffee flowers were visited by 24–38 bee species with meliponine bee species being the most frequent visitors. The highest fruit set (84%) was recorded in hand cross-pollination followed by open pollination (62%) and bagged flowers (0.8%) treatment. Coffee proportion potential yield and bee contribution to fruit set were positively related to bee abundance, species richness, foraging rate and to the amount of semi-natural habitats available in the surroundings of coffee fields. Distance to forest/wetland and cultivation intensity were negatively related to coffee proportion potential yield but positively related to coffee pollination limitation. Farmers would benefit from establishing coffee fields in the vicinity of natural habitats and from adopting pollinator-friendly farming and conservation practices such as increasing the area of semi-natural habitat features as well as promoting high on-farm tree cover to protect good pollinators (e.g. meliponine bees) of coffee in the landscape.
Introduction
Coffee is Uganda's most important agricultural cash crop and export item (Munyuli Citation2010). An estimated 2–14% of rural households earn all or most of their cash income from coffee. There are an estimated 500,000–800,000 small coffee farms with an average size of less than 1 ha (Munyuli Citation2010) in Uganda.
The genus Coffea (Rubiaceae) is native to tropical and subtropical Africa (Klein et al. Citation2003a, Citation2003b). Two coffee species are important crops in many tropical countries: highland coffee, Coffea arabica L. that is native to the mountains of Ethiopia, and lowland coffee, Coffea canephora Pierre ex Froehner, syn. Coffea robusta, originally from the lowlands of Central Africa (Democratic Republic of Congo). Coffea canephora covers more than 90% (Oryem-Origa Citation1999) of the land dedicated to coffee production in Uganda. Coffea canephora plantations are concentrated in Central Uganda around the Lake Victoria Arc Zone where coffee is one of the main components of the ‘coffee–banana agroforestry system’ (Munyuli Citation2010).
Overall, coffee plays a key role not only in small-scale household economy but also in the national economy in Uganda (Munyuli Citation2010). Therefore, information to improve or stabilize the productivity of the crop can influence rural development policies. Coffea canephora is a pollinator-dependent crop (Klein et al. Citation2007; Munyuli 2010) and its yield in Uganda can be increased through a better understanding of pollination ecology mechanisms. However, knowledge of coffee pollination ecology in sub-Saharan Africa (Karanja et al. Citation2010) and Uganda (Munyuli Citation2010) is scarce and the impact of bees on yield of coffee fruit has not been quantified.
Available studies focus on the effects of bee species richness and/or the abundance of bees on coffee fruit set and production (Klein et al. Citation2003a; Ricketts Citation2004). Few studies have examined biophysical variables (drivers) affecting the delivery of pollination services to coffee (Klein et al. Citation2003b). In sub-Saharan Africa and in Uganda, important abiotic and biotic drivers of coffee pollination and yield remain largely unknown. In Costa Rica, it was found that fruit set of coffee could be predicted by the number of flower-visiting bee species (not the number of bees) (Ricketts et al. Citation2004). In Indonesia, it was also observed that the number of social bees decreased with forest distance, whereas the number of solitary bees increased with light intensity and increasing blossoms cover of herbs/weeds and coffee (Klein et al. Citation2003b). From these studies, it was not clear whether increase in fruit set could be predicted by increased amount of semi-natural habitats in the landscape. In other studies, social bees were found to contribute more to the explanation of fruit set than solitary bees. Fruit set of open pollinated flowers (in contrast to manually cross-pollinated flowers) was positively correlated with the diversity and number of flower-visiting bees (Klein et al. Citation2003b).
Potential drivers of pollinator diversity and pollination services delivery (Kremen et al. Citation2007; Winfree et al. Citation2009) to coffee in agricultural landscapes are found at micro (e.g. light intensity, shade cover), local (e.g. abundance of blooming floral resources), landscape (e.g. forest distance) and regional (e.g. land-use intensity) levels. It is not clear which drivers are important for coffee fruit set and production in the coffee–banana agroforestry system of Central Uganda. Drivers may work alone or in synergy to produce negative or positive impacts on coffee fruit set and yield.
The objective of this study was to identify microclimatic, local, landscape and regional level factors that affect bee biodiversity and delivery of pollination services to coffee. It was hypothesized that bee diversity and pollination services are positively correlated with the cover of semi-natural habitats, cover of blooming trees and blooming weeds in the coffee farm; and inversely correlated with the distance to semi-natural habitats and to the overall intensity of land use.
Materials and methods
Study area and coffee field selection
This study was conducted from June 2007 to March 2008 by setting pollination experiments with participation of small-scale farmers in 30 different small-scale coffee farms (0.25–15 ha). These coffee farms were selected from 26 different sites located in different districts (Munyuli Citation2012) in the banana–coffee system of Lake Victoria Arc Zone in Central Uganda (). Farmers participated in the experiments by offering their coffee fields, by cooperating during monitoring and by preventing children and animals from disturbing pollination experiments.
Figure 1. Location of study sites in the banana–coffee producing areas around Lake Victoria in Uganda, from which coffee farms were selected.
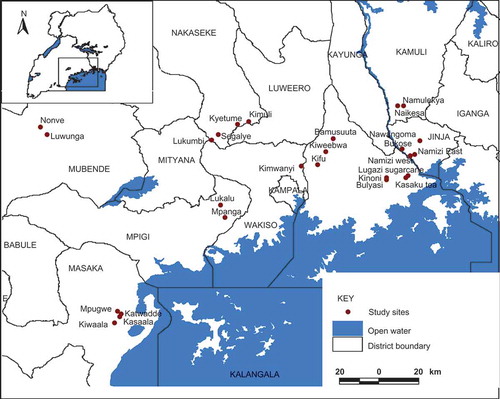
The Lake Victoria Arc is characterized by ferrisoils with high to medium fertility level and receives on average 1000–1800 mm of rains on a bimodal pattern with 22–28°C and 60–75% of mean annual temperature and relative humidity, respectively (Munyuli et al. Citation2008; CitationMunyuli 2011a, 2011b). Several food and cash crops that are pollinator-dependent crops are grown in small-scale monoculture and/or polyculture fields. Coffee (Coffea canephora) is the main cash crop and banana is the main staple food crop (CitationMunyuli 2011c). Prior to the selection of experimental fields, a study tour of different sites was made and field characteristics were noted. For each study site, a coffee field was selected to represent all land-use and environmental variations within the study site. Thus, the 30 experimental coffee fields were finally selected along contrasting environmental gradients, local farm management systems, microclimatic characteristics and land-use intensity gradients. The study was designed to minimize spatial autocorrelation between local and landscape-scale variables measured within study sites by maintaining a minimum distance between coffee fields of 5–25 km, that is, beyond the normal foraging range of most pollinator species.
Pollination experiment and flower visitation censuses
In each of the 30 selected coffee fields, 5 coffee trees were randomly selected; and for each of these, 3 branches with buds initiating flowers were randomly selected. Experimental and control coffee branches were tagged for visibility in the field. On each experimental coffee branch, individual flowers were counted, labelled and marked using coloured ribbons. Following Klein et al. (Citation2003a, Citation2003b), each branch was randomly assigned to one of the following three pollination treatments: (i) open pollination (natural pollination), that is, the unrestricted pollination of coffee flowers by insects and wind; (ii) cross-pollination (artificial pollination) where pollens from other flowering coffee plants in the vicinity of the experimental coffee trees were collected and released onto selected coffee flowers using a camel brush; or (iii) bagging coffee flowers (self-pollination), that is, the control treatment where no pollination by external vectors was allowed, thereby testing for possible spontaneous self-pollination (autogamy) using very fine white nylon fine mesh (10 μm) impermeable to pollen. Five to six weeks after pollination, fruit set was determined by counting the number of green fruits on each treatment branch (Klein et al. Citation2003a, Citation2003b; Munyuli 2010). No treatment was done to assess the contribution of wind, since previous studies (Klein et al. Citation2003a, Citation2003b) found low contribution of wind to both lowland and highland coffee fruit set (<0.1–1.6% of fruit set).
Insect visits to flowers were observed under typical good weather conditions (i.e. sunny and slightly cloudy days with low wind velocity) in each coffee field in three time intervals (7h00–10h00, 11h00–14h00, 15h00–18h00) for at least 30 minutes per coffee tree per observation. Three repeated visits were recorded. Observations were restricted to coffee trees in full bloom (i.e. >70% of their flowers opened). A visit was defined as occurring when an insect touched the anthers or stigmas. In addition to visitation censuses, foraging speed (number of flowers visited/minute) and visitation/pollination speed (number of seconds spent per flower) were measured using a stopwatch. Visitation censuses were conducted during the first and second blooming seasons. A hand net was used to sample flower-visiting bee species for identification in the laboratory. Collected voucher specimens were identified using a previously established bee collection that is deposited at Makerere University Zoology Museum. Prior to the identification of bees, I received solid training in bee taxonomy and systematics under guidance of Connal Eardley. In addition, copies of the specimens were sent to him for confirmation of the identity of the bee species. Thus, I am an expert taxonomist familiar with afrotropical bees (see also Munyuli et al. Citation2008; CitationMunyuli 2011b; Munyuli et al. 2011; Munyuli Citation2012). All voucher specimens are deposited at Zoology Museum of Makerere University under the folder ‘Uganda coffee bees 2007’. Voucher numbers are composed of the name of collector (THEO), the plant (COF) on which the species was recorded, the country and the year of collection (UG07), the blooming season (A, B) and a three-digit collection number (e.g.THEO/COF/UG07/Season A/001).
Measurement of microclimatic, local, landscape and regional land-use intensity variables
Measured microclimatic variables specific to each coffee field were shade cover at the ground level; ambient temperature within the tree crown and relative humidity (both at 2 m above ground); and light intensity at the surface of blooming flowers on coffee branches. Temperature and relative humidity were measured with a mobile digital thermo-hygrometer (TESTO 605-H1), while light intensity was measured with a portable luxmeter (HI 97 500; digital light-gauge range: 0.1–199.9 Klux). For all microclimatic variables, 30 measurements were taken per coffee field and used to calculate the mean of each variable for every coffee field as recommended (Klein et al. Citation2003a, Citation2003b; Munyuli 2010).
Measured local variables of coffee flower visitations and fruit set were the percentage of young fallows (less than 2 years) in the vicinity of coffee fields and the amount of coffee and non-coffee floral resources (percentage cover of flowering trees, shrubs and herbs). The amount of young fallows found adjacent (2–15 m) to coffee fields was measured using a tape. Coffee floral resource availability was measured as the proportion of flowering coffee shrubs relative to all other flowering plants: in every selected field, 10 quadrats measuring 5 m × 5 m were randomly established to determine the number of plant species. Also in every selected field, 10 quadrats measuring 50 m × 50 m were randomly established to determine the percentage cover of herbs and trees/shrubs in bloom. Counts from the individual quadrats were summed and used to calculate a mean number of species and stems of blooming plants/crops per coffee field.
Landscape-level land-use data were collected within a 1 km2 site around each selected coffee field. Each square kilometre was delineated using a global positioning system (GPS) such that the experimental coffee field was located at its centre. Because there were no previously published data on small-scale land-use patterns in the study region, to facilitate basic measurements about different land uses the km2 area was divided into five transects of 200 m × 1000 m. Here the areas with different land-use types were measured using GPS or a tape in case of small fields (<50 m × 50 m). Land-use types were grouped into major land-use types based on their size and frequency of occurrence in order to calculate the area covered by semi-natural habitats, the area covered by crops and the cover of dependent and non-dependent cultivated crops per km2 area (Klein et al. Citation2007). The term semi-natural habitats included fallows, hedgerows, field margins, grasslands, roadsides, woodlands, woodlots, track-sides, stream-edges and so on. Pollinator-dependent crops are those that require a visit to its flowers by a pollinator to set fruits/seeds (Klein et al. Citation2007).
Three landscape variables of ecological importance (Bolwig et al. Citation2006) for pollination studies in agricultural matrices were then calculated for each coffee field: (i) the proportion (%) of semi-natural habitats; (ii) the cultivation intensity, that is, the percentage of the total land area cropped; and (iii) the distance from a given coffee field to the nearest potential natural pollinators' source (forest, wetlands). Distances up to 100 m were measured with a tape, otherwise with GPS (Garmin International, Olathe, KS, USA; corrected to ±1 m accuracy with Pathfinder v 2.0).
Regional land-use categories were obtained from the Makerere University Geographic Information Service. Broad land uses classified as low-intensity use includes areas where at least three-quarters of the land is uncultivated. Medium are managed habitat types where there is an almost equal distribution of cultivated and uncultivated land. High are areas dominated by crops or livestock. Very high represents large monoculture estates of tea, sugar, coffee and so on (Munyuli Citation2010).
Data analysis
Fruit set and pollination measures
Coffee fruit set was calculated as a proportion of total flowers that set fruit over the total number of flowers examined per experimental coffee branch. Based on three measures of pollination services delivery, the proportion potential yield of coffee (open pollination/cross-pollination), the proportion bee contribution to fruit set (open pollination – pollination exclusion) and the proportion pollination limitation (cross-pollination – open exclusion) were calculated (Klein et al. Citation2003a, 2003b; Dafni et al. Citation2005; Klein et al. Citation2007; Munyuli 2010; Nayak and Davidar Citation2010; David Inouye, personal communication 2011). These pollination service delivery measures were therefore calculated based on total and mean fruit set per treatment per coffee field.
The three measures (potential yield, bee contribution to fruit set and pollination limitation) are classically calculated by pollination biologists to measure pollination services (for details, see Kearns and Inouye Citation1993; Dafni and Kevan Citation2005). Practically, the proportion potential yield is the ratio of numbers of fruits set under open pollination conditions (full access of insects to flowers) and the hand cross-pollination (manual fertilization of flowers). It indicates expected maximum yield if all other production factors are optimally available and if production constraints are minimized in coffee fields (e.g. no disease leading to fruit abortion). The proportion bee contribution to fruit set is the difference between fruit set under open pollination conditions and fruit set when all insects are denied access to flowers. It is a measure of the approximate contribution of bees to the fertilization of coffee flowers. The proportion pollination limitation is the difference between fruits after hand cross-pollination (manual pollination) and fruits set after open pollination conditions (full access of insect pollinators to flowers). It indicates what additional yield that can be obtained if the availability of different functional groups and efficient bee species in coffee fields is maximized from nearby natural and semi-natural habitats.
Relationships between pollination service measures, bee diversity, flower visitation frequency, bee foraging intensity, microclimatic, local and landscape factors
All variables were checked for normality and transformed when necessary, prior to conducting any analysis. Pearson correlation analysis was used to determine the suite of variables most closely (P < 0.05) related to pollination service measures at the micro, local and landscape levels. Prior to conducting regression analyses, multicollinearity was prevented by avoiding the use of independent variables that were strongly intercorrelated (r > 0.60–0.90, p < 0.001). If two independent variables were collinear, one was discarded. For example, in the microclimatic variables, the maximum temperature was strongly correlated (r = 0.82, p < 0.01, n = 30) with light intensity; therefore, light intensity was retained in multiple regression whereas temperature was dropped.
Multiple linear regression analysis was conducted to identify local and landscape drivers that affected simultaneously coffee fruit set and pollination measures and bee diversity. Differences between the different regression parameters were assessed with t-tests. All simple and multiple regression analyses were conducted in Minitab version 15.1 (Minitab Inc., New York, NY, USA).
To analyse the effects of land-use categories, a general linear model (GLM) analysis of variance (ANOVA) was conducted with pollination measures as the dependent variables, and the categorical variables (low, medium and high) as fixed factors. ‘Very high’ was not part of this study since the focus was on small-scale fields. The least significant difference tests were used as post hoc tests for multiple comparisons of means.
Results
Effects of microclimatic drivers on bee communities, foraging activities and pollination measures
All pollination measures (pollination limitation, proportion potential yield and proportion bee contribution to fruit set) were significantly (P < 0.05) explained by both light intensity and shade cover (). Simple linear regression showed strong positive and significant (P < 0.001) relationship between light intensity and the number of flower-visiting bee species (R 2 = 0.656, F 1,28 = 53.38, P < 0.0001), bee density (R 2 = 0.423, F 1,28 = 20.54, P < 0.0001) and foraging rate (flowers visited/minute) of all bee species combined (R 2 = 0.197, F 1,28 = 6.87, P = 0.014). There was also a positive relationship between light intensity and the duration of the visit (seconds spent/branch) by Hypotrigona gribodoi Magretti (R 2 = 0.334, F 1,28 = 13.77, P = 0.001), indicating that this species increased its foraging time per coffee branch with increasing light intensity. In support, the number of bee species per coffee tree was negatively related to shade cover (R 2 = 0.272, F 1,28 = 10.46, P = 0.003).
Table 1. Relationships between measures of coffee pollination service delivery and microclimatic factors (A), local drivers (B), bee foraging intensity variables (C) and landscape drivers (D)
Effects of local drivers on bee foraging variables and pollination measures
Multiple regression analysis showed that the percentage cover of young fallows adjacent to a coffee field and the percentage cover of flowering weeds/herbs in the field were significant explanatory variables of proportion potential coffee yield (). The percentage of young fallows in the vicinity of a coffee field was positively related to the proportion of bee contribution to coffee fruit set (R 2 = 0.2841, F 1,28 = 11.11, P = 0.004), suggesting that both the proportion potential yield and the proportion contribution of bees to coffee fruit increased with increase in the proportion of young fallows in the immediate surroundings of coffee fields and with increase in the abundance of flowering weeds/herbs.
The proportion pollination limitation was only related to the percentage cover of flowering weeds/herbs in coffee fields. Simple linear regression indicated that the proportion potential yield was significantly and positively related to the proportion of young fallows in the vicinity of a coffee field (R 2 = 0.2103, F 1,28 = 7.461, P = 0.026) and with the percentage proportion cover of flowering weeds/herbs in the coffee field (R 2 = 0.2432, F 1,28 = 9.00, P = 0.012).
Coffee flowers were visited by 24 bee species (first blooming season) and by 38 bee species (second blooming season) (see the Appendix for the list of bee species collected on coffee flowers). The pollination experiment showed the highest fruit set (84%) in hand cross-pollination treatment followed by open pollination (62%). Fruit set was negligible (0.8%) in controlled pollination.
Flower visitations by social bees resulted in 89.7% fruit set, and 71.4% for solitary bees. The most effective bee species was Meliponula ferruginea Lepeletier (98.0% fruit after single flower visit) followed by Meliponula nebulata Smith (97.2%). Hypotrigona gribodoi Magretti was the most abundant and important bee species although not the most efficient (89.0% fruit after single visit). Meliponini bees were particularly abundant, important and frequent visitors of coffee flowers in Uganda.
Multiple regression analysis revealed that coffee pollination measures were significantly (P < 0.05) influenced by the number of bee species, bee foraging rate and the percentage of trees with fresh blossoms in coffee fields (). Similarly, bee contribution to fruit set was found to be significantly (P < 0.05) explained by bee species richness and bee density. Variations in pollination limitation (pollination deficit) were significantly (P < 0.05) predicted by bee density only ().
Bee contribution to fruit set was significantly (P < 0.001) and positively related to both the number of flower-visiting bee species and the density of flower visitors. Similarly, the proportion potential yield was significantly and positively related to the diversity of bee tribes that visit coffee flowers (R 2 = 0.4871, F 1,28 = 26.59, P < 0.0001). In contrast, the proportion pollination limitation was negatively and significantly related to the density of flower visitors, indicating that pollination deficit decreased with increase in the density of pollinating bees.
The proportion potential yield was also significantly and positively related to the foraging rates of M. ferruginea (R 2 = 0.1556, F 1,28 = 5.16, P = 0.031) and M. nebulata (R 2 = 0.1567, F 1,28 = 5.2, P = 0.030) and to the total foraging rate of all bee species per coffee branch (R 2 = 0.438, F 1,28 = 21.8, P < 0.0001).
The duration of visit (seconds spent/coffee branch) by H. gribodoi was significantly and positively related to the percentage cover of coffee trees with open fresh flowers (R 2 = 0.3745, F 1,28 = 16.75, P < 0.001) as was the visitation speed (seconds spent/flower) of a given bee species (R 2 = 0.189, F 1,28 = 6.52, P = 0.016). Additionally, the foraging rate (number of flowers visited/minute) was significantly and positively correlated with the proportion cover of branches with fresh blossoms per coffee tree (R 2 = 0.242, F 1,28 = 8.93, P = 0.006).
While exploring the influences of other cultivated annual entomophilous crop species on the delivery of pollination services to coffee, it was found that the proportion potential coffee yield was negatively and significantly related to both the percentage cover of cultivated crops that are pollinator dependent (R 2 = 0.295, F 1,28 = 11.72, P = 0.002) and the percentage cover of other non-coffee fields in the km2 area (R 2 = 0.191, F 1,28 = 6.60, P = 0.016). This suggests that the delivery of pollination services in a coffee field by bees may decrease with increase in cultivation of diverse pollinator-dependent crop species in the same landscape where coffee fields are located.
Effects of landscape drivers on bees and pollination measures
Multiple regression models indicated that pollination measures (pollination limitation, bee contribution to fruit set and potential yield) were significantly (P < 0.05) predicted by all landscape drivers tested (cultivation intensity, forest distance and the amount of semi-natural habitats in a km2 area; ).
Cultivation intensity was highly negatively related to both proportion potential yield and proportion bee contribution to coffee fruit. In contrast, the proportion pollination limitation was positively and significantly (P < 0.001) correlated with cultivation intensity. Distance to forest/wetlands was negatively and significantly related to both proportion potential yield and proportion bee contribution to coffee fruit. In contrast, pollination limitation was positively and significantly related to the distance to forest. The proportion (%) of semi-natural habitats was found to be positively and significantly related to proportion potential yield and proportion bee contribution to coffee fruit set. Pollination limitation was negatively and significantly related to percentage cover of semi-natural habitat. It was also observed that the number of flower-visiting bee species was negatively and strongly related to distance to semi-natural habitats (R 2 = 0.5359, F 1,28 = 32.33, P < 0.0001), indicating that the species richness of flower-visiting bee fauna significantly declined linearly with increasing distance from the nearest bee refugia. Similarly, the number of bee species was negatively and significantly related to cultivation intensity (R 2 = 0.3196, F 1,28 = 13.15, P = 0.001), suggesting that bee species richness declined sharply with cropping intensification. Rates of bee visitation to coffee flowers in relation to the amount of semi-natural habitats, however, were positively and significantly correlated (R 2 = 0.2867, F 1,28 = 11.26, P = 0.002), possibly indicating that the species richness of flower visitor bee fauna significantly increased with increasing amount of semi-natural habitats within the farm landscape, and/or with increasing percentage cover of forest and fallow in 1 km2 agricultural matrices.
Effects of regional land-use categories on pollination measures
There were significant effects of regional land-use categories on the proportion potential coffee yield, proportion of bees contribution to coffee fruit set and proportion pollination limitation (). Pollination services delivered by bees to coffee were highest in the low land-use category and least in the high land-use intensity. A similar trend was observed for proportion potential coffee yield while pollination limitation showed the reverse trend.
Table 2. Effect of regional land-use intensity gradients (levels) on coffee pollination measures
Discussion
Influences of microclimatic factors on bee foraging activities
In this study, light intensity was found to be positively related to bee diversity (species richness) and to the proportion of bee contribution to fruit set. This result agrees with findings from Indonesia where it was found that diversity (species richness of solitary bees) and fruit set of open pollination increased positively with light intensity (Klein et al. Citation2003b). Overall, foraging behaviour of bees is known to be temperature dependent and bees respond similarly to temperature and light intensity (Veddeler et al. Citation2006). Thus, an understanding of environmental (microclimatic) factors that affect behaviours of different foraging wild bees is basic to conservation and sustainable utilization of pollinators to increase fruit/seed sets of most crops/plants (Wang et al. Citation2009) that are pollinator dependent.
While in traditional agroforestry systems in Ecuador, it was found that bee species richness positively increased linearly with shade cover (Veddeler et al. Citation2006); negative and significant non-linear relationships between bee species richness and pollination services delivery and shade cover (%) were found in this study. The optimal shade cover for bee foraging activities ranged between 10% and 50%, meaning that, on overall, the number of bee species that visited coffee flowers increased with increases in shade cover up to a certain level before starting to drop. This finding is supported by the work of Klein et al. (Citation2003a) in Indonesia. However, this finding is not in line with findings from coffee plantations in Southern Mexico where a significantly greater number of visits in highly shaded coffee habitats were recorded in low-shaded coffee habitats for both native and exotic bees (Jha and Vandermeer Citation2009a, Citation2009b).
This study and previous studies found that both light intensity and shade cover affected bee species richness; foraging activities of different bee species are somehow regulated simultaneously by both factors. Practically, managing coffee fields with reduced shading may enable light to reach blooming plant species located at the ground layer. This may stimulate the availability of blooming weeds/herbs providing continuously nectar and pollen resources to bees, particularly when coffee blossoms are not available. Consequently, coffee farmers may promote bee abundance and diversity within their own farms by diversifying their shading trees. Farmers may also attract diverse bee species by adopting farm management systems (farming practices) allowing trees to age, thus creating a mosaic of light gaps and flowering herb patches that will in turn attract a diversity of foraging pollinators to coffee (Omoloye and Akinsola Citation2006; Munyuli 2010). The understanding of activities and performance of native bee species under different shade intensities and temperatures is needed in order to assess the effects of habitat deterioration and climate change on these key coffee pollinators in Uganda.
Influences of local drivers on pollination services delivery
The results of this study showed that the proportion potential yield was predicted by both the percentage cover of young fallows adjacent to a coffee field within 2–15 m distance and the percentage cover of flowering weeds/herbs in the field. Significant positive relationships were also found between the proportion potential yield and percentage cover of young fallows and the percentage cover of flowering weed/herbs. It was also realized that proportion potential yield was positively related to percentage of coffee trees with fresh blossoms in a coffee field.
The fact that the proportion cover of young fallows adjacent to a coffee field was positively related to the proportion bee contribution to fruit set indicates that young fallows may act as refugia for various pollinating bee species (particularly stingless and some solitary bee species). In addition, the positive relationship between the proportion of young fallows and the proportion potential yield stresses the importance of having young fallows in the surrounding of coffee fields. Consequently, changes in the cover of young fallows in the vicinity of coffee fields are likely to generate variations in the visitations to coffee blossoms and yield productivity. It is likely that very good pollinator species (e.g. meliponines) prefer inhabiting the immediate surroundings of coffee fields (Munyuli, personal observation) as compared to other social and solitary bees (Klein et al. Citation2003a, Citation2003b; Ricketts et al. Citation2008; Munyuli 2010).
Influences of landscape drivers
Influences of cultivation intensity on pollinators and pollination services delivery
In this study, it was observed that proportion potential yield and bee contribution to fruit set declined with cultivation intensity and that pollination limitation increased with cultivation intensity. In addition, it was observed that species richness declined sharply with cropping intensification. This may be attributed to limitation in nesting opportunities as bee nesting and foraging habitats are eliminated. It is generally accepted that increased cultivation intensity leads to pollinator extirpation/decline (Kremen et al. Citation2007; Lonsdorf et al. Citation2009). Specialized bee species are the first to be lost with increasing cultivation, followed by generalists, especially in the Apoidea group whose bee species have different nesting/foraging requirements (Kremen et al. Citation2007).
In this study, it was also observed that pollination limitation increased with cultivation intensity. Pollination limitation is a consequence of changes in pollinator abundance, diversity and identity (Lander et al. Citation2009; Munyuli 2010). The lack of suitable pollinators together with nutrient resources limitation are two important factors traditionally held responsible for incomplete fruit and seed set (Jacobi and delSarto Citation2007). This can be further exacerbated by temporary lack of visits because of climate variations, habitat degradation/alterations, soil degradation and nutrient deficiency and competition with other floral resources (Jacobi and delSarto Citation2007). For the case of coffee in Uganda, it seems that high pollination limitation may be primarily linked to cultivation intensity and to the resultant decrease in flower visitations by different pollinator species.
Influences of semi-natural habitats on bee communities and pollination services delivered to coffee
In this study, it was observed that the proportion of semi-natural habitats was positively related to both the proportion potential yield and the proportion bee contribution to fruit set and negatively related to the proportion pollination limitation. This suggests that pollinator biodiversity conservation and related ecosystem services are correlated with retention of native perennial vegetation in Afrotropical mosaic farm landscapes. In support, other studies have reported a positive relationship between coffee fruit set (%) and the amount (%) of semi-natural habitats in the landscape (Gemmill-Herren and Ochieng Citation2008; Kasina et al. Citation2009; Otieno et al. Citation2011) or the proximity of coffee fields to forest habitats (Klein et al. Citation2003a, 2003b; Ricketts et al. Citation2004; Veddeler et al. Citation2008). The positive effect of semi-natural habitats on fruit/seed set is always attributed to more visitations from a diverse bee community sourcing from these semi-natural features (Karanja et al. Citation2010; Breeze et al. Citation2011; Winfree et al. Citation2011). In non-coffee production systems, studies have reported negative effects of habitat loss on bee species and density (Kremen et al. Citation2004; Greenleaf and Kremen Citation2006a, Citation2006b).
For a natural/agricultural area to support diverse bee faunas (Cane et al. Citation2006; Winfree et al. Citation2008), the landscape must harbour more than 20% natural and semi-natural habitats (Tscharntke et al. Citation2005) close enough to crop fields for bees to reach them. Kremen et al. (Citation2004) recommended that farmers keep at least 30–40% of their land wild to serve as pollinator reservoirs in order to avoid pollination deficit and yield reduction while Winfree et al. (Citation2008) recommended that the landscape should be covered by at least 66% wild land. In Uganda, it is therefore proposed that each farm keeps 10–40% of land uncultivated (Munyuli Citation2010); beyond 40% the total productivity may be jeopardized since too much land may be kept uncultivated.
Influences of the distance to natural habitats (forest patches) on bee visitation rates
The results of the study indicated that forest/wetland distance was strongly negatively related to both the proportion potential yield and the proportion bee contribution to fruit set and positively related to the pollination limitation. In addition, the species richness of flower-visiting bee fauna significantly declined linearly with increasing distance from the nearest natural habitats (forest/wetlands). Similarly, the visitation frequencies (abundance) of flower-visiting bees dropped with forest distance, especially for social bees. Natural habitats are thus important in shaping the pollinator community and influence pollination services delivery to coffee. These results are consistent with studies on coffee pollination in tropical Asia and in Neotropical regions where it was observed that nearby rainforest promotes coffee pollination by increasing spatio-temporal stability in bee species richness (Veddeler et al. Citation2008; Klein Citation2009; Garibaldi et al. Citation2011). In Panama, Indonesia, Costa Rica and Brazil, complex agroforestry systems were found to support higher bee diversity and bee visits to coffee flowers compared to monocultures or simple shaded systems (Roubik Citation2002; Klein et al. Citation2003a; DeMarco and Coelho Citation2004; Ricketts Citation2004; Ricketts et al. Citation2004; Veddeler et al. Citation2006; Klein, Olschewski et al. Citation2008; Vergara and Badano Citation2009). Similar findings exist for non-coffee crops (Kremen et al. Citation2004; Chacoff and Aizen Citation2006; Chacoff et al. Citation2008).
Forest patches in Central Uganda were found to enhance pollinator activity in surrounding agricultural fields, since pronounced reductions in bee populations and in fruit set occurred frequently in coffee fields located far from these natural habitats. In this study, the distance at which bee richness and pollination services dropped to half of their maximum value was of 500–700 m. Similar findings are documented from other tropical regions growing coffee (Klein, Cunningham et al. Citation2008; Klein, Olschewski et al. Citation2008; Ricketts et al. Citation2008).
A maximum fruit set of 85–90% at the forest edge (0–100 m) with 20–30 bee species, and a maximum fruit set of 50–60% in 1500 m distance with 3–5 bee species were found in coffee agroforestry systems in Indonesia (Klein et al. Citation2003a). Similar reductions of fruit set in relation to bee species richness and density and distance to forest edge (bee refugia) were observed in this study. The results from Indonesia and Uganda indicated that forest patches are valuable sources of crop pollinators. Thus, clear management recommendations should be developed for their conservation (Sande et al. Citation2009), since the distance to nearest pollinator refugia (natural and semi-natural habitats) is a critical determinant landscape factor in the delivery of pollination services to various pollinator-dependent crops (Martins and Johnson Citation2009; Carvalheiro et al. Citation2010).
Influences of regional land-use categories on coffee pollination measures
In this study, it was observed that pollination services delivery to coffee was significantly affected by land-use intensity gradients. Similarly, studies conducted elsewhere on coffee visitation by wild pollinators found negative effects of human land-use systems on bee diversity/density and on coffee fruit set (Ricketts Citation2004; Klein et al. Citation2007; Ricketts et al. Citation2008). Both habitat and landscape fragmentation may affect negatively the dispersal ability of pollinators searching for coffee blossoms (Winfree et al. Citation2009) in tropical agricultural matrices. In addition, increased chemical application of pesticides can lead to erosion of specialist pollinators while increasing the prevalence of common and generalist bee species in the landscape (Winfree et al. Citation2009). With land-use intensification, coffee farmers aim at maximizing yields. Farmers may therefore adopt all methods to increase the yield, including application of chemical fertilizers and pesticides, which may cause exponential increase in pollination limitation.
Conclusions
The objective of this study was to identify microclimatic, local, landscape and regional level factors that affect bee biodiversity and delivery of pollination services to coffee. At the micro-level, it was observed that bee diversity and foraging activities and pollination services delivery increased linearly with light intensity, whereas shade cover produced a reverse trend. At the local level, the proportion contribution of bees to fruit set increased linearly with increases in availability of mass blooming weeds/herbs. At the landscape level, it was found that bee biodiversity and pollination services delivery declined steeply with cultivation intensity and forest distance. Similarly, at the regional level, pollination services declined sharply with land-use intensity.
Coffee pollination services provided by native bee communities (Munyuli et al. Citation2011) were strongly dependent on the proportion cover of semi-natural habitat within the landscape. Conservation of natural and semi-natural habitats may thus both serve to promote conservation of bee diversity in the coffee–banana farming systems in Uganda while simultaneously positively enhancing and stabilizing productivity of entomophilous crop species (Garibaldi et al. Citation2011; Rader et al. Citation2012) such as lowland coffee. Hence, to obtain consistent delivery of optimal pollination services to coffee and to other crops, it is recommended to farmers to adopt pollinator-specific farm management practices/strategies that consider the foraging and nesting needs of both native solitary and social bees within the farm landscapes. One of the important findings of this study was the importance of stingless bees in coffee pollination. These meliponine bees are particularly dependent on local nesting and floral resources found in the vicinity of coffee fields.
Farmers are likely to enhance coffee yield when they grow coffee beneath a diversity of shade tree species, but also by providing sunlight (e.g. by planting few shading tree species at the border of the farm) to promote flowering herbs and nesting opportunities (Kremen et al. Citation2002; Ricketts et al. Citation2004; Kremen et al. Citation2007; Ricketts et al. Citation2008; Julier and Roulston Citation2009; Klein Citation2009; Hoehn et al. Citation2010). Farmers are also advised, if possible, to keep 10–40% of their land uncultivated to maximize coffee production and obtain additional benefits, including other crop production increase and stability over time. Uncultivated areas will always act as reservoirs for diverse pollinating agents in the farm landscape. Advisory service agents should advise small-scale coffee producers on how to diversify non-cropped habitats to promote housing of diverse good pollinator species. Current global environmental changes are expected to have manifold effects on pollination services delivery to coffee (Munyuli Citation2012) and other crops. Therefore, there is a need to conduct further researches/studies on impacts of interacting multiple drivers/stresses on pollination services delivery to coffee.
Acknowledgements
I am very grateful to the Darwin Initiative (Defra, UK; project reference: 14-032) for funding this study under the project title: Conserving biodiversity in modernized farm landscapes in Uganda. I am also very grateful to project leaders (Dr Juliet Vickery, RSPB, Cambridge University, UK, Dr Phil Atkinson, British Trust for Ornithology, UK and Prof. Derek Pomeroy, Makerere University), scientific supervisors (Prof. Simon Potts, University of Reading, UK and Prof. Philip Nyeko, Makerere University, Uganda) and farmers for offering their farms for pollination experiments and for their kind cooperation during data collection. I am very grateful to Dr Bwinja M and to Mr Maurice Mutabazi (research assistant) for his assistance in the field. I am also very grateful for the comments made by various anonymous reviewers who assisted in improving this article.
References
- Bolwig , S , Pomeroy , D , Tushabe , H and Mushabe , D. 2006 . Crops, trees, and birds: biodiversity change under agricultural intensification in Uganda's farmed landscapes . Danish J Geogr , 106 ( 2 ) : 115 – 130 .
- Breeze , TD , Bailey , AP , Balcombe , KG and Potts , SG. 2011 . Pollination services in the UK: how important are honeybees? . Agric Ecosyst Environ , 142 ( 3–4 ) : 137 – 143 .
- Cane , JH , Minckley , RL , Kervin , LJ , Roulston , TH and Williams , NM. 2006 . Complex responses within a desert bee guild (Hymenoptera: Apiformes) to urban habitat fragmentation . Ecol Appl , 16 ( 2 ) : 632 – 644 .
- Carvalheiro , LG , Seymour , CL , Veldtman , R and Nicolson , SW. 2010 . Pollination services decline with distance from natural habitat even in biodiversity-rich areas . J Appl Ecol , 47 ( 4 ) : 810 – 820 .
- Chacoff , NP and Aizen , MA . 2006 . Edge effects on flower-visiting insects in grapefruit plantations bordering premontane subtropical forest . J Appl Ecol , 43 ( 1 ) : 18 – 27 .
- Chacoff , NP , Aizen , MA and Aschero , V. 2008 . Proximity to forest edge does not affect crop production despite pollen limitation . Proc R Soc Lond B Biol , 275 ( 1637 ) : 907 – 913 .
- Dafni , A , Kevan , GP and Husband , C. 2005 . Practical pollination ecology , 590 Cambridge (ON) : Enviroquest Ltd .
- DeMarco , P JR and Coelho , FM . 2004 . Services performed by the ecosystem: forest remnants influence agricultural cultures’ pollination and production . Biodivers Conserv , 13 ( 7 ) : 1245 – 1255 .
- Garibaldi , LA , Steffan-Dewenter , I , Kremen , C , Morales , JM , Bommarco , R , Cunningham , SA , Carvalheiro , LGA , Chacoff , NP , Dudenhöffer , JF Greenleaf , SS . 2011 . Stability of pollination services decreases with isolation from natural areas despite honey bee visits . Ecol Lett , 14 ( 10 ) : 1062 – 1072 .
- Gemmill-Herren , B and Ochieng , AO . 2008 . Role of native bees and natural habitats in eggplant (Solanum melongena) pollination in Kenya . Agric Ecosyst Environ , 127 ( 1/2 ) : 31 – 36 .
- Greenleaf , SS and Kremen , C. 2006a . Wild bees enhance honey bees’ pollination of hybrid sunflower . Proc Natl Acad Sci USA , 103 ( 37 ) : 13890 – 13895 .
- Greenleaf , SS and Kremen , C . 2006b . Wild bee species increase tomato production and respond differently to surrounding land-use in Northern California . Biol Conserv , 133 ( 1 ) : 81 – 87 .
- Hoehn , P , Steffan-Dewenter , I and Tscharntke , T. 2010 . Relative contribution of agroforestry, rainforest and openland to local and regional bee diversity . Biodivers Conserv , 19 ( 8 ) : 2189 – 2200 .
- Jacobi , CM and MCL , delSarto . 2007 . Pollination of two species of Vellozia (Velloziaceae) from high-altitude quartzitic grasslands, Brazil . Acta Bot Bras , 21 ( 2 ) : 325 – 333 .
- Jha , S and Vandermeer , JH . 2009a . Contrasting foraging patterns for Africanized honeybees, native bees and native wasps in a tropical agroforestry landscape . J Trop Ecol , 25 ( 1 ) : 13 – 22 .
- Jha , S and Vandermeer , JH . 2009b . Contrasting bee foraging in response to resource scale and local habitat management . Oikos , 118 ( 8 ) : 1174 – 1180 .
- Julier , HE and Roulston , T . 2009 . Wild bee abundance and pollination service in cultivated pumpkins: farm management, nesting behavior and landscape effects . J Econ Entomol , 102 ( 2 ) : 563 – 573 .
- Karanja , RHN , Njoroge , GN , Gikungu , MW and Newton , LW. 2010 . Bee interactions with wild flora around organic and conventional coffee farms in Kiambu district, central Kenya . J Pollin Ecol , 2 ( 2 ) : 7 – 12 .
- Kasina , M , Kraemer , M , Martius , C and Wittmann , D. 2009 . Diversity and activity density of bees visiting crop flowers in Kakamega, Western Kenya . J Apic Res Bee World , 48 ( 2 ) : 134 – 139 .
- Kearns , CA and Inouye , DW. 1993 . Techniques for pollination biologists. Pueblo (CO) , University Press of Colarado .
- Klein , AM . 2009 . Nearby rainforest promotes coffee pollination by increasing spatio-temporal stability in bee species richness . For Ecol Manage , 258 ( 9 ) : 1838 – 1845 .
- Klein , AM , Cunningham , SA , Bos , M and Steffan-Dewenter , I. 2008 . Advances in pollination ecology from tropical plantation crops . Ecology , 89 ( 4 ) : 935 – 943 .
- Klein , AM , Olschewski , R and Kremen , C. 2008 . The ecosystem service controversy: is there sufficient evidence for a ‘pollination paradox’? . GAIA , 17 ( 1 ) : 12 – 16 .
- Klein , AM , Steffan-Dewenter , I and Tscharntke , T. 2003a . Fruit set of highland coffee increases with the diversity of pollinating bees . Proc R Soc Lond B Biol , 270 ( 1518 ) : 955 – 961 .
- Klein , AM , Steffan-Dewenter , I and Tscharntke , T. 2003b . Pollination of Coffea canephora in relation to local and regional agroforestry management . J Appl Ecol , 40 ( 5 ) : 837 – 845 .
- Klein , AM , Vaissière , BE , Cane , JH , Steffan-Dewenter , I , Cunnigham , SA , Kremen , C and Tscharntke , T. 2007 . Importance of pollinators in changing landscapes for world crops . Proc R Soc Lond B Biol , 274 ( 1608 ) : 303 – 313 .
- Kremen , C , Williams , NM , Aizen , M , Gemmill-Herren , B , LeBuhn , G , Minckley , R , Packer , L , Potts , SG , Roulston , T Steffan-Dewenter , I . 2007 . Pollination and other ecosystem services produced by mobile organisms: a conceptual framework for the effects of land-use change . Ecol Lett , 10 ( 4 ) : 299 – 314 .
- Kremen , C , Williams , NM , Bugg , RL , Fay , JP and Thorp , RW. 2004 . The area requirements of an ecosystem service: crop pollination by native bee communities in California . Ecol Lett , 7 ( 11 ) : 1109 – 1119 .
- Kremen , C , Williams , NM and Thorp , RW. 2002 . Crop pollination from native bees at risk from agricultural intensification . Proc Natl Acad Sci USA , 99 ( 26 ) : 16812 – 16816 .
- Lander , TA , Harris , SA and Boshier , DH. 2009 . Flower and fruit production and insect pollination of the endangered Chilean tree, Gomortega keule in native forest, exotic pine plantation and agricultural environments . Rev Chil Hist Nat , 82 ( 3 ) : 403 – 412 .
- Lonsdorf , E , Kremen , C , Ricketts , T , Winfree , R , Williams , N and Greenleaf , S. 2009 . Modelling pollination services across agricultural landscapes . Ann Bot , 103 ( 9 ) : 1589 – 1600 .
- Martins , DJ and Johnson , SD . 2009 . Distance and quality of natural habitat influence hawkmoth pollination of cultivated papaya . Int J Trop Insect Sci , 29 ( 3 ) : 114 – 123 .
- Munyuli , TMB. 2010 . Pollinator biodiversity and economic value of pollination services in Uganda [PhD dissertation]. [Kampala (Uganda)] , 431 Makerere University .
- Munyuli , TMB. 2011a . Assessment of indicator species of butterfly assemblages in coffee–banana farming system in central Uganda . Afr J Ecol , 50 ( 1 ) : 77 – 89 .
- Munyuli , TMB. 2011b . Pollinator biodiversity in Uganda and in Sub-Sahara Africa: landscape and habitat management strategies for its conservation . Int J Biodivers Conserv , 3 ( 11 ) : 551 – 609 .
- Munyuli , TMB. 2011c . Farmers’ perceptions of pollinators’ importance in coffee production in Uganda . Agric Sci , 2 ( 3 ) : 318 – 333 .
- Munyuli , TMB. 2012 . Diversity of life-history traits, functional groups and indicator species of bee communities from farmlands of central Uganda . Jordan J Biol Sci , 5 ( 1 ) : 1 – 14 .
- Munyuli TMB, Kasina M, Lossini J, Mauremootoo JR, Eardley C. 2011. Bee genera of East Africa (Kenya, Uganda and Tanzania), Lucid v. 3.5 key and fact sheets [Internet]. KARI, TPRI, PPRI, Busitema University, BioNET-EAFRINET, CABI & University of Queensland. [cited 2011 Dec 16]. http://keys.lucidcentral.org/keys/v3/EAFRINET. (http://keys.lucidcentral.org/keys/v3/EAFRINET.)
- Munyuli , TMB , Potts , SG and Nyeko , P. 2008 . Patterns of bee biodiversity and conservation values of localities with contrasting mini-ecological structures found within, nearby and between agricultural mosaic landscapes from central Uganda . Life Sci Int J , 2 ( 4 ) : 866 – 914 .
- Nayak , KG and Davidar , P . 2010 . Pollinator limitation and the effect of breeding systems on plant reproduction in forest fragments . Acta Oecol , 36 ( 2 ) : 191 – 196 .
- Omoloye , AA and Akinsola , PA. 2006 . Foraging sources and effects of selected plant characters and weather variables on the visitation intensity of honeybee, Apis mellifera adansonii (Hymenoptera: Apidae) in the southwest Nigeria . J Apic Sci , 50 ( 1 ) : 39 – 48 .
- Oryem-Origa , H. 1999 . Fruit and seed ecology of wild robusta coffee (Coffea canephora Froehner) in Kibale National park, Uganda . Afr J Ecol , 37 ( 4 ) : 439 – 448 .
- Otieno , M , Woodcock , BA , Wilby , A , Vogiatzakis , IN , Mauchline , AL , Gikungu , MW and Potts , SG. 2011 . Local management and landscape drivers of pollination and biological control services in a Kenyan agro-ecosystem . Biol Conserv , 144 ( 10 ) : 2424 – 2431 .
- Rader , R , Howlett , BG , Cunningham , SA , Westcott , DA and Edwards , W. 2012 . Spatial and temporal variation in pollinator effectiveness: do unmanaged insects provide consistent pollination services to mass flowering crops? . J Appl Ecol , 49 ( 1 ) : 126 – 134 .
- Ricketts , TH . 2004 . Tropical forest fragments enhance pollinator activity in nearby coffee crops . Biol Conserv , 18 ( 5 ) : 1262 – 1271 .
- Ricketts , TH , Daily , GC , Ehrlich , PR and Michener , CD. 2004 . Economic value of tropical forest to coffee production . Proc Natl Acad Sci USA , 101 ( 34 ) : 12579 – 12582 .
- Ricketts , TH , Regetz , J , Steffan-Dewenter , I , Cunningham , SA , Kremen , C , Bogdanski , A , Gemmill-Herren , B , Greenleaf , SS , Klein , AM Mayfield , MM . 2008 . Landscape effects on crop pollination services: are there general patterns? . Ecol Lett , 11 ( 5 ) : 499 – 515 .
- Roubik , DW. 2002 . “ Feral African bees augment neotropical coffee yield ” . In Pollinating beesthe conservation link between agriculture and nature , Edited by: Kevan , P and Imperatriz Fonseca , VL . 255 – 266 . Brasília (Brazil) : Ministry of environment .
- Sande , SO , Crewe , RM , Raina , SK , Nicolson , SW and Gordon , I. 2009 . Proximity to a forest leads to higher honey yield: another reason to conserve . Biol Conserv , 142 ( 11 ) : 2703 – 2709 .
- Tscharntke , T , Klein , AM , Kruess , A , Steffan-Dewenter , I and Carsten , T. 2005 . Landscape perspectives on agricultural intensification and biodiversity-ecosystem service management . Ecol Lett , 8 ( 8 ) : 857 – 874 .
- Veddeler , D , Klein , AM and Tscharntke , T. 2006 . Contrasting responses of bee communities to coffee flowering at different spatial scales . Oikos , 112 ( 3 ) : 594 – 601 .
- Veddeler , D , Olschewski , R , Tscharntke , T and Klein , AM. 2008 . The contribution of non-managed social bees to coffee production: new economic insights based on farm-scale yield data . Agrofor Syst , 73 ( 2 ) : 109 – 114 .
- Vergara , CH and Badano , EI . 2009 . Pollinator diversity increases fruit production in Mexican coffee plantations: the importance of rustic management systems . Agric Ecosyst Environ , 129 ( 1–3 ) : 117 – 123 .
- Wang , X , Liu , H , Li , X , Song , Y , Chen , L and Jin , L. 2009 . Correlations between environmental factors and wild bee behavior on Alfalfa (Medicago sativa) in North-western China . Environ Entomol , 38 ( 5 ) : 1480 – 1484 .
- Winfree , R , Aguilar , R , Vázquez , DP , Lebuhn , G and Aizen , MA. 2009 . A meta-analysis of bees’ responses to anthropogenic disturbance . Ecology , 90 ( 8 ) : 2068 – 2076 .
- Winfree , R , Gross , BJ and Kremen , C. 2011 . Valuing pollination services to agriculture . Ecol Econ , 71 ( 15 ) : 80 – 88 .
- Winfree , R , Williams , NM , Gaines , H , Ascher , JS and Kremen , C. 2008 . Wild bee pollinators provide the majority of crop visitation across land-use gradients in New Jersey and Pennsylvania, USA . J Appl Ecol , 45 ( 3 ) : 793 – 802 .