Abstract
Since the inception of the UN Convention on Biological Diversity (CBD) in 1992, little progress has been achieved in terms of involving the business community in protecting biological diversity worldwide. This article assesses the current activities of US Fortune 500 companies with respect to global biodiversity protection and the goals of the CBD. Data and information collected from 500 companies within eight major industrial sectors were further categorized at the company level to assess each company's involvement in global biodiversity protection. Our findings show that although companies' business profiles highly influence their decision-making process regarding the adoption of biodiversity protection policies and measures, their revenue profiles are less influential. We show that despite generating low revenues, companies in the utility sector are more active in the adoption of biodiversity protection policy than those in the financial sector, which generate high revenues. This study also demonstrates that companies must be convinced of the major effects of biodiversity loss on their bottom lines to be motivated to protect biological diversity. Companies' business and business-related risk profiles can also influence the adoption of biodiversity protection policies within the company. The study further demonstrates that a measurable biodiversity impact indicator is necessary for the companies to get seriously involved in the mitigation action. Finally, this study proposes a three-step biodiversity loss mitigation action framework that is drawn upon the assessment of the 500 companies that can contribute to develop an elaborative framework of business sector-specific mitigation plan.
Introduction
Since the inception of the UN Convention on Biological Diversity (CBD) in Citation1992, little progress has been achieved in terms of involving the business community in protecting biological diversity worldwide. According to the CBD, biodiversity refers to ‘the variability among living organisms from all sources including, inter alia, terrestrial, marine and other aquatic ecosystems and the ecological complexes of which they are part; this includes diversity within species, between species and of ecosystems’ (Article 2, Convention on Biological Diversity). Even for guiding investment, the biodiversity convention is perhaps the least specifically prescriptive global environmental convention (Moran et al. Citation1996). A wide gap still exists between the actions inducing climate change and the conservation of ecosystem and biological diversity (Heller and Zavaleta Citation2009). Thus far, efforts have been made mainly by the noncommercial sector including nongovernmental organizations (NGOs). Most international funding for biodiversity conservation is received from high-income countries' Overseas Development Assistance (ODA). All market-based mechanisms, including ecotourism, environmentally friendly products marketing, and payments for ecosystem services (PES), provide approximately 1–2 billion USD per annum (Gutman and Davidson Citation2007). This is profoundly insufficient to meet the current needs. Most funds are used for biodiversity and ecosystem service-related academic work and for a few demonstration projects that have limited impact on the ground (Gutman and Davidson Citation2007).
It has been estimated that the global biodiversity resource has been declining continuously over the last several decades, mainly due to increasing anthropogenic interferences (FAO Citation2010).Footnote 1 The CBD targets for 2010 are yet to be achieved fully in any aspect, including policy intervention, international finance, technology transfer, and patent issues (Butchart et al. Citation2010). In the recent statement of the Executive Secretary of the CBD in the Rio+20 summit (June 2012), it is clearly mentioned that CBD has so far failed in all its given assignments. In the process of investigating the reasons of such failure, it is also identified that lack of mainstreaming of ecosystem and biodiversity in the economic planning and economic sector are the major reasons (CBD Citation2012). As a matter of fact, the business sector has a major role to play in terms of mainstreaming ecology and biodiversity conservation. This is not only to have a sustainable business but also to mitigate the impacts of loss of biodiversity caused by the economic and business activities across the world. In 2010, a report for business sectors and biodiversity protection was published in the Economics of Ecosystems and Biodiversity (TEEB Citation2010). It is so far one of the most comprehensive reports on the general issues of business and biodiversity linkage (see Managi (Citation2012) for more recent literature). TEEB has repeatedly emphasized the importance of business sectors involved in the whole process of conservation and protection of ecology, biodiversity, and environment. Business sector with its financial and technological resources can indeed play a key role in the whole process. Conversely, in many cases, businesses are also responsible for the loss of biodiversity. For example, most multinational companies (MNCs) now operate their manufacturing units outside of their countries of origin. This is to enjoy multiple benefits, such as low production costs, less stringent laws and regulations (including environmental laws), and relatively easier utilization of natural resources, all of which can accelerate the local biological diversity loss (Mahidhar et al. Citation2009). Compared with climate change issues, biodiversity has generated low levels of international response (Heller and Zavaleta Citation2009).
Biodiversity is a public good of which the open and free use by one person does not bar others to use it freely at the same time. Thus, its true value is fully not realized by the market. As a result, the economy is unable to quantify the cost of externalities of biodiversity loss (Madsen et al. Citation2010). Sustained investment in global biodiversity monitoring and the development of measurable indicators are essential to track and improve the effectiveness of biodiversity protection initiatives (Walpole et al. Citation2009). The public and private sectors are equally important in this process to achieve the target. A growing number of evidence indicates that private sector companies engaged in the mitigation of biodiversity loss are now reporting their corresponding positive commercial and reputational impacts on their business activities (Metcalfe and Vorhies Citation2010). Policies such as labeling for environmentally friendly goods produced in a less costly operational method and sold well in the market can provide opportunities for a win–win situation. On the one hand, there is a growing amount of scientific evidence of rapid loss of biodiversity, which predicts severe impacts on sustainable development. On the other hand, there is lack of mitigation tools that can halt the loss of biodiversity. Although there is no single silver bullet for this solution, multifacet actions are required, which include mainstreaming of ecosystem and biodiversity conservation in the economic and business planning and activities.
Since biodiversity and ecosystems act as business inputs, the negative impact that they suffer eventually poses risks to companies. For water-intensive business processes such as agro-business, power generation and pulp and paper processing, negative impacts on water availability and water quality might create severe business risks. The risks include raw material supply constraints, higher procurement costs and quality of production. Similarly, for companies that are heavily dependent on land resources and biodiversity loss in land and soil may result in additional business risks resulting from yield reduction, soil contamination, pesticide overflows, and other related consequences.Footnote 2 Biodiversity loss or degradation can affect not only business outputs but also company reputation and goodwill due to a degraded local environment and adverse health impact on the local communities.
Understanding the importance of biodiversity and ecosystems in the context of sustainable business and development, growing numbers of literature have now been published in this area. The majority of this literature discusses the relationships between biodiversity and business in terms of the corporate social responsibilities (CSRs) of the private sector to protect biological diversity (TEEB for Business Citation2010). Rondinelli and Berry (Citation2000) conducted a content analysis of the environmental performance reports of 38 companies. Their findings showed that MNCs of different sizes and from different industries are adopting similar types of sustainable development programs (including biodiversity protection). This is because proactive environmental management provides immediate and direct business benefits, that is, lower costs, fewer risks and liabilities, and more efficient operations. However, they concluded that externally oriented programs such as corporate citizenship activities reflect a small portion of the environmental management activities and frequently do not provide the most potential for achieving sustainable development. The review of MNCs' environmental performance reports indicates that regardless of the type of green activities, most of the companies operate proactively when they see business benefits derived from a responsible environmental image (Rondinelli and Berry Citation2000). Dyke et al. (Citation2005) argued that publicity for environmental action is an important issue for the timber industry. Most of this publicity issues are related to the corporate forest management, but forestry certification, wildlife management, and land exchanges were also ranked as popular topics.
The TEEB Report for Business (Citation2010) also argued that the business sector gets motivated to invest more in the protection of biodiversity and ecosystems, provided that they observe that the serious damage to the ecosystem caused by the business activities can jeopardize company's reputation or can disrupt supply chain of raw materials or the protection activities can bring good payback in the near future.
Vickerman (Citation1999) further argued that private players must have an important role in the protection of biological diversity. In this context, the importance of public–private partnerships in addition to individual company efforts was emphasized. Private lands must be included in biodiversity protection strategies to bring more ownership to the entire process than there would be with the public land. Therefore, incentive schemes like stewardship incentive program and tax incentives could be used to entice individuals to work to conserve biodiversity. The Millennium Ecosystem Assessment (MEA) presents a concrete account of biodiversity loss and ecosystem degradation (Millennium Ecosystem Assessment Citation2005). The TEEB (Citation2010) also analyzed the business leaders' growing concerns about the risk of biodiversity loss and the requirements for preserving ecological limits.
Martens et al. (Citation2003) identified declining biodiversity to be not only an environmental problem but also a socioeconomic problem. Hence, the preservation of biodiversity requires that industries' and consumers' production patterns change. The TEEB for Business (Chapter 2, 2010) discussed the interconnections between business and biodiversity that are highly influenced by consumer preferences. A recent survey of over 13,000 individuals further supports that idea. Eighty-two percent of Latin American consumers were more concerned, followed by 56% in Asia, 49% in the United States, and 48% in Europe. The demand for products that are ecologically certified by the Forest Stewardship Council (FSC) and the Marine Stewardship Council (MSC), as well as the demand for Rainforest Alliance certified coffee, supports these findings. For branded fast-moving consumer goods, eco-labeling is moving from niche to mainstream markets. Examples include Domtar (FSC-certified product), Mars (Rainforest Alliance cocoa), Cadbury (Fairtrade cocoa), and Unilever (Rainforest Alliance PG Tips). Wal-Mart now scores its suppliers based on their concern for the protection of biodiversity and natural resources and uses eco-labels for all of its brands. Cosmetics companies such as Natura and L'Oreal have adopted the sustainable use of biodiversity as the main driver of innovation and the aim to use plant-based ingredients in the manufacturing of their products. Essentially, the TEEB for Business (Chapter 2, 2010) showed the general impact and dependence on biodiversity and ecosystem services across several business sectors.
Doremus (Citation2003) suggested a policy portfolio approach to protecting biodiversity on private lands. In the United States, more than 90% of the listed endangered and threatened species maintain their habitat on private lands, and approximately two-thirds of these species depend on these lands for the majority of their habitat (U.S. General Accounting Office Citation1995; Groves et al. Citation2000). However, biodiversity protection for privately owned lands has always been problematic. No particular policy measure is perfect. Rather, a broad spectrum of conservation options is more likely to be effective. The optimal portfolio of policies may combine state and private actions.
The participation of private actors is only possible under specific conditions. According to Olson's theory (Olson Citation1965), rational self-interested individuals will not act in the interest of the group because individual costs exceed individual benefits. Without selective incentives to motivate participation, collective action is unlikely, even by large groups of people with common interests. Because biodiversity protection may not provide an immediate economic gain, an external regulatory force is necessary (e.g., a civil society such as Global Action Network) to solve the collective action problem. Thus, civil society's role in conservation and biodiversity policies is important (Glasbergen Citation2010). A range of public policy measures like green development finance (GDF) and payment for ecosystem services (PES) can increase the scale of biodiversity and ecosystem conservation services to generate more business opportunities. Such measures can be defined as a voluntary transaction where a well-defined ecosystem service or land use policy is likely to be secured while the service is purchased by at least one buyer from at least one provider (Wunder Citation2005), access and benefit sharing, tax incentives, and performance standards among other benefits (TEEB for Business, Chapter 5, 2010). Generally, neither the government nor the private sector includes the protection of biodiversity and ecosystem services in its financial accounting and reporting. The World Business Council for Sustainable Development (WBCSD) is currently working on this limitation.
The discussion above is based on the existing literature, which provides important information on the private sectors' role and is of potential importance in terms of conserving biodiversity and ecosystems on the earth. The importance of private sectors' role in terms of financial support, which is the key for the success of these conservation activities, is also discussed. This is an important issue because biodiversity protection requires significant financial support that is contingent on active private sector participation. Although the existing literatures focus on the private sector's concern for biodiversity protection and make policy recommendations for the same, there is a gap of business sectoral analysis in the context of biodiversity and ecosystem conservation. It is so far understood that business and biodiversity have a causal relationship, but its functioning and complicacy are yet to be revealed. This study attempts to bridge the gap between the general understanding of the relationship of business and biodiversity and the business sector-specific relationship, which are assumed to be different for every sector. Within this context, this article first assesses the involvement of Fortune 500 companies in biodiversity protection with respect to the clarity of their policies regarding biodiversity and their contributions toward achieving the targets set by CBD. Section 2 discusses existing works on business and biodiversity that distinguish this study. Section 3 explains the data and methodological issues. Section 4 presents this study's findings and Section 5 analyzes related policy issues where we show how several policy recommendations regarding biodiversity protection may be incorporated effectively in long-term business strategies.
We believe that this study will benefit policy makers and the private sector. Although the private sector is increasingly funding a number of ecosystem services, particularly carbon sequestration, little is known about the potential willingness of this sector to fund other ecosystem services, such as biodiversity conservation (Waage Citation2007). Our research aims to address this knowledge gap. By indicating the leading Fortune 500 companies' concerns about the protection of biodiversity and ecosystem services, this study can help policy makers and the private sector with their future environmental protection activities.
Data and methodology
This study primarily collected data and information on companies' biodiversity policies from the major 500 US companies mentioned under the Year 2007 Forbes Fortune 500 list (Cable News Network Citation2007). Selection of companies is done following the Fortune 500 list published by the Fortune magazine. All 500 companies were selected for this study in the first stage. Next, a classification was done based on their respective business categories. We thoroughly analyzed the contents of these companies' CSR report, sustainability report, and/or annual reports (depending on the availability from each company's website) to determine whether the companies have specific biodiversity policies.
Data structure and definitions
In this study, whether a firm has a specific biodiversity policy depends on the clarity of biodiversity protection reporting in the CSR report, sustainability report, and annual report. Firms that lack such specific reporting but still conduct several similar activities funded by NGOs/nonprofit organizations (NPOs) are not considered to have specific biodiversity policies. Many companies with specific policies related to various ecosystem services such as water resource protection but without a description of specific biodiversity policies were also not considered to have specific biodiversity policies.
During the first step of the assessment, we analyzed the top 500 companies listed in the April 30, 2007 issue of Fortune magazine published online by Cable News Network (2007).Footnote 3 We analyzed the various biodiversity protection initiatives reported in the publications of these companies, including annual reports, CSR reports, environmental assessment reports, and environmental impact assessment reports. Our main purpose was to identify the companies' ongoing and overall activities related to biodiversity. Finally, our analysis has considered whether a company has its specific biodiversity policy based on its direct reporting on biodiversity protection or not. Also, related activities under any of its direct action plan have been checked while no indirect action for biodiversity protection was considered. For example, several companies have specific policies related to various ecosystem services such as water resource protection; when a company does not have any policies directly related to biodiversity, we did not consider it to have a biodiversity policy. To avoid double counting and overlapping with other policies, we considered only the directly mentioned policies.
The top 500 companies were selected based on their annual revenue generation (in USD) in the 2007 fiscal year. First, we obtained all 500 companies' biodiversity-related policy actions on a binary response (i.e., ‘yes’/ ‘no’) basis. This initial screening revealed two sets of companies: those with and those without biodiversity-related policies. Next, we categorized all companies into 74 sectors consistent with the Fortune magazine classification (see Annex-I for the detailed sector list). For each sector, we calculated the percentage of companies with direct biodiversity policies. This percentage indicates how many companies of a particular sector are concerned with biodiversity issues. We call this a measure of a company's biodiversity policy responsiveness. Sectors were ranked from 1 to 74 based on these percentage figures and on the annual revenue generation of the companies provided by the Fortune 500 list.
Classification of the companies
The Fortune 500 is a list compiled by Fortune magazine ranking the top 500 public corporations of the United States as measured by their gross revenue adjusted to their excise duty payment. Based on North American Industry Classification System (NAICS), Fortune 500 list inherently became categorized like manufacturing, utilities, finance and banking, and retail. It was estimated that manufacturing, finance, retail, and utilities are put together comprising around 70% of the total 500 companies in the list. Further World Economic Forum (WEF), for the convenience of analysis of the business sector and their impact on environment, categorized the remaining 30% of the companies with four additional categories like consumer goods, consumer services, health care, and technology and business services. Therefore, in total, Fortune 500 companies got eight major categories. However, we further created subcategories of the 500 businesses following a combined sector definition of NAICS and WEF for the purpose of detailed assessment. We created 74 subcategories of companies spread over eight major sectors. Each subcategory was thus unique in business nature and mutually exclusive to each other. Such exclusivity was necessary to provide independence to the result obtained in the process of our analysis.
Results
In this section, we first describe the classification of the 500-odd companies under the broad categories of business activities along with their corresponding activities related to the biodiversity and ecosystem conservation and protection and certain important percentage indicators. Second, we discuss the relationship between various indicators of biodiversity policy adoption. Finally, we discuss the causal relationship between business risks, business revenue, and biodiversity policy adoption under different business categories among the Fortune 500 companies.
Sectoral classification and characteristics of the Fortune 500 companies in terms of biodiversity policies
We aggregated the 74 sectors into eight major sectoral business categories based on the WEF report on business and biodiversity (WEF Citation2010). shows the behavior of the primary and utility sectors in terms of percentage of companies that report their biodiversity policies under each sector category and percentage among the total 500 companies. The last column describes the reasons for adoption and non-adoption of biodiversity protection policy. further demonstrates that almost all the companies under the primary and utility sectors have certain biodiversity policy in place.
Table 1. Assessment of primary and utility sectors' biodiversity policy
shows the behavior of the consumer sectors in terms of percentage of companies that report their biodiversity policies under each sector category and percentage among the total 500 companies in the context of biodiversity policy adoption. There are two major categories of businesses: consumer goods and consumer services. Almost all the companies in the consumer goods sector have their own biodiversity protection policy. However, a few companies in the consumer services sector have an own biodiversity policy. This could be attributed to their respective business nature of having no or very limited interaction with the nature and environment directly.
Table 2. Assessment of consumer sectors' biodiversity policy
shows the behavior of the industrial sector in terms of percentage of companies that report their biodiversity policies under each sector category and percentage among the total 500 companies in the context of biodiversity policy adoption. Unlike the consumer services sector, the industry sector has much more biodiversity protection policies, as the majority of the companies listed under this category have direct interaction with the environment. A few cases have been noticed in this category, such as real estate companies. They are still ‘nonstarters’ in terms of adopting any biodiversity protection policy, although they have direct impact on land and land use change and its corresponding effect on environment and local ecology.
Table 3. Assessment of industrial sector's biodiversity policy
shows the behavior of the service sector in terms of percentage of companies that report their biodiversity policies under each sector category and percentage among the total 500 companies in the context of biodiversity policy adoption. The service sector includes the health care, financial, and technology and business service. As a matter of fact, the financial sector has much wider environmental policies including biodiversity protection compared to the other two sectors. Technology and business service sector and the healthcare sector are not that progressive to adopt biodiversity protection policy that could be attributed to their business nature that is not directly involved with the environment and ecology.
Table 4. Assessment of service sector's biodiversity policy
Assessment of the Fortune 500 companies' biodiversity policy responsiveness
We discussed earlier that most of the Fortune 500 companies do not systematically record their activities regarding biodiversity conservation and mitigation; therefore, collecting information on biodiversity-related investments was difficult. These data limitations therefore prompted the use of revenue as a normative indicator of the companies' expected behavior. We assumed that if the company has higher revenues, it is expected that it would be well organized in all of its planning and policies including the policies related to biodiversity. Ciocirlan and Pettersson (Citation2012) and Ahmad et al. (Citation2003) also argued that there is some positive correlation between revenue and companies' decision-making process toward environmental protection. The assumption informing this logic is that higher revenue corresponds to a greater likelihood of working seriously on issues related to biodiversity and ecosystem services. Hence, revenue has been considered as one of the indicators in the study.
The Fortune 500 companies' annual and CSR reports rarely mentioned monetary investments that were specifically for biodiversity protection. Mainly, we obtain the overall investment amount for the purpose of overall environmental protection purposes including usage of renewable energy, water resource reservation, climate change, and ecosystem services, among others. In some cases, separate investment components are mentioned for climate change protection but not for biodiversity protection. In addition, we used the companies' revenue data mainly to determine a company's economic position and to rank the companies financially. We study the companies' policies and activities regarding the biodiversity protection separately. In this respect, the companies' revenues and contributions toward biodiversity protection are unrelated.
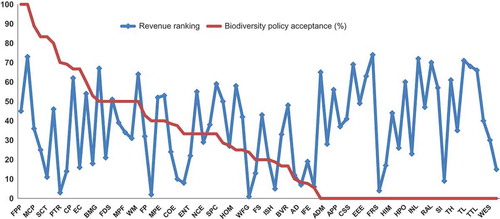
indicates the link between the companies' revenues and their activities in relation to biodiversity protection. Our initial assessment shows that company-wide acceptance of biodiversity policies is heterogeneous, although nearly all Fortune 500 companies maintain a global presence that is as broad as their geographical operational presence. The companies' revenues are critical in determining the relative ranking on the Fortune 500 list. We hypothesize that such a revenue ranking method would influence the companies' responsible behavior toward society and the environment. The incorporation of a proper biodiversity protection policy in the overall corporate policy is one indicator for such behavior. Our results show that the correlation between revenue ranking and biodiversity policy adoption is 0.42, which indicates that high-revenue-earning companies on the Fortune 500 list are not necessarily concerned about their biodiversity impact and corresponding measures. illustrates the relative ranking of different subsectors based on their revenue, acceptance of biodiversity policies, and the percentage of companies within a sector with specific biodiversity policies.
Figure 1. Comparative ranking of revenue and percentage of biodiversity policy acceptance of the Fortune 500 companies. FPP, Forest and Paper Products; MCP, Mining and Crude Oil Production; SCT, Securities; PTR, Petroleum Refining; CP, Computer Peripherals; EC, Engineering and Construction; BMG, Building Materials and Glass; FDC, Financial Data Services; MPF, Mail, Package, and Freight Delivery; WM, Waste Management; FP, Food Production; MPE, Medical Products and Equipment; COE, Computers and Office Equipment; ENT, Entertainment; NCE, Network and Other Communications Equipment; SPC, Scientific, Photo, and Control Equipment; HOM, Homebuilders; WFG, Wholesalers: Food and Grocery; FS, Food Services; ISH, Insurance: Life, Health (stock); BVR, Beverages; AD, Aerospace and Defense; IFE, Industrial and Farm Equipment; ADM, Advertising, Marketing; APP, Apparel; CSS, Computer Software; EEE, Electronics and Electrical Equipment; FRS, Furniture; HIM, Health Care: Insurance and Managed Care; HPO, Health Care: Pharmacy and Other Services; INL, Insurance: Life, Health (mutual); RAL, Railroads; SI, Savings Institutions; TH, Temporary Help; TL, Transportation and Logistics; TTL, Trucking and Truck Leasing; WHS, Wholesalers: Health Care.
Comparison of risk, revenue, and mitigation policy measures of the Fortune 500 companies and their biodiversity conservation policies
In this section, we first analyze the activities and reporting schemes of the major companies within each sector from , mainly to identify the current status of their biodiversity risk exposure. We also analyze the companies by sector according to their revenue and specific adoption of biodiversity-related policies. Therefore, we consider mainly those companies that have the highest revenues in their sector and specific biodiversity-related policies. We discuss a few well-known companies that may not have a specific biodiversity policy but are involved in unique biodiversity conservation activities, for example, McDonald's (consumer services sector) marketing strategy. The sectors discussed below were sequentially selected according to their sector biodiversity policy adaptation ranking.
Utilities
In the utility sector (electricity/gas/water), the business risks from biodiversity loss are ranked 2 (out of 6), and approximately 70% of the companies have specific biodiversity policies. This sector is ranked first in biodiversity policy acceptance, eighth in revenue, and second in biodiversity risk. These rankings indicate that the utility sector, although low in revenue, is highly active in adopting protective measures because of its high risk of exposure to biodiversity loss. In this sector, the highest ranked company is Dominion Resources. They have a clear biodiversity policy with specific measures for aquatic life protection, avian protection, rare plant protection, and wildlife protection. Another high earning company, Southern, promotes the biodiversity conservation of its own land and partners with others in programs including Power of Flight, Longleaf Legacy, and Five Star Restoration. Edison International specifies a clear biodiversity policy for vegetation and an integrated pest management plan. Pepco Holding's biodiversity policy includes wetland delineation, threatened and endangered species identification, forest stand delineation, oyster bed and essential fish habitat assessments, and an aquatic survey.
Primary industries
Approximately 90% of companies in the Mining and Crude Oil Production (MCP) sector report their biodiversity protection activities and policies in their CSR report. For example, Occidental Petroleum clearly mentions its biodiversity and habitat preservation policy and goals and Apache notes its conservation policy for wetland and wildlife. Seventy percent of Petroleum Refining (PR) companies report their biodiversity policies. ExxonMobil, which is a highly ranked company in terms of revenue, claims that their sites incorporate biodiversity protection to limit the impact on sensitive areas. Their mitigation actions include participating in initiatives to enhance the wildlife and habitat attributes of their properties as well as modifying engineering design, construction, and operating practices to protect particular species and sensitive habitats. Marathon Oil is certified by the Wildlife Habitat Council.
Fifty-two percent of chemical companies and 50% of metal companies report their biodiversity protection activities and policies in their CSR report. For example, Alcoa's biodiversity policy states that the successful operation of their mines, even in sensitive native ecosystems, must avoid any impact on protected species and should follow targeted values to reestablish complex ecosystems. Although the top chemical company Dow Chemicals invests in various biodiversity protection activities, it offers no declarations of biodiversity policies in its CSR report. PPG Industries has a biodiversity policy for wildlife protection activities, whereas Ashland mentions a biodiversity policy for waterbodies.
Among all the energy companies, 38.5% report their biodiversity policies. For example, Constellation Energy and the Baltimore Gas and Electric Company (BGE) are collaborating to apply an Integrative Vegetation Management approach to their sites. The site involves the targeted use of environmentally benign herbicides to remove tall-growing, woody vegetation; in addition to complying with reliability requirements, this biodiversity policy reduces competition from invasive and undesirable plants that crowd out native and more beneficial plants.
Consumer goods
Approximately 40% of companies in the Food Production (FP) sector clearly report their biodiversity policies, especially in CSR reports. In this sector, the company that generates the highest revenue, Archer Daniels Midland, is working to create a sustainable supply chain for palm oil in which one criterion is species conservation. However, this company only has general biodiversity policies for palm oil and soy production. Tyson Foods, which lacks business activities in or adjacent to legally protected biodiversity hot spots, does not describe its policy and activities related to biodiversity.
Among Food Consumer Products (FCP) companies, approximately 50% have biodiversity policies. Major companies in this sector such as PepsiCo, Sara Lee, General Mills, and Kellogg include biodiversity policies for their agricultural supply chain initiatives. Sara Lee implements a biodiversity policy mainly in its coffee production and enhances the global multi-stakeholder initiative that functions to increase the sustainability in the mainstream coffee sector. General Mills commits to responsibly sourcing palm oil by ensuring that its purchases are not associated with rainforest deforestation. In contrast, a few companies such as Hershey have no formal program or strategy for managing their biodiversity impacts and claim that they presently do not significantly impact biodiversity levels.
Approximately 80% of Household and Personal Products (HPP) companies have specific biodiversity policies. Major companies including P&G, Kimberly–Clark, Colgate-Palmolive, and Avon Products consider biodiversity to be an important environmental indicator of their business operations. Avon Products and Kimberley–Clark clearly report their biodiversity indicators in their global reporting initiative (GRI). In its CSR report, Avon Products declares its full support for forest management practices that protect biodiversity and ecosystem integrity, whereas Kimberly–Clark mentions its activities on habitat protection and restoration in the GRI.
Only 16% of beverage companies have biodiversity protection policies. Pepsi Bottling is the only company that mentions biodiversity policy in its sustainable agriculture principles. Only 18% of Motor Vehicles and Parts (MVP) manufacturing companies have specific biodiversity policies. Among them, only General Motors indicates its volunteer-based efforts to preserve its community's biodiversity.
Companies in the Forest and Paper Products (FPP) sector have specific biodiversity policies. For example, International Paper, Weyerhaeuser, and Boise Cascade Holdings hold certifications for forest management. These include fiber procurement, chain of custody certification such as FSC, the Sustainable Forestry Initiative (SFI), the Brazilian forest certification standard (Cerflor), and the American Tree Farming System (ATFS) certification. In their paper procurement policy, most of these companies seek biodiversity-certified companies throughout the supply chain and are engaged in various biodiversity-related activities such as the conservation of biodiversity hot spots, major tropical wilderness areas, and threatened and endangered species.
The miscellaneous sector contains three Fortune 500 companies, and only one company, 3M, mentions its biodiversity policy; it claims that preserving and enhancing biodiversity constitutes an important aspect of its environmental sustainability strategy. In addition to activities such as maintaining and protecting sustainable forest land and preserving water quality in critical areas, 3M's main concern is to create and fund ‘new ways to keep wild areas wild.’
In subsectors such as Furniture, Apparel, and Home Equipment and Furnishings (HEF) industries, no companies have policies related to biodiversity and ecosystems, probably because they create less impact on biodiversity and are affected less by changes in biodiversity.
In the Building Materials and Glass (BMG) sector, only one company, Owens Corning, has a specific policy related to biodiversity. When Owens Corning evaluates potential properties and operations for acquisition purposes, environmental consultants review the potential property and surrounding areas to assess existing environmental damage. These include biodiversity loss and stressed vegetation. When selecting operational sites, they consider world heritage and biosphere sites, including forests, mountains, lakes, deserts, monuments, buildings, and cities considered by United Nations Educational Scientific and Cultural Organization (UNESCO) to be of special cultural or physical significance.
In the Toys and Sporting Goods (TSG) sector, only Mattel clearly mentions a biodiversity policy, primarily for paper procurement.
Industrial
The industrial sector (construction and aerospace components) ranks fourth in terms of the risk from biodiversity loss: 27.8% of the companies report their biodiversity policies and activities. This sector ranks fifth in terms of revenue generation. In this sector, subsectors such as Wholesalers: Electronics and Office Equipment (WOE), Railroads, Electronics and Electrical Equipment (EEE), Transportation Equipment (TE), and Real Estate (RE) have 0% biodiversity policy acceptance. In the homebuilders' category, 27.3% of companies report their biodiversity concern and policies; for example, Lennar mentions the preservation and enhancement of wetlands and wildlife habitat in its CSR report.
In the Oil and Gas Equipment and Services (OGE) subsector, 80% of the companies have environmental policies related to biodiversity. Baker Hughes mentions its biodiversity policy and action plan in relation to its GRI report on sustainable technology and environment protection.
In the Computer Peripherals (CP) subsector, 66.7% of companies report their biodiversity protection policy. Although companies such as EMC claim that their impact on biodiversity is largely indirect, they also claim to use a systems approach to environmental sustainability (including biodiversity) to drive their business.
Sixty companies in the Engineering and Construction (EC) subsector report their biodiversity policies. In adopting sustainability as a goal, Fluor, the top EC company, uses the ‘Triple Bottom Line’ model, which considers the protection of wildlife habitats and biodiversity as environmental stewardship.
In the Scientific, Photo, and Control Equipment (SPC) subsector, one of the three companies (33.3%), Eastman Kodak, reports a biodiversity and natural habitat policy. In the Medical Products and Equipment (MPE) subsector, two out of five companies (40%) report a biodiversity activity and policy in their CSR reports. In addition, 33.3% of pipelines manufacturing companies and 42.9% of Semiconductors and Other Electronic Components (SEC) manufacturing companies report their biodiversity policies.
In the Aerospace and Defense (AD) subsector, only 1 of the 10 topmost companies, Boeing, has a biodiversity policy in its CSR report, which pledges to consider only renewable fuel sources that have a minimal biodiversity impact. In the Computers and Office Equipment (COE) category and in the Network and Other Communications Equipment (NCE) category, 37.5% and 33.3% of the companies, respectively, report their biodiversity consciousness and policies. In the Industrial and Farm Equipment (IFE) category, only 7% of the companies, that is, Deere, mentions a concern for biodiversity protection.
Financial institution
Approximately 83% of the securities companies (five of six) report their biodiversity consciousness and policies in their CSR or sustainability reports. Goldman Sachs uses biodiversity policies for a major service related to market-based solutions for environmental issues. Morgan Stanley expresses concern about diversity, probably because its environmental policy statement is developed by its major business units in consultation with external stakeholders.
Although companies in the Insurance: Life and Health (mutual) (ILHM) category did not report their policies related to biodiversity protection, one of the two Insurance: P & C (mutual) (IPCM) companies, State Farm Insurance, mentions biodiversity and ecosystem protection concerns in the environmental responsibility section of its CSR; State Farm states that its environmental responsibility covers conservation issues beyond land and wildlife and that it considers the preservation of biodiversity and fragile ecosystems to be integral to this responsibility.
Savings Institutions (SI) and Financial Data Services (FDS) companies do not report these issues but may be considering their indirect impact. One of 18 (i.e., 5.6%) Insurance: P & C (stock) (IPCS) companies and 2 out of 10 (i.e., 20%) Insurance: Life and Health (stock) (ILHS) companies report their biodiversity-related concerns and policies. For example, the ILHS company MetLife reports its biodiversity policy and its biodiversity protection activities for the New York Botanical Garden.
Among Diversified Financials (DF) companies and Commercial Banks (CB), 33.3% and 23.8%, respectively, report their biodiversity policies. The commercial bank JPMorgan Chase reports its plantation and natural habitat protection policies and activities. Many commercial banks may not have specific biodiversity or ecosystem protection policies but mention biodiversity and forest conservation in their paper procurement policy.
Consumer services
In the consumer services sector, biodiversity risk ranks fifth, aggregated biodiversity policy acceptance ranks sixth, and aggregated revenue generation ranks third. Companies in the General Merchandiser (GM), Airline, Automotive Retailing and Services (ARS), Wholesalers: Diversified (WD), Temporary Help (TH), Transportation and Logistics (TL), and Trucking and Truck Leasing (TTL) subsectors do not report their biodiversity consciousness or policies because they have no direct impact on biodiversity levels. In the Specialty Retailers (SR) subsector, only 8.3% of companies have biodiversity policies, which primarily relate to their forestry policy and paper and wood procurement policy.
In the Food and Drug Stores (FD) subsector, 20% of companies report their biodiversity policies. For example, through research and engagement with the relevant stakeholders in the food industry, Safeway adopts a biodiversity protection policy for food standards. In addition, 33.3% of entertainment companies report their biodiversity protection policies. Time Warner relates its biodiversity policy mainly to forest management policy by supporting suppliers with proper forest certification. One out of two (50%) Mail, Package, and Freight Delivery (MPF) companies, FedEx reports its biodiversity concern and policies, particularly in relation to reforestation.
Among the Packaging and Containers (PC) companies, 28.6% report their biodiversity policies. The topmost company, Smurfit-Stone Container, reports its biodiversity policies in relation to sustainable forestry; 25% of Wholesalers: Food and Grocery (WFG) companies and 50% of Food Services (FS) companies report their biodiversity policies. The well-known food services company, McDonald's, may not have direct biodiversity or forestry policies, but its ‘Endangered Animals Happy Meal’ effectively relates marketing to biodiversity. The food services company Starbucks' has a biodiversity policy for coffee production with organic and traditional shade-growing agricultural methods that protect the forest's birds and biodiversity.Footnote 4
In the Hotels, Casinos, and Resorts (HCR) subsector 40% of the companies report their biodiversity policies. Hotel Marriott International has clear policies on biodiversity protection primarily in terms of forest management, as it considers rain forest preservation to be an important policy. Twenty-five percent of Publishing and Printing (PP) companies and 50% of Waste Management (WM) companies report their biodiversity policies. For the publishing and printing company R.R. Donnelley & Sons, biodiversity conservation and forest ecosystem protection constitute one of their sustainability principles. The waste management company Allied Waste Industries' biodiversity-related policies and activities concern wildlife habitat and wetland habitat conservation.
Health care
In the healthcare sector (pharmaceuticals, biotechnology, and healthcare providers), the risk of biodiversity loss and revenue generation ranks third and sixth, respectively. Only 13.3% of the sector, however, expresses a clear biodiversity policy, and only pharmaceutical companies clearly report their biodiversity policies and activities. Companies from the Wholesalers: Health Care (WHC), Health Care: Insurance and Managed Care (HIM), Health Care: Pharmacy and Other Services (HPO), and health Care: Medical Facilities (HMF) subsectors do not have specific policies regarding biodiversity. The topmost pharmaceutical companies such as Johnson & Johnson are considerably active in biodiversity protection; Johnson & Johnson specifies that it has more than 55 conservation projects under way around the world, and 66% of these aim to enhance or conserve off-site biodiversity. Some major pharmaceutical companies, such as Pfizer and Wyeth (now Pfizer), include biodiversity protection in their water policy.
Technology and business services
In technology and business services sector, business risks due to biodiversity loss is the lowest (rank 6) among the sectors discussed, whereas revenue generation rank is 7 and only 5.2% companies in these sector have clear biodiversity policy.
The Advertising and Marketing (AM), Telecommunications, Computer Software (CS), Diversified Outsourcing (DO), and Payroll Services (PS) sectors have no biodiversity policies or protection activities. In the Information Technology Services (IT) subsector, only one of two companies (20%), Affiliated Computer Services (a Xerox company), mentions a biodiversity policy, which is mainly incorporated into its forest policy. In the Internet Services and Retailing (ISR) subsector, only one of six companies (16.7%), Google, mentions its biodiversity concerns and policies.
Comparison of revenue, risk, and action among the Fortune 500 companies
To analyze the companies' biodiversity-related policies within each sector, we first identified the companies' risk perception in terms of business activities and then converted them into risk profiles based on risk characteristics. This analysis provides 12 different types of risk that a company can face when their operations negatively impact biodiversity and ecosystems. During the content analysis of the individual companies' policies, we determined that companies mainly attempt to conceal these risks. In most cases, the policies appear to focus narrowly on immediate targets. Based on the 12-category risk spectrum, we have identified the level of risk exposure for each sector (TEEB Report for Business Citation2010 (Chapter 4), Economic Evaluation of Environmental Impacts of Asian Development Bank) and compared risk profiles with respective revenue and biodiversity policy adoption rankings.
shows the correlations between the three indicators used in this study, that is, the biodiversity risk ranking, revenue ranking, and biodiversity policy acceptance ranking. We have eight sectors (mining, electricity, and financial among others) and three indicators like company revenue, risk related to biodiversity loss, and biodiversity policy adoption. For the revenue, higher the rank number is higher the earning of companies. In context of risk, higher the rank number indicates that the sector is highly exposed to the risk related to the loss of biodiversity. Similarly, for the indicator of policy adoption, higher the rank number means sector is highly aware of the importance of biodiversity and taking necessary actions to protect biodiversity by taking company level policies and vice versa. Since there is no single indicator or index to measure the companies in the context of biodiversity impact, we have to create certain parameters that are most likely indicating the targeted performance of the companies.
Figure 2. Comparison between business risk due to biodiversity loss, policy acceptance, and Fortune 500 revenue rank.
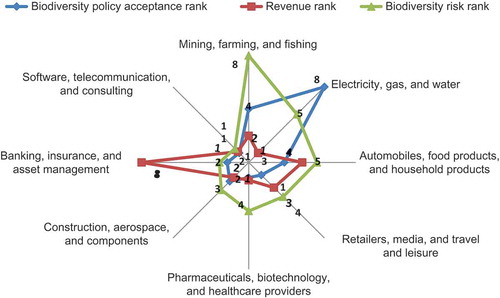
The financial sector, which includes banks and insurance companies, has the highest revenue levels. Although this sector demonstrates considerably low levels of biodiversity-related policy adoption, it also has lower levels of risk related to biodiversity loss. Furthermore, the utility sector, which includes electricity, water and gas companies, has the lowest revenue levels but is ranked high in the areas of risk related to biodiversity loss and the adoption of specific biodiversity mitigation policies. Thus, these indicators exhibit little or no correlation. Using these rank and risk characteristics for the eight different sectors, we analyzed each sector in terms of its risk of biodiversity loss, economic performance, and level of biodiversity protection policy acceptance.
Discussion and conclusion
This study illustrates that in most cases, biodiversity loss and its related risks to businesses are not fully addressed by company policies. Therefore, despite bearing high levels of biodiversity risk exposure and related business risks, companies have yet to adopt specific biodiversity policies for day-to-day activities. A clear gap is found in the lack of a proper assessment tool for estimating the impact of biodiversity losses in terms of financial, social, and environmental measures. Unless companies are aware of their economic impact on the loss of biodiversity and understand the benefits of risk-mitigating measures in terms of finance or reputation, the companies are highly unlikely to seriously address biodiversity. It has been reported by the WEF that globally only 27% of the companies are somewhat concerned about the loss of biodiversity and its related impact on the business. The major reason of such poor response is found to be very slow impact of biodiversity loss on business activities (WEF 2010).
In contrast to the responses related to climate change, those related to biodiversity loss are not significant relative to the scale of business operations. However, the increased expression of concern by the companies for wildlife protection activities and related ecosystem conservation issues indicates an improved general awareness of these issues. In most cases, the companies' biodiversity policies are concealed within general environmental protection measures and CSR activities; as a result, these actions lack the systematic organization that can benefit companies and their consumers. The results of our study indicate that companies that directly generate biodiversity loss are more likely to formally specify their concern for biodiversity through reporting. This effect is probably a consequence of the public perception of company liability. Our analysis of company reports and published documents reveals a clear lack of direction and commitment to addressing the problem of biodiversity loss. In fact, the reporting of biodiversity-related activities is rare even in the GRI guidelines, which exacerbate the impact of biodiversity loss globally. In the Economics of Ecosystems and Biodiversity report 2010, it has been further mentioned that the companies having direct interaction with the ecosystems like tobacco, food, and beverage companies are more proactive in the biodiversity conservation and protection measures (TEEB Citation2010).
In summary, the major findings are as follows:
| 1. | Companies' revenue profiles do not significantly affect their acceptance of specific biodiversity-related policies. Large companies thus have yet to act responsibly with respect to biodiversity protection. | ||||
| 2. | Companies' business activity profiles significantly influence their decisions to adopt biodiversity protection policy and measures. Therefore, unless companies consider the impact of biodiversity loss on their business activities, it may be difficult to encourage them to adopt mitigation actions. | ||||
| 3. | Companies' business risk profiles might influence their acceptance of biodiversity-related policies, although minimal initiative has been taken. | ||||
This study shows that companies in the utility sector, which bears a high operational impact on ecosystems, rank high in the adoption of specific biodiversity mitigation policies despite generating low revenues. In the meantime, the financial sector ranks lower on the biodiversity protection policy adoption and the risk of biodiversity loss, even though it generates high revenues. In primary industries, the revenue generation is lower, but the risk of biodiversity loss, and thus the rate biodiversity mitigation policy adoption, is comparatively higher.
However, most Fortune 500 companies with direct biodiversity-related policies prefer mitigation hierarchy measures that are cost-effective, less tedious, and easy to understand and implement. Practices designed to reduce the impact of business development on biodiversity are known as compensatory mitigation (Madsen et al. Citation2010). Few countries are in the early stages of the adoption or investigation of compensatory mitigation. But in most geographical regions, compensatory mitigation is developed or developing around different economic, political, institutional, and cultural circumstances that give rise to a variety of programs (Madsen et al. Citation2010). However, no corresponding frameworks are available to guide business sectors in setting up such a mitigation hierarchy. Consequently, we recommend a three-step approach for preparing a sector-specific mitigation hierarchy framework to assess and mitigate the damage caused by ecosystem and biodiversity losses. Initially, such a framework at the level of the sector rather than the company will be important because more detailed information and data are required for a company-specific framework. Such a sector-specific framework can be developed by companies within a particular sector by collecting the relevant preparatory information.
| Step I: | = |
Prepare a revenue risk profile for all member companies within the sector to reflect the current and future positions based on various external factors such as market risk and regulatory risk. |
| Step II: | = |
Prepare the sector's business process risk profile based on a life cycle assessment, which will identify potential sources or causes of biodiversity and ecosystem losses. This step can also factor in future technological changes, which might alter companies' business processes and activity profiles and their corresponding impact. |
| Step III: | = |
Prepare a detailed sector-wide business risk mapping based on market research, which should be linked to each step of the business process. For example, if pesticides are a significant source or cause of biodiversity loss for a particular sector, then all sources of pesticides in all business activities should be consolidated and mapped against the nature of their risk impact, for example, reduced productivity. |
A limitation of this article is our lack of attention to the details concerning the companies' actual implementation of work related to ecosystem services and biodiversity protection; we are thus unable to surmise much beyond popular reporting. In addition, we primarily used publicly available information and data to evaluate the companies' policies for combating biodiversity-related losses; our results are thus indicative rather than definitive in nature. Future research can examine each company's activities in greater detail.
Notes
1. Food and Agriculture Organization (FAO) reported that since 1900 more than 75% of the total global plant genetic diversity has been lost. (The Second Report on the State of the World's Plant Genetic Resources for Food and Agriculture 2010.)
2. Previous studies identified the potential burdens and stressors to water and land created by the different sectors in various stages of their life cycles (Asian Development Bank Citation1997). Businesses create emissions during various stages of their life cycle that potentially impact biodiversity. However, to prepare the life cycle analysis of these industries, more significant efforts could be made to apply sustainability accounting using fieldwork and case-oriented research methods (Lamberton Citation2005).
3. The revenue ranking is based on 2007 because only figures for that year were available online (accessed October 2010) during the course of this research. However, these rankings have not changed much between 2007 and 2010 (the ranking correlation for the 2 years is 0.987), so our data are sufficiently up to date. The company websites were accessed in October 2010.
4. Studies show that species richness of all ants and birds and of forest ant and bird species are lower in most coffee agro ecosystems (where intensified coffee management process is followed) than in natural forests. But rustic coffee that is grown under native forest canopies/natural shade trees have equal or greater ant and bird richness than nearby forests. Thus, rustic coffee production is better for maintaining biodiversity level (Philpott et al. Citation2008) (http://www.ncbi.nlm.nih.gov/pubmed/18759777). Starbucks is also adopting biodiversity policies to follow traditional rustic coffee production system that utilizes native forest canopies, and in these ways, they are trying to decrease biodiversity loss.
References
- Ahmad , J , O'Regan , N and Ghobadian , A. 2003 . Managing for performance: corporate responsibility and internal stakeholders . Int J Bus Perform Manag. , 5 ( 2/3 ) : 141 – 153 .
- Asian Development Bank . 1997 . Economic valuation of environmental impacts in Guidelines for the Economic Analysis of Projects , Manila , , Philippines : Asian Development Bank .
- Butchart , S , Walpole , M , Collen , B and Stien , A. 2010 . Global biodiversity: indicators of recent declines . Science , 328 ( 5982 ) : 1164 – 1168 .
- Cable News Network. 2007. A Time Warner Company. List of Fortune 500 companies in the United States; [cited 2010 Oct]. http://money.cnn.com/magazines/fortune/ (http://money.cnn.com/magazines/fortune/)
- Ciocirlan , C and Pettersson , C. 2012 . Does workforce diversity matter in the fight against climate change? an analysis of Fortune 500 companies . Corp Soc Responsib Environ Manag. , 19 ( 1 ) : 47 – 62 .
- [CBD] Convention on Biological Diversity . 1992 Jun 5 1992 . Article 2. United Nations Environment Program 1992 Jun 5 , Rio de Janeiro , , Brazil
- [CBD] Convention on Biological Diversity . 2012 . The statement of the Executive Secretary of the CBD on the occasion of the UNCTAD and BIOTRADE Congress Rio De Janeiro , , Brazil
- Doremus , H. 2003 . A policy portfolio approach to biodiversity protection on private lands . Environ Sci Policy. , 6 ( 3 ) : 217 – 232 .
- Dyke , J , Cash , S , Brody , S and Thornton , S. 2005 . Examining the role of the forest industry in collaborative ecosystem management: implications for corporate strategy . Corp Soc Responsib Environ Manag. , 12 ( 1 ) : 10 – 18 .
- [TEEB] The Economics of Ecosystems and Biodiversity . 2010 . The economics of ecosystems and biodiversity: mainstreaming the economics of nature – a synthesis of the approach, conclusions and recommendations of TEEB , Geneva , , Switzerland : United Nations Environment Program (UNEP). Report to congressional requesters .
- Food and Agriculture Organization . 2010 . The second report on the state of the world's plant genetic resources for food and agriculture , Rome , , Italy : Food and Agriculture Organization .
- Glasbergen , P. 2010 . Global action networks: agents for collective action . Glob Environ Change. , 20 ( 1 ) : 130 – 141 .
- Groves , CR , Kutner , LS , Storms , DM , Murray , MP , Scott , JM , Schafale , M , Weakley , AS and Pressey , RL. 2000 . “ Owning up to our responsibilities: who owns lands important for biodiversity? ” . In Precious heritage: the status of biodiversity in the United States , Edited by: Stein , BA , Kutner , LS and Adams , JS . 275 – 300 . Oxford , , UK : Oxford University Press .
- Gutman , P and Davidson , S. 2007 . “ A review of innovative international financial mechanisms for biodiversity conservation with a special focus on the international financing of developing countries’ protected areas ” . In World Wildlife Fund's Macroeconomics Program Office supported project , Washington , DC : WWF-MPO Program .
- Heller , EN and Zavaleta , E. 2009 . Biodiversity management in the face of climate change: a review of 22 years of recommendations . Biol Conserv. , 142 ( 1 ) : 14 – 32 .
- Lamberton , G. 2005 . Sustainability accounting – a brief history and conceptual framework . Account Forum. , 29 ( 1 ) : 7 – 26 .
- Madsen , B , Carroll , N and Moore , BK. 2010 . State of biodiversity markets report: offset and compensation programs worldwide , Washington , DC : Ecosystem Marketplace .
- Mahidhar , V , Giffi , C , Kambil , A and Alvanos , R. 2009 . Rethinking emerging market strategies: from off shoring to strategic expansion. A Deloitte Review (Issue 4) , Washington , DC : Deloitte Development LLC .
- Managi , S , ed. 2012 . The economics of biodiversity and ecosystem services , New York , NY : Routledge .
- Martens , P , Rotmans , J and Groot , D. 2003 . Biodiversity: luxury or necessity? . Glob Environ Change. , 13 ( 2003 ) : 75 – 81 .
- Metcalfe , J and Vorhies , F. 2010 . Exploring the case for a green development mechanism. Paper presented at: The International Workshop on Innovative Financial Mechanisms , Bonn , , Germany : Convention on Biological Diversity .
- Millennium Ecosystem Assessment . 2005 . Ecosystems and human well-being: biodiversity synthesis , Washington , DC : World Resource Institutes .
- Moran , D , Pearce , D and Wendelaar , A. 1996 . Global biodiversity priorities: a cost- effectiveness index for investments . Glob Environ Change. , 6 ( 2 ) : 103 – 119 .
- Olson , M. 1965 . The logic of collective action: public goods and the theory of groups , Boston , MA : Harvard University Press .
- Philpott , SM , Arendt , WJ , Armbrecht , I , Bichier , P , Diestch , TV , Gordon , C , Greenberg , R , Reynoso-Santos , R , Soto-Pinto , L Tejeda-Cruz , C . 2008 . Biodiversity loss in Latin American coffee landscapes: review of the evidence on ants, birds, and trees . Conserv Biol , 22 ( 5 ) : 1093 – 1105 .
- Rondinelli , DA and Berry , MA. 2000 . Environmental citizenship in multinational corporations: social responsibility and sustainable development . Eur Manag J. , 18 ( 1 ) : 70 – 84 .
- U.S. General Accounting Office . 1995 . Endangered species act: information on species protection on nonfederal lands , Washington , DC : General Accounting Office. Report to Congressional Requesters .
- Vickerman , S. 1999 . A state model for implementing stewardship incentives to conserve biodiversity and endangered species . Sci Total Environ. , 240 ( 1 ) : 41 – 50 .
- Waage , S. 2007 . Investing in the future: an assessment of private sector demand for engaging in markets & payments for ecosystem services , Rome , , Italy : UN Food and Agriculture Organization. PESAL papers Series No. 2 .
- Walpole , M , Almond , A , Besancon , C and Butchart , S. 2009 . Tracking progress toward the 2010 biodiversity target and beyond . Science. , 325 ( 5947 ) : 1503 – 1504 .
- [WEF] World Economic Forum . 2010 . “ Biodiverssity and business risk ” . In A briefing paper for participants engaged in biodiversity related discussions at the World Economic Forum Davos-Klosters Annual Meeting , Geneva , , Switzerland : World Economic Forum .
- Wunder , S. 2005 . Payments for environmental services: some nuts and bolts , Jakarta , , Indonesia : CIFOR . Occasional Paper No. 42.