
Abstract
Despite wetland conversion to intensive rice production Central Thailand remains a center for wetland biodiversity in Southern Asia. Fauna inhabiting rice fields (many species perform important ecosystem services) are, however, increasingly threatened by pesticide uses. In Ayutthaya and Ang Thong Provinces 40 conventionally and 31 organically managed farms were visited to investigate how abundance and diversity of aquatic fauna in rice fields relate to pesticide regimes. In the dry and wet seasons fields were surveyed for plankton, aquatic macro-invertebrates, fishes, and waterfowl. Using multivariate statistics pesticide variables and biophysical field parameters (determined in a previous study) were assessed as potential predictors of abundance/diversity of faunal groups. Effects of pesticide regimes on aquatic fauna were nontrivial. Phytoplankton was lowered under exposures to herbicides and natural insecticides. Zooplankton (except amoeboids) was unaffected or increased on pesticide-exposed fields, probably suffering lower predation. Biophysical aspects partly explained abundance/diversity of aquatic insects, but abundance/diversity was generally higher on fields treated with natural rather than synthetic insecticides. Fishes and waterfowl tended to be less abundant on fields exposed to synthetic insecticides and herbicides. Detailed findings may interest agro-ecologists, medical entomologists, and conservation biologists. Further research incorporating wider landscape aspects and including pesticide-free reference sites is suggested.
Introduction
Rice field wetland ecosystems of Southern Asia represent an important habitat for a multitude of aquatic invertebrate and vertebrate species. Many species fulfill ecosystem functions which are vital for agricultural production, such as the breakdown and decomposition of organic materials and the cycling of nutrients (Simpson & Roger Citation1995; Lawler Citation2001; Wilson et al. Citation2008). In addition, some species (e.g. fishes, frogs, crustaceans, and large insects) comprise a significant addition to farmers’ livelihoods, especially in poorer rice-growing regions (Little et al. Citation1996; Halwart Citation2006; Shams Citation2007; Nurhasan et al. Citation2010). Some species, however, are potential pests which can heavily damage the rice crops. These include several insect species (e.g. rice bugs, leaf-folders, stem borers, locusts, and weevils) and molluscs (in particular the golden apple snail, GAS, Pomacea canaliculata, introduced to Thailand during the 1980s) (Pathak & Khan Citation1994; Matteson Citation2000; Savary et al. Citation2000; Carlsson et al. Citation2004). To combat such harmful pest species in rice and other crops, synthetic pesticides have been increasingly used in Asian countries (cf. Maneepitak & Cochard Citation2014). Pesticides are, however, nonspecific and thus also affect ecologically beneficial and economically valuable species. Still relatively little is known about the overall longer-term impacts of manifold uses of pesticides on paddy ecosystems and the resulting wider economic costs.
Only a few detailed and comprehensive surveys have ever been made on the invertebrate and vertebrate faunal composition in rice field wetland ecosystems of Southern Asia (e.g. Heckman Citation1974, Citation1979; Bambaradeniya et al. Citation2004; Aditya et al. Citation2010), whereby effects of pesticide uses have not been investigated in detail. On the other hand, an ample literature exists describing the effects of pesticides on aquatic organisms in experimental settings (c.f. a multitude of studies cited in the Discussion section of this article). However, there is generally still little knowledge and understanding about how entire rice field ecosystems and landscapes are affected by the variable pesticide ‘cocktail’ applied on farms. Indeed, the effects of pesticide uses in real-world ‘experimental’ settings may substantially digress from theoretical premises established from laboratory and small-scale tests because on the fields (1) the pesticides’ concentrations may vary substantially in space and time (possibly allowing for refuges for affected species), (2) pesticides may act collectively (e.g. sublethal levels eventually becoming lethal) or interact with each other and thus effective toxicity may differ, (3) secondary effects may occur through the accumulation of chemical residues in soils and irrigation waters, (4) pesticide resistances (physiological and/or behavioral) may build up in diverse ways in naturally occurring species, and (5) communities and species interactions tend to be far more complex and unpredictable in nature as compared to experimental systems (Roger & Bhuiyan Citation1995; Simpson & Roger Citation1995; Relyea Citation2005; Relyea & Hoverman Citation2006; Liess et al. Citation2008).
In a previous study (Maneepitak & Cochard Citation2014) we investigated the uses and applications of pesticides on rice fields of 40 ‘intensively’ or ‘conventionally’ managed farms (IF) and 31 ‘ecologically’ or ‘organically’ managed farms (EF) in Central Thailand – one study site each in Ang Thong (AT) and Ayutthaya (PNA) Provinces. Overall, 45 types of natural or synthetic pesticides were recorded from interviews of the farmers. From the data, and using available literature information on the pesticides’ toxicity to rats (chemicals orally fed), indices describing pesticide ‘toxic exposures’ were calculated (as a proxy for toxicities to animals, including humans). Data analyses showed various gradients of toxicity in the rice fields. The pesticides apparently negatively affected carbon-reducing processes in soils and rice growth during the dry season (when pollutant concentration in paddy water was higher than in the wet season) (Maneepitak & Cochard Citation2014).
In this subsequent study presented here, we utilized the baseline information on chemical uses, toxic pollution, and field conditions established by Maneepitak and Cochard (Citation2014) to further investigate how the pesticide regimes relate to the patterns of aquatic faunal species richness, abundance, and diversity in the rice fields of the 71 farms. The following questions were addressed:
What are the concentrations of major plankton groups on the rice fields? What types of aquatic macro-invertebrates are found on the rice fields, and how does their abundance interrelate with plankton concentrations?
What types of fish species are found, and how does their abundance interrelate with macro-invertebrate abundance and/or plankton concentrations? What types of waterfowl species are found, and how does their abundance interrelate with fish abundance?
To what degree and in which ways do the various aquatic communities and biodiversity (assessed at several taxonomic and functional levels) vary according to pesticide application compared to variation due to other parameters (location, water levels, soil nutrients, rice densities, species interactions)?
Methods
Description of the study sites and farm (F) variables
The study was conducted in the central plains north of Bangkok at two sites, i.e. in Mueang and Visechaichan Districts in Ang Thong Province (AT site; 14° 31-34′ N, 100° 23-27′ E) and in Bang Sai District in Phra Nakhon Si Ayutthaya Province (PNA site; 14° 13-16′ N, 100° 23-28′) (a map and more detailed descriptions are provided in Maneepitak & Cochard Citation2014). This is an old rice production region which still harbors a fairly rich biodiversity (e.g. listed as ‘important bird area’; Chan et al. Citation2004). Rice is grown during the wet (June to August) and dry seasons (January to March) (temperature and rainfall data are provided in Maneepitak & Cochard Citation2014). Intensive cultivation practices nowadays – in a majority of cases – heavily rely on the uses of agrochemicals, especially inorganic fertilizers (mostly nitrogen) and synthetic pesticides for pest control (referred to as IF) (Office of Agricultural Economics Citation2008). However, some farmers (commonly organized in ‘local expert learning centers’) are experimenting with ecologically based methods and may either use no synthetic pesticides or use them only in cases of severe pest outbreaks (referred to as EF). PNA is a more industrialized region than AT, and due to better irrigation infrastructure farmers in PNA have improved access to water resources throughout the year (Maneepitak & Cochard Citation2014).
During 2010 and 2011, 20 IF and 20 EF were visited in AT and another 20 IF and 11 EF in PNA. Farm variables evaluated in statistical models as predictors of faunal variables (cf. later sections) included the study sites (AT or PNA; variable F1), the geographic locations of the surveyed farm as UTM latitude (F2a) and longitude (F2b), the seasons (wet or dry season, F3a) and the number of days since rice planting (F3b), and the farm types (EF or IF, F4) (cf. Maneepitak & Cochard Citation2014).
Description of pesticides used on farms
Using structured questionnaires the owners of the farms were interviewed to obtain information about their personal profiles and their uses of pesticides on the paddy fields (see Maneepitak & Cochard Citation2014). Overall, 12 types of herbicides (all synthetic), 13 natural and 14 synthetic insecticides, and 1 natural and 5 synthetic molluscicides were recorded during the survey (summary in Tables A1 and A2 in Appendix A). The most commonly used insecticides were abamectin (a ‘moderately’ to ‘highly’ hazardous insecticide derived from bacterial products, used by 44% of farmers) and a chlorpyrifos + cypermethrin mixture (‘moderately’ hazardous synthetics, used by 37%), whereas the most commonly used molluscicide was tea seed powder (a saponin-based natural product, used by 32%) (Maneepitak & Cochard Citation2014; toxicity levels refer to World Health Organization Citation2010). The most commonly used herbicide was butachlor (‘slightly’ hazardous synthetic, used in pure form by 54% and in mixture with other chemicals by 19% of the farmers), but the mixture of clomazone + propanil (‘moderately’ to ‘slightly’ hazardous synthetics) was also commonly used (23%) at the PNA sites. Any other pesticides were used only on a few farms (≤8%). Farmers in PNA generally used higher levels of highly toxic synthetics than farmers in AT. Furthermore, EF farmers used more natural pesticides of generally lower hazardousness to humans (Maneepitak & Cochard Citation2014).
Variables (C) describing pesticide uses and ‘pesticide toxic exposures’
For each pesticide the interviewed farmers indicated the concentration (in cc/ha or kg/ha, depending on type) which they usually use per pesticide application, the frequency of applications per crop, and the number of years for which the chemical had been used. Using these data, two indices were calculated for each pesticide:
‘seasonal input’ index (cc/ha) = mean concentration (cc/ha) × seasonal application frequency
‘cumulative input’ index (cc/ha) = ‘seasonal input’ index (cc/ha) × number of years in use
The frequently used pesticide types chlorpyrifos + cypermethrin mixture, abamectin, butachlor, and tea seed powder (natural molluscicide) were used as potential predictor variables in statistical analyses in four different forms, i.e. pesticide type applied or not on farms (binary variable, C1a), mean application concentration per use (cc/ha, C1b), ‘seasonal input’ index (cc/ha, C1VA), and ‘cumulative input’ index (cc/ha, C1VC).
In addition, indices were calculated to describe the overall ‘toxic inputs’ of all synthetic and/or natural pesticides used on a farm. The overall toxicity of pesticides was approximated by using information on LD50 rat toxicity, i.e. for each type of pesticide the lethal dose in mg (concentrated) needed to kill 1 kg weight unit of rat at a likelihood of 0.5 (dose fed to rats orally) (see Table A1 of Appendix A; cf. Maneepitak & Cochard Citation2014). For each pesticide type used on a farm a ‘seasonal’ (stv) and a ‘cumulative toxicity volume’ (ctv) was calculated by weighing the ‘seasonal’ and ‘cumulative’ input indices (cc/ha), respectively, by the corresponding LD50 rat toxicity. The two combined indices were then:
Index of ‘seasonal toxic input’ (C3) = sum of stv of all types of a pesticide group used per farm
Index of ‘cumulative toxic input’ (C4) = sum of ctv of all types of pesticide group used per farm
Such indices were calculated for all pesticides (C3tot, C4tot) and for the subcategories natural (C3In, C4In) and synthetic (C3Is, C4Is) insecticides, natural (C3Mn, C4Mn) and overall (including synthetic, C3M, C4M) molluscicides, and herbicides (C3Hs, C4Hs).
Since rats weigh on average about 0.5 kg, the indices may be interpreted to designate the number of thousands of rats which – in theory – could have been fatally poisoned if the respective volumes of all pesticides would have been fed orally to rats. The indices may represent a realistic proxy for the toxicity to animal species, including human beings (Janardan et al. Citation1984), but may be less useful to describe toxicity to other organisms, e.g. microorganisms. For this reason, the most commonly used chemicals (C1) and the indices for all subcategories (C3 and C4) were all included as potential predictors in statistical testing. In addition to the indices (interval variables) the ordinal variables ‘number of pesticide types used’ (C2) were also included into the analyses for all pesticides (C2tot) and the respective subcategories (C2In, C2Is, C2Mn, C2Ms, C2M, C2Hs; cf. above). A description of all the variables used for statistical analyses is provided in Table B2 in Appendix B.
Variables (P) describing biophysical parameters in rice fields
A first field survey was conducted in the ‘dry’ winter growing season during 20–29 January 2011 (35–45 days after the start of growing season; rice is harvested after ~110 days), whereby 10 IF and 10 EF were surveyed at each study site (40 farms in total). A second survey was conducted in the ‘wet’ summer growing season during 24–30 June 2011 (40–50 days into the growing season), whereby all 71 farms were surveyed. Fields near the farms were selected to sample the aquatic fauna. Biophysical field variables measured and evaluated in statistical models as predictors of faunal variables (cf. later sections) included the distance from the field boundary (earthen dam) to the nearest irrigation canal (with permanent water) (in m; variable P1), the mean water depth in the field (in cm; P2), the average soil pH (P3), soil organic carbon (in %; P4), soil (total) nitrogen content (in ‰; P5), the average rice height (longest panicles in cm; P6), and rice densities (rice stems m−2; P7) (for more detailed descriptions see Maneepitak & Cochard Citation2014, and Table B3, Appendix B).
Data collection of plankton in rice fields (K variables)
To assess plankton (K variables) samples of 0.5 l of water were collected at a depth of ~3 cm from 10 random locations in each field. The combined water (5 l) was passed through a plankton net to obtain 10 ml concentrates, which were preserved with 5% neutral formaldehyde for later analysis in the AIT laboratory. From the concentrates 0.5 ml water samples were extracted, and the number of individuals of plankton groups (i.e. the phylum or arthropod class) were counted over a 10 × 10 mm grid using a microscope (Downing & Rigler Citation1984). Several literature sources (Boonmee Citation1991; Vongrat Citation2000, Citation2002; Chittipun et al. Citation2007) were used to identify the different groups (summarized in Table A3, Appendix A). For the various plankton groups the data were extrapolated to organism counts per liter of water (K1) and were used directly for statistical testing. In addition, the data were added up for counts of all plankton (K2a), phytoplankton (K3a), and zooplankton (K4a). Furthermore, ‘indices of biomass’ (volume in mm3/l) were calculated for all plankton (K2b), phytoplankton (K3b), and zooplankton (K4b) by multiplying the densities with the approximate average sizes (volume in mm3, assessed from measurements and/or information from literature) of organisms in each taxonomic group, and summing up the respective functional groups (K2–4).
Data collection of rice field aquatic arthropods and calculation of biodiversity indices (A variables)
Using a sieve net (15 cm ring diameter) aquatic arthropods (A variables) were sampled around the bases of rice plants at five random locations in each field, whereby sampling effort was adjusted in approximate relation to water depth (e.g. one sweep at 15 cm water depth, four sweeps at 5 cm). The sampled arthropods were killed using 5% neutral formaldehyde and preserved in alcohol for later identification at AIT. For each of the 111 samples (both surveys) the collected arthropods were identified to species or ‘taxonomic units’ which were likely to represent different species, using several texts (Chittipun et al. Citation2007; Lekprayoon et al. Citation2007; Srirattanasak et al. Citation2007; Boonsoong & Sangpradub Citation2008) (summarized in Tables A4 and A5, Appendix A). The data of some species which were found in more than 20 fields were used directly in statistical analyses (A1 variables).
The organismal abundance of higher taxonomic groups (i.e. Coleoptera, Hemiptera, and all Arthropoda) and functional groups (herbivores and predators) was assessed by adding up the counts of species within the respective groups (variables A2a and A3a). Furthermore, ‘indices of total biomass’ (volume in mm3/sample) were calculated by multiplying the counts with the estimated average sizes (body volume in mm3, assessed from measurements, and/or information from literature) of species and summing up the values for the groups (A2b/A3b). ‘Indices of average biomass’ were then calculated by dividing ‘indices of total biomass’ by the total counts (A2c/A3c). The diversity of higher taxonomic and functional groups was assessed by ‘species richness’ per field sample (A2d/A3d). Furthermore, arthropod biodiversity was measured using the following indices (Magurran Citation2003):
Shannon–Wiener index (A2e/A3e) = −Σ[ni/N * ln(ni/N)]
Shannon evenness index (A2h/A3h) = Shannon–Wiener index/S
where ni denotes the organism counts of species i in the sample, N the total count of arthropods sampled, and S the number of species in the sample.
Data collection of rice field molluscs, fishes, and waterfowl (M, T, and W variables)
Molluscs (M variables) were surveyed by placing a 1 m2 wire frame in a random fashion near each corner and in the middle of a sampled field (i.e. five replicates) and calculating the mean. Fishes (T variables) were sampled by placing a hand net (50 cm frame diameter) three times each at the inlet and at the outlet water of the field (i.e. six replicates). The species of fishes were identified using two literature sources (Sidthimunka Citation1973; Janekitkan Citation2009), and counts per species and sample were recorded. Waterfowl (W variables) were observed following a method recommended by Bird Conservation Society of Thailand (Citation2012). Species were observed and counted (using an Admiral Transit binocular of magnification 8 × 42) during an observation phase of about 1 min in a random 90° directional slice (up to a distance of ~100 m). Species were identified using the guide by Lekagul and Round (Citation2005). Vertebrate data are summarized in Table A6, Appendix A.
Statistical data analysis
A framework for the analysis of overall variable interactions for this and the accompanying study (Maneepitak & Cochard Citation2014) is shown in Figure C1 in Appendix C. Corresponding results based on multivariate analyses are shown in , , and . Minitab 15 statistical software (Minitab Inc., State College, PA, USA) was used to summarize the data variables (i.e. frequencies, mean, standard deviation, etc.) and perform statistical analyses. Before analyses the data distributions were checked, and if needed appropriate transformations (e.g. logarithm, square root, or normal score functions) were applied. Multivariate linear regression (MLR), general linear models (GLM), and binary (BLR) or ordinal (OLR) logistic regression models were used, as appropriate regarding the various sets of (interval/categorical) data tested. To determine the main factors (predictor variables) influencing or correlating with a tested dependent variable of interval data type (i.e. MLR and GLM models), stepwise variable selection using best subsets regression (BSR) analyses were performed (as model selection criterion Mallow’s Cp measure was used; for descriptions of statistics and methodology see Chatterjee & Hadi Citation1988; Chatterjee et al. Citation2000, Minitab Inc.). In the case where the dependent variable was of categorical data type we applied systematic testing of models (BLR or OLR). Tools for detecting outlier and leverage points (DFFITS and Cook’s distance) were used, and in some cases points were deleted to improve the models. Once the optimal models were determined, statistically significant associations of predictors with dependent variables were illustrated as arrows in , , and , with the arrow thickness denoting the p-value (closely commensurate with other model statistics indicating ‘effect size’, cf. Note C1 in Appendix C).
Figure 1. Data variation of plankton variables (taxonomic and functional groups) as explained by independent predictors (biophysical, farm, and pesticide variables). The numbers indicate whether the tested variables are from the first (1) or from the second (2) survey. Inserted triangles indicate a significant change of the variables from the first to the second survey (as determined from paired T-tests or Mann–Whitney tests), where ▲ indicates significantly higher and ▼ lower levels at the respective sampling time; ◊ indicates no significant change. The significance levels of the changes are indicated by the darkness of the triangles, from ▲ (p < 0.0005), ▲ (p < 0.005), to ▲ (p < 0.05). The inserted numbers represent average organism counts per liter, respectively mass indices (xi; ~volume in mm3 per liter). The arrows indicate the predictor variables (at the start of the arrows) which were significant in the models in order to explain the dependent variables (at the end of the arrows). The arrows may or may not imply causality. White arrows represent positive and black arrows negative correlations. The thickness of the arrows indicates the significance level of the correlation from the thickest (p < 0.0005), medium (p < 0.005), to the thinnest (p < 0.05). ‘Farm type’ and ‘Province’ refer to ‘organic’ farms and ‘Ayutthaya Province’, respectively. Correlations among plankton variables (all positive) are indicated by light connecting lines with thicknesses corresponding to significances. I. = index; cumul. = cumulative; plankt. = plankton; H = height; D = density; N = nitrogen content; dist. = distance; Cyperm. = cypermethrin.
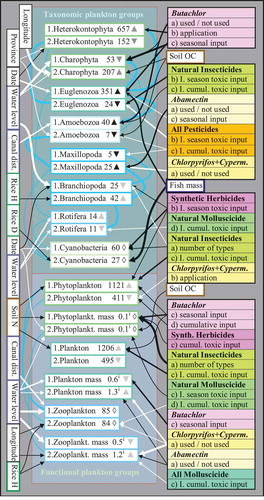
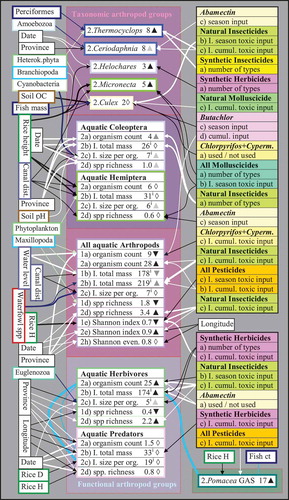
Figure 2. Data variation of invertebrate variables (only arthropods; taxonomic and functional groups) as explained by independent predictors (plankton, biophysical, farm, and pesticide variables). Refer to legend of for an explanation of the arrows, numbering, and triangles. The figures represent (a) average organism counts in all net samples per farm, (b) average total mass indices (xi; ~volume in mm3 in all net samples per farm), (c) average organism mass indices (xi; ~mm3), (d) average number of species, and average levels of biodiversity as described by (e) the Shannon–Weiner index, and (f) the Shannon Evenness index. Correlations between herbivore and predator group variables (all positive) are indicated by light connecting lines with thicknesses corresponding to significances. I. = index; cumul. = cumulative; H = height; D = density; fish ct = fish counts; dist. = distance; spp = species; org. = organism; even. = evenness; OC = organic carbon content; GAS = golden apple snail; Cyperm. = cypermethrin.
Statistically determined associations among the various variables were interpreted ecologically and in comparison with the available literature, keeping in mind that these may be due to (1) the influence (direct or indirect) of one variable upon another; (2) covariation which may be explained by other (hidden) factors (possibly not assessed in the study); or (3) chance effects (statistical error of the first kind), especially in the case of marginally significant correlations. All variables are described in Appendix B (Tables B1–B3), and summaries of descriptive statistics as well as model statistics from multivariate analyses (including listing of significant predictors) are provided in Appendix D (Tables D5–D8).
Results
Patterns of plankton organism concentrations of different plankton groups
Plankton abundance differed widely among the studied fields from only 16 up to 4164 organisms per liter; the data typically followed log-normal distributions (Table D5, Appendix D). Heterokonts (Heterokontophyta, mostly diatoms), euglenoids (Euglenozoa), amoeboid protists (Amoebozoa, possibly including other phyla), and rotifers (Rotifera) were more abundant during the dry season as compared to the wet season. In contrast, green algae (Charophyta) and crustacean zooplankton – i.e. branchiopods (Branchiopoda, predominantly cladocerans, i.e. water fleas) and especially maxillopods (Maxillopoda, predominantly copepods) – were more abundant during the wet season. The counts of blue-green algae (Cyanobacteria) did not differ significantly between seasons (). Populations of euglenoids (which were strongly positively correlated with heterokonts) and also blue-green algae tended to increase throughout the dry season survey ().
Green algae, branchiopods, and rotifers were generally found at higher abundances on fields with deep water levels, especially during the dry season. Similarly, amoeboids were found at lesser abundance on fields situated close to irrigation canals. In the wet season (when waters were more diluted from high rainfalls) those effects were less prominent, but heterokonts and amoeboids tended to be slightly more abundant in the rice fields of PNA as compared to fields of AT; equally green algae were more abundant on farms situated to the east (and thus mainly in PNA) (). Fish abundance (expressed by biomass) was negatively associated with concentrations of euglenoids and heterokonts during the dry season and with blue-green algae and large cladocerans (Thermocyclops sp.) during the wet season ( and ). Furthermore, there were negative correlations between soil variables (N and OC) and some plankton groups (phytoplankton and amoeboids; ).
During the dry season all phytoplankton groups (but especially green algae) were significantly depressed on fields where herbicides (especially butachlor) were in use (). Applications of natural insecticides (mainly cumulative input) and (partly) molluscicides were negatively correlated with the abundances of euglenoids, amoeboids, and blue-green algae, especially during the dry season (). The application of strong insecticides did not markedly diminish overall levels of either zooplankton or phytoplankton – maybe with the exception of abamectin (insecticide derived from bacterial products) which affected maxillopods during the wet season. In contrast, some positive correlations of highly toxic pesticides (and especially chlorpyrifos + cypermethrin) with several plankton groups (maxillopods, euglenoids, amoeboids, and rotifers) were observed, especially during the wet season ().
Aquatic arthropod species found in samples on the fields
During both the surveys at least 39 different species of arthropods (but possibly more, due to uncertain taxonomy and cryptic species) including adult, immature, and/or larval forms were found in the net samples (Tables A4 and A5, Appendix A). At least two species of arachnids (a water mite and an aquatic spider) and three species of micro-crustaceans (large water fleas, clam shrimps, and copepods) were found in the samples; Thermocyclops sp. (copepods) and Ceriodaphnia sp. (water fleas) were found in sufficient frequencies (55% and 30%) to use for statistical analyses (). Furthermore, freshwater prawns (Macrobranchium sp.) were caught in fish nets. Sampled aquatic insects included at least six species of Coleoptera (beetles), six Hemiptera spp. (bugs), nine Diptera spp. (larvae of flies, mosquitoes and midges), four Odonata spp. (dragonfly larvae), three Ephemeroptera spp. (mayfly larvae), four Trichoptera spp. (caddisfly larvae), and one species of Plecoptera (stonefly larva). Three herbivorous insect species, i.e. Helochares sp. (water scavenger beetles, Hydrophilidae), Micronecta sp. (water boatman bugs, Corixidae), and larval Culex sp. (mosquito larvae, Culicidae), were found in sufficient frequencies (51%, 42%, and 41%, respectively) to use for statistical analyses ().
Patterns of abundance and diversity of aquatic arthropods
Aquatic arthropods (in particular herbivores) were on average significantly more abundant (28 vs. nine organisms per field sample on average) and more diverse (3.4 vs. 1.8 species) during the wet season as compared to the dry season (; Table D6, Appendix D). Between the seasons there were also differences in life stages with larval or immature forms only found in the dry season in some species (e.g. Helochares sp.) and in the wet season in other species (e.g. Neohydrocoptus sp. and Anisops sp.; Table A5b, Appendix A). Arthropod abundance and biomass tended to be increased on more deeply inundated fields with higher copepod concentrations (during the dry season only) and fields situated closer to irrigation canals (during both seasons) (). Arthropod diversity and abundance (especially of water beetles and predatory species) tended to increase with time passing throughout the survey. Arthropods were more abundant and diverse on the fields of PNA as compared to AT, despite generally higher uses of pesticides at PNA (cf. Maneepitak & Cochard Citation2014). Average sizes of arthropods tended to be increased on fields closer to irrigation canals and fields where no or few waterfowl (herons and open-billed stork) were observed ().
Arthropods were overall most abundant and diverse on fields treated with natural insecticides, especially during the wet season (notably fields treated with natural insecticides were mostly those fields where no or only lower levels of synthetic insecticides were used; cf. Maneepitak & Cochard Citation2014). Indications were toward longer-term uses as the predictors (with positive coefficient) were predominantly the ‘cumulative toxic input’ of natural insecticides; in contrast, in statistical models herbivore abundance was actually negatively associated with ‘seasonal toxic input’ of natural insecticides, when controlled for ‘cumulative toxic input’ (). When controlled for the ‘cumulative toxic input’ of natural insecticides the ‘total cumulative toxic input’ (mostly representing highly toxic pesticides, i.e. synthetic insecticides) was equally slightly positively correlated with arthropod abundance and biomass in the wet season. Furthermore, abundance/biomass of herbivorous insects was increased on fields treated with abamectin, but it appears that some species of (most probably predaceous) bugs avoided fields exposed to abamectin (as is indicated by lowered hemipteran species richness, but no effects on herbivorous Micronecta sp.) (). Other than this, the data did not reveal any direct effects of insecticides on predaceous insect populations. Large species of predators were mostly found on fields where herbivorous insects were abundant, and long-term uses of herbicides additionally affected predators possibly via decreasing their prey. Furthermore, the occurrence of predators varied along geographical gradients (more abundant in PNA and on farms located to the west) and increased with time ().
The abundance of water beetles (Coleoptera) increased with time and especially on fields treated with natural insecticides (rather than with synthetic insecticides). The most abundant water beetle (Helochares sp.) appeared unaffected by insecticides, but applications of a second type of herbicide (to treat re-growing weeds) apparently exerted negative effects (). Albeit more beetles were generally found on fields of PNA, the sampled species tended to be larger in AT. Furthermore, large species were mostly sampled in fields with abundant cladoceran plankton, whereas more comparatively small species abounded on fields with copious blue-green algae ().
Water bugs (Hemiptera) may have been differently affected by insecticides (no manifest patterns, except fewer species on fields treated with abamectin and molluscicides) than beetles. Hemipterans were particularly abundant on fields situated close to irrigation canals, and abundance declined on fields where rice canopies were closing (). The data indicated that the most abundant water bugs (Micronecta sp.) were negatively affected by molluscicides ().
Mosquito larvae (Diptera) were abundant on fields with high inputs of natural pesticides but low inputs of butachlor, and on fields with comparatively lower soil OC (soil OC is positively correlated with ‘total cumulative toxic input’ on rice fields, cf. Maneepitak & Cochard Citation2014). The presence of rice field fishes was also slightly negatively correlated with mosquito larvae ().
Patterns of abundance of aquatic molluscs
Native species of Lymnaea and Filopaludina were found at some rice fields during both surveys (Maneepitak, personal observation). However, the only mollusc species found in samples was the introduced P. canaliculata (GAS). Populations of GAS were on average about 25 times higher during the wet season as compared to the dry season. Data analysis did not reveal any conspicuous patterns relating to the application of molluscicides, but positive correlations were found between GAS abundance with the biomass of herbivorous arthropods and fishes. In addition, GAS were slightly more abundant on fields with high overall ‘cumulative toxic input’ of pesticides and where rice plants were lower ( and ).
Figure 3. Principal components analysis (PCA) plot illustrating the multivariate correlations of selected plankton, invertebrate, fish, and waterfowl variables, as well as pesticide and biophysical variables (also including the factors ‘province’ and ‘farm type’). The pesticide variables refer to ‘seasonal toxic input’ (crop) or ‘cumulative toxic input’ (cumul.). The interval data were all transformed to a normal distribution. The PCA eigenvalues of the first and second components were 6.92 and 5.10, respectively. GAS = golden apple snail; spp = species; richn. = richness; Sh. = Shannon.
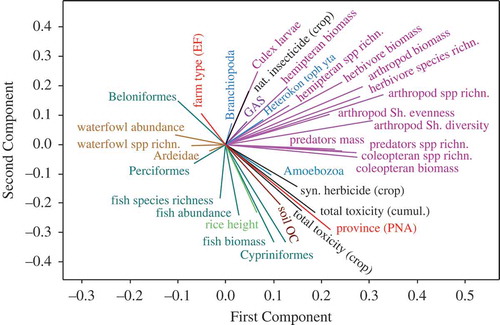
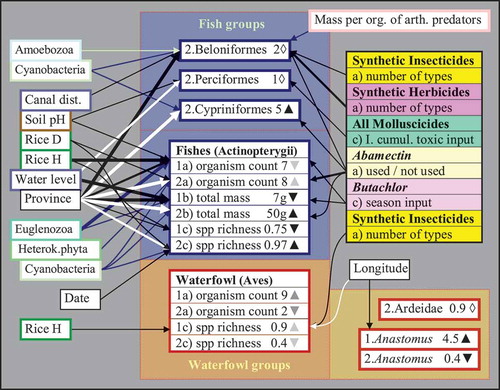
Figure 4. Data variation of fish and waterfowl variables (vertebrates) as explained by independent predictors (invertebrate, plankton, biophysical, farm, and pesticide variables). Refer to legend of for an explanation of the arrows, numbering, and triangles. The figures represent (a) average organism counts during standardized observations per farm, (b) average total mass indices (in grams), and (c) average number of species. Correlations between fish and invertebrate or plankton variables are indicated by connecting lines with thicknesses corresponding to significances, dark lines indicating negative and light lines indicating positive correlations. arth. = arthropod; other abbreviations cf. .
Patterns of abundance and diversity of fishes
During both the surveys nine different species of fish were caught in the nets at the inlets/outlets of the fields (Table A6, Appendix A). This included two species of needle fishes (Beloniformes, including rice fishes and halfbeaks), five species of perch-like fishes (Perciformes, including gouramis, snakeheads, and labyrinth fishes), and two species of barbs (Cypriniformes). Barbs (primarily Cyclocheilichthys repasson, the largest sampled species, >8 cm) were only caught during the wet season and only in PNA. In contrast, needle fishes (observed during both the seasons, especially Oryzias minutillus, the smallest species, <1.3 cm) were almost exclusively found in AT. Hence, in the wet season fish abundance, biomass, and species richness were highest overall (with a preponderance in PNA), but relatively more fishes were counted in AT as compared to PNA during the dry season (). In contrast, perch-like fishes (especially gouramis, Trichopodus spp., intermediate sizes ~2–8 cm) were found in similar numbers at both the study sites and surveys ().
Overall, fewer fishes were found at fields stocked with large or dense rice crops and on fields with high levels of phytoplankton (). Perch-like fishes were mostly present at fields with high water levels and more acid soils, whereas needle fishes were present on fields close to irrigation canals and fields containing an abundance of amoeboid plankton but few large insect predators. Gouramis and other perch-like fishes were mostly absent from fields where molluscicides had been in use over many years. In contrast, the presence of needle fishes was negatively influenced by the application of synthetic insecticides (in particular abamectin) and herbicides ().
Patterns of abundance and diversity of waterfowl
Over both the surveys seven species of waterfowl were observed on the fields, including the Asian open-billed stork (Anastomus oscitans, a species feeding mainly on wetland snails), four species of herons (Ardeidae, feeding on fishes, frogs, and large insects), and two species of ducks (Anatidae, feeding on algae and weeds) (Table A6, Appendix A). During the dry season the storks were the most abundant species (4.5 birds per field on average). However, the numbers were significantly lower during the wet season (0.4). In contrast, numbers of herons did not differ markedly between surveys (about one bird per field, on average) (). Ducks were observed (in the wet season) on two farms only – however with one count of >50 mallards (Anas platyrhynchos).
None of the variables tested in statistical models predicted bird abundance or species richness in the wet season, but during the dry season some geographical patterns were identified, i.e. fewer numbers of storks, but more waterfowl species (primarily egrets) were observed on fields situated to the east (closer to Chao Phraya River and in PNA) ( and ). Furthermore, fewer species of birds were observed on fields covered with tall rice plants and treated with different types of synthetic insecticides ().
Discussion
As has been shown by Maneepitak and Cochard (Citation2014) farmers at the study sites use a large array of different types of pesticides, including natural and synthetic products, and these products are applied at various frequencies and intensities. Thus, describing and investigating the overall impacts of pesticide uses in the rice fields are not trivial. Equally, the results presented here show that the influence of the pesticide ‘cocktail’ on the patterns of faunal abundance and diversity in the rice field environment are fairly intricate. The results revealed tendencies toward higher faunal abundance and diversity on fields where lesser-toxic natural insecticides were in use as compared to fields treated with synthetic pesticides. However, interactions among different groups of aquatic organisms were manifold, and likewise parameters of general water quality, landscape constellations, and field characteristics were apparently important to explain various patterns. For these and other reasons (e.g. the development of resistances toward pesticides) certain species were also observed to thrive on fields where relatively high levels of hazardous pesticides were used.
Variation of organism concentrations of different plankton groups
The seasonal and regional differences observed in the plankton data indicate that irrigation waters were on average more polluted (enriched with nutrients) and turbid during the dry season, and especially at PNA. Heterokonts, euglenoids and amoeboids are typically promoted by increased nutrient levels, and rotifers as well as amoeboids feed on suspended organic matter and small plankton (Munawar Citation1972; Camargo & Alonso Citation2006). Euglenoids are not only partly phototrophic but also major consumers of phytoplankton, especially of diatoms (Leedale Citation1967). Algal blooms of euglenoids and diatoms are common under nutrient enrichment (Duttagupta et al. Citation2004; Rahman et al. Citation2007), explaining population increases and correlations in abundance between the two groups.
In contrast to these groups concentrations of green algae were lower during the dry season as compared to the wet season. This may be explained by higher concentrations of herbicides (especially butachlor) in waters derived from irrigation canals rather than from rainfalls (and especially on fields with shallow water levels; cf. Roger Citation1995). As members of the plant kingdom green algae tend to be more sensitive to herbicides than other phytoplankton (Roger Citation1995; Ma Citation2002; Chang et al. Citation2011). According to available literature (Zargar & Dar Citation1990; Perschbacher & Ludwig Citation2004; Debenest et al. Citation2009; Suárez-Serrano et al. Citation2010) phytoplankton taxa with high chlorophyll a contents tend to be particularly sensitive to photo-inhibitors, whereas taxa that can switch to a heterotroph feeding mode under photo-inhibition (e.g. some euglenoids and heterokonts) tend to be less affected.
Plankton concentrations can change relatively rapidly over time, and variable nutrient levels (e.g. ammonium and phosphate) or balances (e.g. N:P ratios) in the water column may influence the development of phytoplankton communities (Camargo & Alonso Citation2006; Ramakrishnan et al. Citation2010). In ricefield wetlands nutrient levels in the water column are often unrelated to soil nutrient concentrations (Ghosh & Bhat Citation1998; Spencer et al. Citation2006). Hence, negative correlations of soil OC (positively correlated with N; Maneepitak & Cochard Citation2014) with concentrations of phytoplankton and amoeboids may be explained indirectly. High levels of soil OC may indicate higher acidity, lowered oxygen levels and high concentrations of other chemicals with allelopathic properties, affecting these plankton groups (Legrand et al. Citation2003; Camargo & Alonso Citation2006; Park et al. Citation2006).
Similarly, chemicals in natural insecticides and molluscicides may explain negative effects on certain plankton (euglenoids, amoeboids, blue-green algae), especially during the dry season. Active agents of natural pesticides, such as azadirachtin, saponins, phytoalexins, tannins, and alkaloids may have allelopathic or algicidal properties (Kreutzweiser et al. Citation2002; Mulderij Citation2006; Petroski & Stanley Citation2009; Jančula et al. Citation2010). The observed patterns may, however, also have resulted through indirect effects. Planktivorous macro-fauna was likely to be more abundant on fields which remained unaffected by synthetic insecticides. Fish abundance, for example, was negatively associated with concentrations of several plankton groups, and this may be explained by high predation by fishes on plankton, especially in the case of blue-green algae and micro-crustaceans (Rakshit et al. Citation1999; Duttagupta et al. Citation2004; Saikia & Das Citation2009). However, repulsion of fishes from fields with high phytoplankton concentrations was perhaps similarly important to explain patterns – especially during the dry season. Such repulsion may be due to a heightened presence of ichthyotoxic plankton and/or the depletion of oxygen (Rahman et al. Citation2007; Zimba et al. Citation2010; Wirasith et al. Citation2011).
According to the available literature (Day Citation1989; Traas et al. Citation1998; van den Brink et al. et al. Citation2002; Friberg-Jensen et al. Citation2003; Sánchez-Bayo Citation2006; Daam et al. Citation2008; López-Mancisidor et al. Citation2008) many groups of plankton (in particular micro-crustaceans) are negatively affected by the use of synthetic insecticides. However, any negative effects were apparently non-permanent. Lost plankton was probably readily replaced via reproduction of surviving, possibly pesticide-resistant plankton. Furthermore, it appears that any impacts were weighed up by longer-term benefits resulting from diminished predation by aquatic macro-fauna. This may explain positive effects of highly toxic pesticides (especially chlorpyrifos + cypermethrin) on some plankton groups (including higher survival rates of relatively larger plankton), especially during the wet season. The highly toxic insecticide abamectin may have exerted direct negative effects on plankton (especially maxillopods); several studies (Ali et al. Citation1997; Tišler & Eržen Citation2006; Boonstra et al. Citation2011; Braun et al. Citation2012) have reported high lethal toxicity of abamectin on micro-crustaceans. However, the abundance of copepods may also have been diminished through increased predation by macro-invertebrates, ultimately traceable to negative effects of abamectin on fishes ( and ).
Patterns of abundance and diversity of aquatic arthropods
The types of recorded aquatic arthropods partly reflected the sampling method and the organisms’ distributions in the water column, with many free-swimming (e.g. water beetles, bugs, mosquito larvae) and fewer bottom-dwelling species (e.g. mayfly and caddisfly larvae) caught. Other than that, the populations were characteristic for seasonal ephemeral wetlands such as rice fields, where many vagrant species (e.g. water bugs and beetles) and larval forms of flying insects (e.g. mosquitoes and dragonflies) are commonly found (Heckman Citation1974, Citation1979; Bambaradeniya et al. Citation2004).
As for plankton, the differences in arthropod numbers, biomass, and species between the two surveys pointed toward a better water quality in the wet season. Colonization rates by arthropods (probably mostly from nearby irrigation canals) may have been high on fields where pollutants were less concentrated (i.e. on more deeply inundated fields with high concentrations of copepods). The generally higher abundance of arthropods at PNA (as compared to AT) may be explained by the denser network of permanent waterways (irrigation canals and/or natural rivers) which characterizes the PNA site. Such waterways may offer many refuges as well as avenues/stepping stones to colonize the fields (especially in the case of large species with extended larval stages, such as many predators).
It has been reported in several studies (Hesler et al. Citation1993; Hossain et al. Citation2002; Wilson et al. Citation2008; Rizo-Patrón et al. Citation2013) that aquatic arthropods (especially predators) tend to be more abundant and diverse on EF as compared to IF. However, the observed patterns are rarely lucid but depend on various other factors, such as environmental conditions, pollution effects, pesticide resistances developed in species, and the specific characteristics of food webs and community assembly/dynamics (Rohr & Crumrine Citation2005; Relyea & Hoverman Citation2006; Resetarits & Binckley Citation2009; Vonesh & Kraus Citation2009). In our study arthropods were generally most abundant and diverse on fields treated with natural insecticides (mostly used on EF), especially during the wet season. This does not necessarily imply that natural insecticides were harmless. Bio-pesticides derived from plant and microbial products have been reported to cause significant mortality to aquatic arthropods, especially under high concentrations in experiments (Scott & Kaushik Citation1998; Kreutzweiser et al. Citation1999; Shaalan et al. Citation2005; Zimmermann Citation2007; Koodalingam et al. Citation2009). Nonetheless, since farmers who used natural insecticides normally made no or fewer uses of synthetic insecticides (cf. Maneepitak & Cochard Citation2014), correlations with natural insecticides may also signal the absence of negative effects by synthetic insecticides. Due to generally higher toxicity, pulses of synthetic insecticides are likely to have considerably stronger effects on aquatic rice field arthropods than pulses of natural insecticides (Crosslands Citation1982; Mullié et al. Citation1991; Simpson & Roger Citation1995; Traas et al. Citation1998; Rubach et al. Citation2011). Furthermore, most synthetic chemicals are characterized by a lower degradability and considerably longer residual time than naturally derived chemicals, prolonging their effects on the fields (Roger & Bhuiyan Citation1995; Shaalan et al. Citation2005; Wang & Shimazu Citation2006; Extoxnet Citation2012; Pesticide Action Network North America Citation2012).
Conceivably, several species may have acquired certain physiological and/or behavioral resistances against natural as well as synthetic pesticides. This was indicated (especially in the wet season) by positive correlations of (total) arthropod abundance/biomass with ‘total cumulative toxic input’, or positive correlations of herbivore abundance/biomass with abamectin (when controlled for effects of natural insecticides). Under applied concentrations abamectin may have minor effects on aquatic insects (Ali et al. Citation1997). Fields treated with abamectin may thus attract resistant insects which benefit through lowered predation pressure (e.g. from fishes), similar to what has been observed in other studies involving pesticides and predation risk (Relyea & Hoverman Citation2006; Resetarits & Binckley Citation2009; Vonesh & Kraus Citation2009).
Many aquatic beetle species are highly mobile and are often among the first colonizers of transient wetlands (Larson Citation1997; Bambaradeniya et al. Citation2004; Leitão et al. Citation2007). Continuous immigration from nearby permanent waterways thus probably explains the increase in coleopteran abundance with time as well as high abundances in PNA. It may also explain higher abundances on fields treated with natural insecticides, since coleopterans exposed to nonlethal pesticide doses may evade affected areas but soon return after pesticides have dissipated and/or degraded to tolerable levels (Simpson & Roger Citation1995; Ali et al. Citation1997; Trekels et al. Citation2011). Helochares sp. – the most abundant water beetles – predominantly feed on aquatic plants and are found in algal substratum (Cuppen Citation1986; Bazzanti et al. Citation2010). This may explain their lowered abundance on fields treated with a second type of herbicide (to treat re-growing weeds). High abundances of large beetle species on fields with abundant cladoceran plankton, and low abundances on fields with copious blue-green algae, may reflect food preferences as related to the size of the beetles (many are omnivorous at different life stages) or interactions with larger species, e.g. fishes.
Aquatic bugs were most abundant on sparsely covered fields near irrigation canals. This corresponds to observations by Leitão et al. (Citation2007) who recorded more abundant water bugs near the more open rim zones rather than in the center of the rice fields. Water bugs tend to move off rice fields in the late growing season due to changing requirements or declines of food sources under closing rice canopies (Saijo Citation2001; Mukai & Ishii Citation2007; Ohba et al. Citation2011; Phommi Citation2011). The common corixid bugs (Micronecta sp.) are predominantly feeding on algae and detritus (Slack Citation1947), explaining their abundance on open fields. Corixid bugs have been found to be most sensitive to fungicidal chemicals (Daam et al. Citation2008), and thus molluscicides may similarly have affected Micronecta sp. in a direct way.
Mosquito larvae feed on organic detritus, bacteria, algae, and protists (Walker et al. Citation1988). During ovipositioning mosquitoes optimize offspring survival by selecting suitable habitats according to chemical cues mostly derived from bacteria involved in fermentation processes (Trexler et al. Citation2003; Ponnusamy et al. Citation2010). This may partly explain why mosquitoes were abundant on fields with high inputs of natural pesticides but low inputs of butachlor. Many natural pesticides are derived from fermenting biomass and fluids, and additional nutrients are added. In contrast, application of butachlor diminishes the productivity of weeds and algae. Mosquitoes were also found to be more abundant on fields with comparatively lower soil OC. This observation lends support to the assumption (cf. Maneepitak & Cochard Citation2014) that soil bacterial communities involved in (aerobic) decomposition processes were affected by high overall exposures to pesticides: high bacterial activity leads to faster carbon reduction as well as – presumably – a higher attractiveness to mosquitoes. Furthermore, Culex mosquitoes are typically repelled by butyric acid and other products of anaerobic fermentation (also contained in animal manure) which are potentially toxic to the larvae (Hwang et al. Citation1980; Victor & Reuben Citation2000). Reported responses have, however, not been consistent since ovipositioning preferences are influenced by the chemical composition to which the mosquitoes were exposed as larvae (Mccall & Eaton Citation2001). The correlation between larval abundance and soil OC may thus be the outcome of selective processes which may be primarily driven by pesticide toxicity and anaereobic conditions, with associated toxic byproducts. Rice field fishes are major predators of mosquito larvae, probably explaining their negative effects on larval abundance.
Patterns of abundance of aquatic molluscs
The invasion of the introduced P. canaliculata (GAS) into the rice field ecosystems had a catastrophic impact on native snail communities, whereby several species disappeared entirely (Carlsson et al. Citation2004). Hence only this species was found in the samples on the studied fields. The patterns of GAS abundance (as observed during the wet season) were not very clear but overall pointed toward some resistances by GAS against toxic pesticides and conditions which were suitable for GAS as well as for other herbivores (e.g. presence of macrophytes and height of rice, low predation pressure by fishes and other predators, possibly lower competition from other herbivores due to pesticide uses). In any case, the much higher abundance of GAS during the wet season as compared to the dry season indicates that high rainfalls and associated flooding strongly facilitated the invasion of GAS into the rice fields from nearby irrigation canals and/or wetlands. Factors relating to the presence of nearby breeding sites and to any physical barriers which can obstruct or facilitate the invasion into rice field may thus, overall, be considerably more important than the application of pesticides on the fields. Another factor explaining the differences may also be the much lower abundance of open-billed storks (which feed on GAS) during the wet season.
Patterns of abundance of fishes
Roaming activities of (especially larger) fishes from ponds and irrigation canals into rice fields are particularly high during the wet season (Halwart et al. Citation1996; Rainboth Citation1996). This possibly explains the absence of barbs during the dry season as well as site differences. More permanent waterways were located in PNA, but fields were more exposed to agrochemicals especially during the dry season. Nearby permanent water bodies with abundant fish prey are typically important to explain abundance and diversity of fishes in rice fields, especially if the water quality on rice fields is relatively high (Katano et al. Citation2003; Uchida & Inoue Citation2010). The presence of barbs in PNA may also partly explain the scarcity of rice fishes. Barbs may displace rice fishes directly through territorial behavior, or their presence may indicate the presence of other fish and/or insect species that prey on rice fishes (Iguchi & Kitano Citation2008; Aditya et al. Citation2010).
High usage of pesticides may also partly explain the absence of needle fishes from most fields at PNA. Studies have found significant pesticide sensitivities by Oryzias species, and toxicity is often particularly high for small fishes (Cagauan Citation1995; González-Doncel et al. Citation2004; Capkin et al. Citation2006; Kim et al. Citation2008). In contrast, applications of herbicides (especially butachlor) may have affected fishes via decreasing their food sources (algae and plankton) and habitat qualities. Herbicides can affect fishes directly (Moraes et al. Citation2009; Tramboo et al. Citation2011; Tu et al. Citation2013), but the decomposition of weeds may also lead to deteriorating dissolved oxygen (DO) levels in the water (Murty Citation1986; Cagauan Citation1995). Serious adverse effects of abamectin on fishes (depending on chemical concentrations) have been noted in several studies (Ali et al. Citation1997; Tišler & Eržen Citation2006; Sheeba Jasmine et al. Citation2008; XiZhen & HongDa Citation2009). Hence, fish abundances (except gouramis) were lowered on fields where abamectin was used. Perch-like fishes were mostly absent from fields where molluscicides had been in use over many years. This is probably because of direct cumulative effects of chemicals such as saponin on fish populations (Terazaki et al. Citation1980; Oliveira-Filho & Paumgartten Citation2000).
Patterns of abundance of waterfowl
Foraging waterfowl much prefer natural wetlands over rice field areas. Hence the waterfowl distribution is often more closely linked to wider landscape features than to local aspects of field management (Maeda Citation2001; Elphick et al. Citation2010). During the wet season open-billed storks are breeding in colonies mostly near larger wetlands, whereas in the dry season the birds are roaming freely (Sundar Citation2006). This explains the lower numbers of storks observed during the wet season. Nonetheless, during the dry season fewer species of birds were observed on fields covered with tall rice plants and treated with different types of synthetic insecticides. This illustrates the negative effects of synthetic insecticides and rice growth on the food sources of storks and egrets, especially since at later stages of rice growth several species of egrets gain a large proportion of their food from terrestrial insects such as grasshoppers or dragonflies (Richardson & Taylor Citation2003; Ibáñez et al. Citation2010; Parsons et al. Citation2010).
Conclusion
Pesticides are indiscriminate agents which kill pest species but also affect non-target organisms and thus degrade some of the essential ecosystem services they support. Such services include the turnover of carbon and nutrients, and the control of potentially noxious herbivores and disease vectors by predators. None of these services can be fully substituted by technological means, and the decline in rice field biodiversity is therefore of concern, particularly on a longer-term outlook. The presented study provides insights into how current pesticide regimes influence the aquatic faunal communities on the rice fields. Findings of the study may be of interest to researchers of different disciplines, including agro-ecologists, medical entomologists, and conservation biologists. Further studies should, however, be undertaken to address some of the many questions which remain unanswered.
Aquatic species conservation per se is an important objective to be pursued in bio-diverse regions such as the Chao-Phraya River basin. Each species has a number of functions to play within the ecosystem where it naturally evolved. Species of economic value such as large fishes, crustaceans and insects (e.g. Lethocerus indicus) are only found in comparatively ‘healthy’ rice field ecosystems characterized by a rich biodiversity, and several species sampled in our study may be useful to indicate specific environmental field conditions or types of pollution. Good indicator species, however, need to fulfill certain criteria (Hilty & Merenlender Citation2000). It needs to be considered that most of the arthropods sampled in the present study were fairly mobile insects able to disperse via air at the adult stage. Partly because of this, many of the observed patterns were appreciably complex and not always easily interpretable based on the collected data.
For these reasons further field studies should be conducted to better illuminate the effects of the ‘cocktail’ of agrochemicals on species of specific interest, applying targeted and comprehensive sampling. More focus should be set specifically on aspects of wider landscape structures and seasonal timing. Many species are mobile vagrants and their persistence in the area thus depends on retreats and stepping stones within the aquatic landscape at various stages during their life cycle. Optimally studies would include ‘natural control’ fields entirely untreated with any pesticides. Such studies could help substantially in developing conservation plans for essential rice field biodiversity, including rare and sensitive species of potentially high importance for sustainable rice production and the rehabilitation of ecosystem services in degraded fields (Settle et al. Citation1996; Maeda Citation2001; Nishihara et al. Citation2006; Samways et al. Citation2010). Studies may also investigate at what rate fields intensively treated with pesticides will be recolonized by aquatic fauna (and with what consequences on rice productivity) if the fields are reverted to pesticide-free or low-pesticide uses. Moreover, pesticide-free ‘conservation zones’ may not only be valuable for the preservation of beneficial species. Provided that noxious species with a high turnover rate (e.g. mosquitoes) can develop resistances against synthetic pesticides, wetland refuges could potentially contribute in safeguarding the gene pools that retain pesticide sensitivity (Overgaard Citation2006).
Natural insecticides can reportedly prevent outbreaks of pests such as BPH, via direct chemical effects on pests as well as relative ineffectiveness on natural enemy populations (Saengpukdee et al. Citation2011). Natural insecticides seem to be particularly efficient during dry periods when chemicals are less likely to be washed off the plants by rains. More research on the delicate checks and balances among pests, predators, and chemicals may lead to much improved pest management strategies with no needs to rely on synthetics. Outbreak of GAS populations often occurs in association with floods. Here too, a better understanding of GAS ecology may lead to a better risk management including improved management of invasion barriers and more focused applications of chemicals in time and space, whereas tea seed powder may be effective with comparatively low impacts on the environment. The invasion of GAS provides a reminder of the importance to conserve native biodiversity: further introductions of alien species are likely to occur in future, and their spread and damage may best be mitigated via controls through native fauna (Leung & Mandrak Citation2007). Under the current conditions an intermediate path, incorporating genuine ecological approaches as also promoted in other countries (Scherr and McNeely Citation2008) may likely be a suitable approach in order to sustain productivity whilst also preserving the options offered by the rich diversity of species which used to populate the rice fields.
Supplemental material
Supplemental appendices relating to this article are available online at http://dx.doi.org/10.1080/21513732.2014.892029, including Tables A1–A6, B1–B3, D1–D8 and Figure C1.
TBSM Supplemental material. Tables A1-A6, B1-B6, D1-D8 and Figure C1
Download MS Word (216.6 KB)Acknowledgments
Data collection, including species identification and laboratory analyses, was done by S. Maneepitak. Data management, analyses, and the write-up of the manuscript was done by R. Cochard and S. Maneepitak collaboratively. P. Kumar was instrumental for study planning, laboratory analyses, species identification, and he helped in the interpretation of results. The authors gratefully acknowledge the assistance of various persons. Ms. Sumana Maneepitak provided valuable help during data collection. Mr. Sawat Attainthee and Mr. Jamrus Rotjarean provided logistical support during the field surveys. Ms. Sirinthip Pholmas (Aquaculture and Aquatic Research Management, AIT) helped with the lab analysis. Mr. Pichet Plaipetch (Coastal Aquatic Feed Research Institute, Fisheries Department) was of assistance for fish species identifications. Dr. Damien Jourdain and Dr. Ganesh Shivakoti (AIT) provided useful comments during study preparation and on the manuscript. Funding for this research was provided by the Asian Institute of Technology (AIT).
Related Research Data
References
- Aditya G, Pal S, Saha GK. 2010. An assessment of fish species assemblages in rice fields in West Bengal, India: implications for management. J Appl Ichthyol. 26:535–539. doi:10.1111/j.1439-0426.2010.01460.x
- Ali A, Xue R-D, Alam SK. 1997. Ecotoxicological effects of abamectin (MK-936) on natural populations of selected invertebrates in man-made ponds. Med Entomol Zool. 48:233–241.
- Bambaradeniya CNB, Edirisinghe JP, De Silva DN, Gunatilleke CVS, Ranawana KB, Wijekoo S. 2004. Biodiversity associated with an irrigated rice agro-ecosystem in Sri Lanka. Biodivers Conserv. 13:1715–1753. doi:10.1023/B:BIOC.0000029331.92656.de
- Bazzanti M, Coccia C, Dowgiallo MG. 2010. Microdistribution of macroinvertebrates in a temporary pond of Central Italy: taxonomic and functional analyses. Limnologica Integr Ecol Manag Inland Waters. 40:291–299. doi:10.1016/j.limno.2009.10.006
- Bird Conservation Society of Thailand. 2012. A manual for Asian water birds censuses. Bangkok: Bird Conservation Society of Thailand. Thai.
- Boonmee S. 1991. Taxonomy and ecology of euglenoids from Thung Kula Ronghai (Thailand). Paper presented at: 29th Kasetsart University Annual Conference; 1991 Feb 4–7; Bangkok, Thailand. Thai.
- Boonsoong B, Sangpradub N. 2008. Diversity of stream benthic macroinvertebrates at the Loei River and adjacent catchments, Northeastern Thailand. Khon Kaen U Sci J. 36:107–121.
- Boonstra H, Reichman EP, van den Brink PJ. 2011. Effects of the veterinary pharmaceutical Ivermectin in indoor aquatic microcosms. Arch Environ Contam Toxicol. 60:77–89. doi:10.1007/s00244-010-9526-1
- Braun AS, Novelli A, Vieira BH, Espindola ELG. 2012. Ecotoxicological effects of Vertimec® 18EC on plankton. J Braz Soc Ecotoxicol. 7:23–29. doi:10.5132/jbse.2012.02.004
- Cagauan AG. 1995. The impact of pesticides on rice field vertebrates with emphasis on fish. In: Pingali PL, Roger PA, editors. Impact of pesticides on farmer health and the rice environment. Dordrecht: Kluwer Academic Publishers; p. 203–248.
- Camargo JA, Alonso Á. 2006. Ecological and toxicological effects of inorganic nitrogen pollution in aquatic ecosystems: a global assessment. Environ Int. 32:831–849. doi:10.1016/j.envint.2006.05.002
- Capkin E, Altinok I, Karahan S. 2006. Water quality and fish size affect toxicity of endosulfan, an organochlorine pesticide, to rainbow trout. Chemosphere. 64:1793–1800. doi:10.1016/j.chemosphere.2005.12.050
- Carlsson NOL, Brönmark C, Hansson L-A. 2004. Invading herbivory: the golden apple snail alters ecosystem functioning in Asian wetlands. Ecology. 85:1575–1580. doi:10.1890/03-3146
- Chan S, Crosby MJ, Islam MZ, Tordoff AW. 2004. Important bird areas in Asia: key sites for conservation. London: BirdLife International.
- Chang K-H, Sakamoto M, Ha J-Y, Miyabara Y, Nakano S, Doi H, Hanazato T. 2011. Response of the plankton community to herbicide application (triazine herbicide, simetryn) in a eutrophicated system: short-term exposure experiment using microcosms. Limnology. 12:11–16. doi:10.1007/s10201-010-0317-1
- Chatterjee S, Hadi AS. 1988. Sensitivity analysis in linear regression. New York: John Wiley and Sons.
- Chatterjee S, Hadi AS, Price B. 2000. Regression analysis by examples. New York: John Wiley and Sons.
- Chittipun S, Pholpunthin P, Sanoamuang L. 2007. Species composition of zooplankton in paddy fields of Pathum Thani Province, Thailand. Bangkok: Thailand Research Fund. Thai.
- Crosslands NO. 1982. Aquatic toxicology of cypermethrin. II. Fate and biological effects in pond experiments. Aquatic Toxicol. 2:205–222. doi:10.1016/0166-445X(82)90025-X
- Cuppen JGM. 1986. On the habitats, distribution and life-cycles of the Western European species of the genus Helochares Mulsant (Coleoptera: Hydrophilidae). Hydrobiologia. 131:169–183. doi:10.1007/BF00006780
- Daam MA, Crum SJ, van den Brink PJ, Nogueira AJ. 2008. Fate and effects of the insecticide chlorpyrifos in outdoor plankton-dominated microcosms in Thailand. Environ Toxicol Chem. 27:2530–2538. doi:10.1897/07-628.1
- Day KE. 1989. Acute, chronic and sublethal effects of synthetic pyrethroids on freshwater zooplankton. Environ Toxicol Chem. 8:411–416. doi:10.1002/etc.5620080507
- Debenest T, Pinelli E, Coste M, Silvestre J, Mazzella N, Madigou C, Delmas F. 2009. Sensitivity of freshwater periphytic diatoms to agricultural herbicides. Aquatic Toxicol. 93:11–17. doi:10.1016/j.aquatox.2009.02.014
- Downing JA, Rigler FH. 1984. A manual on methods for the assessment of secondary productivity in freshwater. 2nd ed. Oxford: Blackwell Scientific publication.
- Duttagupta S, Gupta S, Gupta A. 2004. Euglenoid blooms in the floodplain wetlands of Barak Valley, Assam, Northeastern India. J Environ Biol. 25:369–373.
- Elphick CS, Baicich P, Parsons KC, Fasola M, Mugica L. 2010. The future for research on waterbirds in rice fields. Waterbirds. 33:231–243. doi:10.1675/063.033.s117
- Extoxnet. 2012. Pesticide information profile [Internet]. Ithaca: Cornell University, Extension Toxicology Network; [cited 2012 Aug 10]. Available from: http://pmep.cce.cornell.edu/profiles/extoxnet/24d-captan/index.html
- Farm Chemicals International. 2012. Crop protection database [Internet]. Cordova (TN): Cotton Media Group, Farm Chemicals International; [cited 2012 Aug 10]. Available from: http://www.farmchemicalsinternational.com/crop-protection-database/
- Friberg-Jensen U, Wendt-Rasch L, Woin P, Christoffersen K. 2003. Effects of the pyrethroid insecticide, cypermethrin, on a freshwater community studied under field conditions. I. Direct and indirect effects on abundance measures of organisms at different trophic levels. Aquatic Toxicol. 63:357–371. doi:10.1016/S0166-445X(02)00201-1
- Ghosh BC, Bhat R. 1998. Environmental hazards of nitrogen loading in wetland rice fields. Environ Pollut. 102:123–126. doi:10.1016/S0269-7491(98)80024-9
- González-Doncel M, Fernández-Torija C, Hinton DE, Tarazona JV. 2004. Stage-specific toxicity of cypermethrin to medaka (Oryzias latipes) eggs and embryos using a refined methodology for an in vitro fertilization bioassay. Arch Environ Contam Toxicol. 48:87–98. doi:10.1007/s00244-003-0223-1
- Halwart M. 2006. Biodiversity and nutrition in rice-based aquatic ecosystems. J Food Composition Anal. 19:747–751. doi:10.1016/j.jfca.2006.03.012
- Halwart M, Borlinghaus M, Kaule G. 1996. Activity patterns of fish in rice fields. Aquaculture. 146:169–170.
- Heckman CW. 1974. The seasonal succession of species in a rice paddy in Vientiane, Laos. Int. Rev. Ges. Hydrobio. Hydrograph. 59:489–507. doi:10.1002/iroh.19740590403
- Heckman CW. 1979. Rice field ecology in northeast Thailand. Monog Biol. 34:1–228.
- Hesler LS, Grigarick AA, Oraze MJ, Palrang AT. 1993. Arthropod fauna of conventional and organic rice fields in California. J Econ Entomol. 86:149–158.
- Hilty J, Merenlender A. 2000. Faunal indicator taxa selection for monitoring ecosystem health. Biol Conserv. 92:185–197. doi:10.1016/S0006-3207(99)00052-X
- Hossain MZ, Choudhury MHK, Hossain MF, Alam QK. 2002. Effects of ecological agriculture on soil properties and arthropod diversity in rice-based cropping systems in floodplain areas in Bangladesh. Biol Agric Hortic. 20:215–227. doi:10.1080/01448765.2002.9754966
- Hwang Y-S, Kramer WL, Mulla MS. 1980. Oviposition attractants and repellents of mosquitoes. J Chem Ecol. 6:71–80. doi:10.1007/BF00987528
- Ibáñez C, Curcó A, Riera X, Ripoll I, Sánchez C. 2010. Influence on birds of rice field management practices during the growing season: a review and an experiment. Waterbirds. 33:167–180. doi:10.1675/063.033.s113
- Iguchi K, Kitano S. 2008. Local specialists among endangered populations of medaka, Oryzias latipes, harboring in fragmented patches. Environ Biol Fish. 81:267–276. doi:10.1007/s10641-007-9198-5
- INCHEM. 2012. Chemical safety information from intergovernmental organizations [Internet]. Geneva: International Programme on Chemical safety IPCS; [cited 2012 Aug 20]. Available from: http://www.inchem.org/
- Janardan SK, Olson CS, Schaeffer DJ. 1984. Quantitative comparisons of acute toxicity of organic chemicals to rat and fish. Ecotoxicol Environ Saf. 8:531–539. doi:10.1016/0147-6513(84)90013-7
- Jančula D, Gregorová J, Maršálek B. 2010. Algicidal and cyanocidal effects of selected isoquinoline alkaloids. Aquacult Res. 41:598–601. doi:10.1111/j.1365-2109.2009.02342.x
- Janekitkan S. 2009. Diversity of fish species in inland waters. Bangkok: Faculty of Fisheries, Kasetsart University. Thai.
- Katano O, Hosoya K, Iguchi K, Yamaguchi M, Aonuma Y, Kitano S. 2003. Species diversity and abundance of freshwater fishes in irrigation ditches around rice fields. Environ Biol Fishes. 66:107–121. doi:10.1023/A:1023678401886
- Kim Y, Jung J, Oh S, Choi K. 2008. Aquatic toxicity of cartap and cypermethrin to different life stages of Daphnia magna and Oryzias latipes. J Environ Sci Health Part B. 43:56–64. doi:10.1080/03601230701735029
- Koodalingam A, Mullainadhan P, Arumugam M. 2009. Antimosquito activity of aqueous kernel extract of soapnut Sapindus emarginatus: impact on various developmental stages of three vector mosquito species and nontarget aquatic insects. Parasitol Res. 105:1425–1434. doi:10.1007/s00436-009-1574-y
- Kreutzweiser DP, Back RC, Sutton TM, Thompson DG, Scarr TA. 2002. Community-level disruptions among zooplankton of pond mesocosms treated with a neem (azadirachtin) insecticide. Aquatic Toxicol. 56:257–273. doi:10.1016/S0166-445X(01)00216-8
- Kreutzweiser DP, Capell SS, Scarr TA. 1999. Acute lethal and sublethal effects of a neem-based insecticide on nontarget aquatic insects in stream channels. Bull Environ Contam Toxicol. 63:365–371. doi:10.1007/s001289900989
- Larson DJ. 1997. Habitat and community patterns of tropical Australian Hydradephagan water beetles (Coleoptera: Dytiscidae, Gyrinidae, Noteridae). Aust J Entomol. 36:269–285. doi:10.1111/j.1440-6055.1997.tb01469.x
- Lawler SP. 2001. Rice fields as temporary wetlands: a review. Isr J Zool. 47:513–528. doi:10.1560/X7K3-9JG8-MH2J-XGX1
- Leedale GF. 1967. Euglenoid flagellates. Englewood Cliffs: Prentice-Hall.
- Legrand C, Rengefors K, Fistarol GO, Granéli E. 2003. Allelopathy in phytoplankton-biochemical, ecological and evolutionary aspects. Phycologia. 42:406–419. doi:10.2216/i0031-8884-42-4-406.1
- Leitão S, Pinto P, Pereira T, Brito MF. 2007. Spatial and temporal variability of macroinvertebrate communities in two farmed Mediterranean rice fields. Aquat Ecol. 41:373–386. doi:10.1007/s10452-007-9082-6
- Lekagul B, Round PD. 2005. A guide to the birds of Thailand. 2nd ed. Bangkok: Saha Karn Bhaet Group.
- Lekprayoon C, Fuangarworn M, Mongkolchichana E. 2007. The water bugs (Hemiptera: Heteroptera) from the western Thong Pha Phum project area, Kanchanaburi Province, Thailand. Biodiversity Research and Training Program Research Reports: Western Thong Pha Phum. Biodiversity Research and Training Program. Bangkok: Chulalongkorn University; p. 38–51.
- Leung B, Mandrak NE. 2007. The risk of establishment of aquatic invasive species: joining invasibility and propagule pressure. Proc Royal Soc B Biol Sci. 274:2603–2609. doi:10.1098/rspb.2007.0841
- Liess M, Schäfer RB, Schriever CA. 2008. The footprint of pesticide stress in communities – species traits reveal community effects of toxicants. Sci Total Environ. 406:484–490. doi:10.1016/j.scitotenv.2008.05.054
- Little DC, Surintaraseree P, Innes-Taylor N. 1996. Fish culture in rainfed rice fields of northeast Thailand. Aquaculture. 140:295–321. doi:10.1016/0044-8486(95)01208-7
- López-Mancisidor P, Carbonell G, Fernández C, Tarazona JV. 2008. Ecological impact of repeated applications of chlorpyrifos on zooplankton community in mesocosms under Mediterranean conditions. Ecotoxicology. 17:811–825. doi:10.1007/s10646-008-0239-4
- Ma J. 2002. Differential sensitivity to 30 herbicides among populations of two green algae Scenedesmus obliquus and Chlorella pyrenoidosa. B Environ Contam Tox. 68:275–281.
- Maeda T. 2001. Patterns of bird abundance and habitat use in rice fields of the Kanto Plain, central Japan. Ecol Res. 16:569–585. doi:10.1046/j.1440-1703.2001.00418.x
- Magurran AE. 2003. Measuring biological diversity. Oxford: Blackwell.
- Maneepitak S, Cochard R. 2014. Uses, toxicity levels and environmental impacts of synthetic and natural pesticides in rice fields – a survey from Central Thailand. Int J Biodiv Ecosyst Serv Manage. [This issue, companion paper TBSM-2013-0024.R2].
- Matteson PC. 2000. Insect pest management in tropical Asian irrigated rice. Annu Rev Entomol. 45:549–574. doi:10.1146/annurev.ento.45.1.549
- Mccall PJ, Eaton G. 2001. Olfactory memory in the mosquito Culex quinquefasciatus. Med Vet Entomol. 15:197–203. doi:10.1046/j.0269-283x.2001.00304.x
- Moraes BS, Loro VL, Pretto A, da Fonseca MB, Menezes C, Marchesa E, Reimche GB, de Avila LA. 2009. Toxicological and metabolic parameters of the teleost fish (Leporinus obtusidens) in response to commercial herbicides containing clomazone and propanil. Pestic Biochem Physiol. 95:57–62. doi:10.1016/j.pestbp.2009.06.006
- Mukai Y, Ishii M. 2007. Habitat utilization by the giant water bug, Appasus (=Diplonychus) major (Hemiptera: Belostomatidae), in a traditional rice paddy water system in northern Osaka, central Japan. Appl Entomol Zool. 42:595–605. doi:10.1303/aez.2007.595
- Mulderij G. 2006. Chemical warfare in freshwater [dissertation]. Wageningen: Institute of Ecology, Wageningen University.
- Mullié WC, Verwey PJ, Berends AG, Séne F, Koeman JH, Everts JW. 1991. The impact of Furadan 3G (carbofuran) applications on aquatic macroinvertebrates in irrigated rice in Senegal. Arch Environ Contam Toxicol. 20:177–182. doi:10.1007/BF01055902
- Munawar M. 1972. Ecological studies of Euglenineae in certain polluted and unpolluted environments. Hydrobiologia. 39:307–320. doi:10.1007/BF00046647
- Murty AS. 1986. Toxicity of pesticides to fish. Boca Raton: CRC Press.
- Nishihara S, Karube H, Washitani I. 2006. Status and conservation of diving beetles inhabiting rice paddies. Jap J Cons Ecol. 11:143–157.
- Nurhasan M, Maehre HK, Malde MK, Stormo S, Halwart M, James D, Elvevoll EO. 2010. Nutritional composition of aquatic species in Laotian rice field ecosystems. J Food Comp Anal. 23:205–213. doi:10.1016/j.jfca.2009.12.001
- Office of Agricultural Economics. 2008. Inequality in the agricultural sector in the year 2006. Bangkok: Office of Agricultural Economics, Bureau of Agricultural Economic Research, Ministry of Agriculture and Cooperatives. Thai.
- Ohba S-Y, Huynh TTT, Le LL, Ngoc HT, Hoang SL, Takagi M. 2011. Mosquitoes and their potential predators in rice agroecosystems of the Mekong Delta, Southern Vietnam. J Am Mosquito Control Assoc. 27:384–392. doi:10.2987/11-6163.1
- Oliveira-Filho EC, Paumgartten FJ. 2000. Toxicity of Euphorbia milii latex and niclosamide to snails and nontarget aquatic species. Ecotoxicol Environ Saf. 46:342–350. doi:10.1006/eesa.2000.1924
- Overgaard H. 2006. Malaria mosquito resistance to agricultural insecticides: risk area mapping in Thailand. Colombo: International Water Management Institute. (IMWI Research Report 103).
- Park MH, Han MS, Ahn CY, Kim HS, Yoon BD, Oh HM. 2006. Growth inhibition of bloom-forming cyanobacterium Microcystis aeruginosa by rice straw extract. Lett Appl Microbiol. 43:307–312. doi:10.1111/j.1472-765X.2006.01951.x
- Parsons KC, Mineau P, Renfrew RB. 2010. Effects of pesticide use in rice fields on birds. Waterbirds. 33:193–218. doi:10.1675/063.033.s115
- Pathak MD, Khan ZR. 1994. Insect pests of rice. Manila: International Rice Research Institute.
- Perschbacher PW, Ludwig GM. 2004. Effects of diuron and other aerially applied cotton herbicides and defoliants on the plankton communities of aquaculture ponds. Aquaculture. 233:197–203. doi:10.1016/j.aquaculture.2003.09.029
- Pesticide Action Network North America. 2012. Pesticide database [Internet]. San Francisco: Pesticide Action Network North America; [cited 2012 Aug 18]. Available from: http://www.pesticideinfo.org/
- Petroski RJ, Stanley DW. 2009. Natural compounds for pest and weed control. J Agric Food Chem. 57:8171–8179. doi:10.1021/jf803828w
- Phommi T. 2011. Aquatic insects and water quality in rice fields during a crop cycle. Veridian E-Journal, Silpakorn University. 4:1–17. Thai.
- Ponnusamy L, Wesson DM, Arellano C, Schal C, Apperson CS. 2010. Species composition of bacterial communities influences attraction of mosquitoes to experimental plant infusions. Microbial Ecol. 59:158–173. doi:10.1007/s00248-009-9565-1
- Rahman MM, Jewel MAS, Khan S, Haque MM. 2007. Study of euglenophytes bloom and it’s impact on fish growth in Bangladesh. Algae Inchon. 22:185–192. doi:10.4490/ALGAE.2007.22.3.185
- Rainboth WJ. 1996. Fishes of the Cambodian Mekong. FAO species identification field guide for fishery purposes. Rome: Food and Agriculture Organization.
- Rakshit SK, Loan NT, Johnsen S. 1999. Fate of blue-green algae in the food web of flooded rice-field ecosystems. Biol Fertil Soils. 29:141–145. doi:10.1007/s003740050536
- Ramakrishnan B, Megharaj M, Venkateswarlu K, Naidu R, Sethunathan N. 2010. The impacts of environmental pollutants on microalgae and cyanobacteria. Crit Rev Environ Sci Technol. 40:699–821. doi:10.1080/10643380802471068
- Relyea RA. 2005. The impact of insecticides and herbicides on the biodiversity and productivity of aquatic communities. Ecol Appl. 15:618–627. doi:10.1890/03-5342
- Relyea R, Hoverman J. 2006. Assessing the ecology in ecotoxicology: a review and synthesis in freshwater systems. Ecol Lett. 9:1157–1171. doi:10.1111/j.1461-0248.2006.00966.x
- Resetarits WJ, Binckley CA. 2009. Spatial contagion of predation risk affects colonization dynamics in experimental aquatic landscapes. Ecology. 90:869–876. doi:10.1890/08-0613.1
- Richardson AJ, Taylor IR. 2003. Are rice fields in Southeastern Australia an adequate substitute for natural wetlands as foraging areas for egrets? Waterbirds. 26:353–363. doi:10.1675/1524-4695(2003)026[0353:ARFISA]2.0.CO;2
- Rizo-Patrón FV, Kumar A, McCoy Colton MB, Springer M, Trama FA. 2013. Macroinvertebrate communities as bioindicators of water quality in conventional and organic irrigated rice fields in Guanacaste, Costa Rica. Ecol Indic. 29:68–78. doi:10.1016/j.ecolind.2012.12.013
- Roger PA. 1995. The impact of pesticides on wetland rice field microflora: a review. In: Pingali PL, Roger PA, editors. Impact of pesticides on farmer health and the rice environment. Dordrecht: Kluwer Academic Publishers.
- Roger PA, Bhuiyan SI. 1995. Behaviour of pesticides in rice-based agroecosystems: a review. In: Pingali PL, Roger PA, editors. Impact of pesticides on farmer health and the rice environment. Dordrecht: Kluwer Academic Publishers.
- Rohr JR, Crumrine PW. 2005. Effects of an herbicide and an insecticide on pond community structure and processes. Ecol Appl. 15:1135–1147. doi:10.1890/03-5353
- Rubach MN, Crum SJH, van den Brink PJ. 2011. Variability in the dynamics of mortality and immobility responses of freshwater arthropods exposed to chlorpyrifos. Arch Environ Contam Toxicol. 60:708–721. doi:10.1007/s00244-010-9582-6
- Saengpukdee K, Kaipun W, Pholwan P, Siriyan S, Lueangsakul S. 2011. The study on the results of natural products for protecting insect pests of rice and the amount of insect natural enemies in organic rice production. Bangkok: Institute of Environment and Resources, Srinakharinwirot University. Thai.
- Saijo H. 2001. Seasonal prevalence and migration of aquatic insects in paddies and an irrigation pond in Shimane Prefecture. Japan J Ecol. 51:1–11.
- Saikia SK, Das DN. 2009. Feeding ecology of common carp (Cyprinus carpio L.) in a rice-fish culture system of the Apatani plateau (Arunachal Pradesh, India). Aquat Ecol. 43:559–568. doi:10.1007/s10452-008-9174-y
- Samways MJ, McGeoch MA, New TR. 2010. Insect conservation. A handbook of approaches and methods. Oxford: Oxford University Press.
- Sánchez-Bayo F. 2006. Comparative acute toxicity of organic pollutants and reference values for crustaceans. I. Branchiopoda, Copepoda and Ostracoda. Environ Pollut. 139:385–420. doi:10.1016/j.envpol.2005.06.016
- Savary S, Willocquet L, Elazegui FA, Castilla NP, Teng PS. 2000. Rice pest constraints in tropical Asia: quantification of yield losses due to rice pests in a range of production situations. Plant Dis. 84:357–369. doi:10.1094/PDIS.2000.84.3.357
- Scherr SJ, McNeely JA. 2008. Biodiversity conservation and agricultural sustainability: towards a new paradigm of ‘ecoagriculture’ landscapes. Philos Trans R Soc B Biol Sci. 363:477–494. doi:10.1098/rstb.2007.2165
- Scott IM, Kaushik NK. 1998. The toxicity of Margosan-O, a product of neem seeds, to selected target and nontarget aquatic invertebrates. Arch Environ Contam Toxicol. 35:426–431. doi:10.1007/s002449900398
- Settle WH, Ariawan H, Astuti ET, Cahyana W, Hakim AL, Hindayana D, Lestari AS. 1996. Managing tropical rice pests through conservation of generalist natural enemies and alternative prey. Ecology. 77:1975–1988. doi:10.2307/2265694
- Shaalan EA, Canyon D, Younes MWF, Abdel-Wahab H, Mansour A-H. 2005. A review of botanical phytochemicals with mosquitocidal potential. Environ Int. 31:1149–1166. doi:10.1016/j.envint.2005.03.003
- Shams N. 2007. Contribution of rice field ecosytems to food security strategies in Northwest Cambodia. J Sustain Agric. 29:109–133. doi:10.1300/J064v29n04_09
- Sheeba Jasmine RS, Kuttalam S, Stanley J. 2008. Acute toxicity of abamectin to fishes, Cyprinus carpio Linnaeus and Tilapia mosambica Peters. Asian J Biol Sci. 3:127–129.
- Sidthimunka A. 1973. Length-weight relationships of freshwater fishes of Thailand. Auburn: International Center for Aquaculture Research and Development.
- Simpson IC, Roger PA. 1995. The impact of pesticides on non-target aquatic invertebrates in wetland rice fields: a review. In: Pingali PL, Roger PA, editors. Impact of pesticides on farmer health and the rice environment. Dordrecht: Kluwer Academic Publishers; p. 249–270.
- Slack HD. 1947. Feeding mechanism of water-bugs. Nature. 159:605. doi:10.1038/159605a0
- Spencer D, Lembi C, Blank R. 2006. Spatial and temporal variation in the composition and biomass of algae present in selected California rice fields. J Freshwater Ecol. 21:649–656. doi:10.1080/02705060.2006.9664126
- Srirattanasak W, Pattarasuthi R, Jaowantana N, Patirupanusorn P, Ritmontri T, Sengsim P. 2007. Insect pests of rice. Bangkok: Office of Rice Research and Development, Department of Rice. Thai.
- Suárez-Serrano A, Ibáñez C, Lacorte S, Barata C. 2010. Ecotoxicological effects of rice field waters on selected planktonic species: comparison between conventional and organic farming. Ecotoxicology. 19:1523–1535. doi:10.1007/s10646-010-0537-5
- Sundar KSG. 2006. Flock size, density and habitat selection of four large waterbird species in an agricultural landscape in Uttar Pradesh, India: implications for management. Waterbirds. 29:365–374.
- Terazaki M, Tharnbuppa P, Nakayama Y. 1980. Eradication of predatory fishes in shrimp farms by utilization of Thai tea seed. Aquaculture. 19:235–242. doi:10.1016/0044-8486(80)90047-2
- Tišler T, Eržen NK. 2006. Abamectin in the aquatic environment. Ecotoxicology. 15:495–502. doi:10.1007/s10646-006-0085-1
- Traas TP, Janse JH, Aldenberg T, Brock TCM. 1998. A food web model for fate and direct and indirect effects of Dursban® 4E (active ingredient chlorpyrifos) in freshwater microcosms. Aquat Ecol. 32:179–190. doi:10.1023/A:1009920226083
- Tramboo SM, Yousuf AR, Akbar S. 2011. Oxidative stress-inducing potential of butachlor in a freshwater fish, Cyprinus carpio (L). Toxicol Environ Chem. 93:285–295. doi:10.1080/02772248.2010.515413
- Trekels H, van de Meutter F, Stoks R. 2011. Habitat isolation shapes the recovery of aquatic insect communities from a pesticide pulse. J Appl Ecol. 48:1480–1489. doi:10.1111/j.1365-2664.2011.02053.x
- Trexler JD, Apperson CS, Zurek L, Gemeno C, Schal C, Kaufmann M, Walker E, Watson DW, Wallace L. 2003. Role of bacteria in mediating the oviposition responses of Aedes albopictus (Diptera: Culicidae). J Med Entomol. 40:841–848. doi:10.1603/0022-2585-40.6.841
- Tu W, Niu L, Liu W, Xu C. 2013. Embryonic exposure to butachlor in zebrafish (Danio rerio): endocrine disruption, developmental toxicity and immunotoxicity. Ecotoxicol Environ Saf. 89:189–195. doi:10.1016/j.ecoenv.2012.11.031
- Uchida Y, Inoue M. 2010. Fish species richness in spring-fed ponds: effects of habitat size versus isolation in temporally variable environments. Freshwater Biol. 55:983–994. doi:10.1111/j.1365-2427.2009.02335.x
- Van den Brink PJ, Hartgers EM, Gylstra R, Bransen F, Brock TCM. 2002. Effects of a mixture of two insecticides in freshwater microcosms: II. Responses of plankton and ecological risk assessment. Ecotoxicology. 11:181–197.
- Victor TJ, Reuben R. 2000. Effects of organic and inorganic fertilisers on mosquito populations in rice fields of southern India. Med Vet Entomol. 14:361–368. doi:10.1046/j.1365-2915.2000.00255.x
- Vonesh JR, Kraus JM. 2009. Pesticide alters habitat selection and aquatic community composition. Oecologia. 160:379–385. doi:10.1007/s00442-009-1301-5
- Vongrat L. 2000. Zooplankton. Bangkok: Kasetsart University Publisher. Thai.
- Vongrat L. 2002. Phytoplankton. Bangkok: Kasetsart University Publisher. Thai.
- Walker ED, Olds EJ, Merritt RW. 1988. Gut content analysis of mosquito larvae (Diptera: Culicidae) using DAPI stain and epifluorescence microscopy. J Med Entomol. 25:551–554.
- Wang B, Shimazu M. 2006. Density dynamics of an entomopathogenic fungus, Beauveria bassiana, introduced into fresh water. B For For Prod Res Ins Ibaraki. 5:227–233.
- Wilson AL, Watts RJ, Stevens MM. 2008. Effects of different management regimes on aquatic macroinvertebrate diversity in Australian rice fields. Ecol Res. 23:565–572. doi:10.1007/s11284-007-0410-z
- Wirasith C, Traichaiyaporn S, Waraegsiri B, Jiazhang C. 2011. Water quality and algae succession in integrated fish ponds. J Agr Tech. 7:1633–1645.
- World Health Organization. 2010. The WHO recommended classification of pesticides by hazard and guideline to classification 2009. International Programme on Chemical Safety, World Health Organization. Stuttgart: Wissenschaftliche Verlagsgesellschaft GmbH.
- XiZhen W, HongDa L. 2009. Acute toxic effect of abamectin on fresh-water aquatic animals. J Environ Health. 26:593–587.
- Zargar MY, Dar GH. 1990. Effect of benthiocarb and butachlor on growth and nitrogen fixation by cyanobacteria. Bull Environ Contam Toxicol. 45:232–234. doi:10.1007/BF01700189
- Zimba PV, Moeller PD, Beauchesne K, Lane HE, Triemer RE. 2010. Identification of euglenophycin–A toxin found in certain euglenoids. Toxicon. 55:100–104. doi:10.1016/j.toxicon.2009.07.004
- Zimmermann G. 2007. Review on safety of the entomopathogenic fungi Beauveria bassiana and Beauveria brongniartii. Biocontrol Sci Technol. 17:553–596. doi:10.1080/09583150701309006