
ABSTRACT
Biodiversity is the foundation of life-support systems on earth and underpins the delivery of ecosystem services (ES) important for human well-being. The loss of biodiversity worldwide, however, remains one of the most daunting challenges. Among the major causes of biodiversity loss is habitat loss due to transformation of land to agricultural, mining and urban areas. We applied the Integrated Valuation of Ecosystem Services and Trade-offs (InVEST) biodiversity modelling tool to assess the condition of habitats to support the delivery of ES in a biosphere reserve (BR) in South Africa. Results indicated that 72% of the surveyed habitats were of high quality to provide the necessary services. However, some of the habitats were found to be affected by threats as follows: low (0–20%) to moderate (20–32%) habitat loss was recorded in habitats adjacent to mining and plantation areas, and high (32–56%) to severe (56–95%) habitat loss was recorded in habitats in close proximity to urban and cultivated areas. At least 56% of the vegetation types found in the study area were threatened by transformation to agriculture, mining and urban areas. We strongly recommend that existing biodiversity policies and legislation should be enforced to avoid habitat loss and degradation.
EDITED BY Rudolf de Groot
1. Introduction
The protection of biodiversity is an international obligation, with approximately 200 nations committing to it (CBD Citation1992). The term biodiversity originates from the concept of biological diversity, which was coined during the twentieth century (Dasmann Citation1968; Soule et al. Citation1980) and has been in use for almost three decades (Wilson & Peter Citation1988; Bibby et al. Citation1992; Eldredge Citation1992; Harper & Hawksworth Citation1994; Gaston Citation1996). There are several definitions of biodiversity (CBD Citation1992; MA Citation2005; IUCN Citation2010). Our study adopted the Millennium Ecosystem Assessment’s (MA) (Citation2005) definition which is ‘the diversity of life on Earth’ and ‘an essential component that contribute[s] to the functioning of ecosystems that underpin the provisioning of ecosystem services (ES) that ultimately affect human well-being’. We adopted the MA definition because of its association with the supply of ES.
Sound conservation strategies are needed to effectively protect biodiversity. A protected areas (PAs) system was established with the primary goal of protecting and conserving biodiversity (IUCN Citation2004; Stolton Citation2010; Tallis et al. Citation2011). Despite the presence of conservation strategies such as PAs, biosphere reserves (BRs), stewardship programmes (NPEAS Citation2008; Stolton Citation2010; UNESCO Citation2010; Kurdoğlu & Çokçaliskan Citation2011) and the ongoing commitment of putting more land aside for conservation purposes (CBD Citation2011; Venter et al. Citation2014), the increasing loss of biodiversity remains a daunting challenge facing the world at large (Gurevitch & Padilla Citation2004; MA Citation2005; Rockström et al. Citation2009). Various human-induced threats and forces (Chapin III et al. Citation2000; Díaz et al. Citation2006) continually alter and degrade the environment, causing habitat loss, species extinction and climate change (Wilcove et al. Citation1998; Stuart et al. Citation2000; Scholes & Biggs Citation2004; MA Citation2005; Venter et al. Citation2006). Among these threats are agriculture (Stolton & Dudley Citation1999; Rouget et al. Citation2003; Swift et al. Citation2004; Power Citation2010), urbanisation (Marzluff et al. Citation2001; McKinney Citation2002, Citation2008) and mining developments (Brewer et al. Citation2003; MA Citation2005).
Agriculture is regarded as one of the most severe threats (Stolton & Dundley Citation1999; Rouget et al. Citation2003; MA Citation2005). Evidence suggests that agricultural activities might negatively affect biodiversity and ES (Swift et al. Citation2004; Power Citation2010), among others through high consumption of water (Scholes & Biggs Citation2004; MA Citation2005). The use of pesticides could also kill non-target organisms (Swift et al. Citation2004; Power Citation2010). Other obvious adverse effects of agricultural intensification on biodiversity are the eutrophication of water systems through use of inorganic fertilizers; reduction in the diversity of organisms responsible for nutrient cycling as well as ground water pollution (Scholes & Biggs Citation2004; Swift et al. Citation2004; Bukola et al. Citation2015).
Urbanisation refers to an increase in the number of cities and size of populations (Uttara et al. Citation2012). A number of researchers have raised concerns about the impact of urbanisation on biodiversity (Marzluff et al. Citation2001; McKinney Citation2002, Citation2008; Uttara et al. Citation2012). Urbanisation has been found to adversely affect biodiversity and ES through indigenous species’ extinction and habitat loss (Marzluff et al. Citation2001; McKinney Citation2002, Citation2008) as well as the removal of indigenous vegetation (Uttara et al. Citation2012).
Although industrial developments such as mining are seen as a quick solution to economic growth (Turner Citation2012), these kinds of land use (LU) come with a cost to the natural environment (IUCN Citation2011a, Citation2011b). Mining may result in habitat destruction due to removal of vegetation (Ashton et al. Citation2001; Phillips Citation2001) and high consumption of water and other natural resources (Brewer et al. Citation2003; DWAF Citation2004; MA Citation2005). Mining activities have been found to degrade and alter both terrestrial and aquatic habitats, causing a decline in the abundance of indigenous species (Ashton et al. Citation2001; Phillips Citation2001). Many world heritage sites and PAs around the world have been negatively affected by various activities related to mining (Turner Citation2012). IUCN (Citation2011a, Citation2011b) found that mining threatened at least 25% of PAs in West Africa. Osti et al. (Citation2011) found that 27% of World Heritage sites in Sub-Saharan Africa were threatened with oil and gas mining. This situation presents a major challenge in dealing with a threat whose solution is beyond the employment of conservation strategies such as PAs.
Perhaps what the above-mentioned forms of LU have in common is the effect on habitats (MA Citation2005; McKinney Citation2008; Power Citation2010; Uttara et al. Citation2012). Examples of LU effects on habitat quality include various types of pollution and vegetation removal associated with agriculture, urban developments and mining activities (Ashton et al. Citation2001; Czech et al. Citation2000; Rouget et al. Citation2003; Power Citation2010; Uttara et al. Citation2012). A habitat can be defined as an area’s condition and resources that contribute to the reproduction and the continuous existence of species (Hall et al. Citation1997; Tallis et al. Citation2011). The state of biodiversity in an area can be determined by the condition of its habitat whereas the importance of a habitat depends on its quality. Habitat quality is defined as the environment’s ability and capacity to provide adequate support and conditions to enable the persistence of species (Tallis et al. Citation2011).
A habitat’s role regarding ES is two-fold. The first role is that of being a service itself by, for example, providing refuge for wildlife. The second role is that of being a supporting service that underpins the delivery of other services such as provisioning (e.g., food and water), cultural (e.g., recreation, aesthetic quality) and regulating (e.g., climate regulation, flood regulation) services, according to MA’s (Citation2005) framework. Due to the fact that the most updated classifications of ES (TEEB Citation2010; CICES Citation2011) exclude the supporting service category, this study adopted the MA (Citation2005) framework because it classifies habitat as a supporting service. The MA (Citation2005) further defines ES as the benefits that people derive from ecosystems. However, in the most recent classifications of ES (TEEB Citation2010; CICES Citation2011), ES are defined as contributions of ecosystems to human well-being. What is important to note from these definitions is that humans derive something from ecosystems for their well-being. It is worth mentioning that LU choices result in trade-offs between and among services. For example, the conversion of land from conservation to agriculture may have a negative impact on biodiversity and water resources because of the clearing of land and pollution from chemicals used to intensify agricultural production (Rouget et al. Citation2003; Foley et al. Citation2005).
If managers are to reach their biodiversity conservation goals, they should conduct biodiversity condition/threat assessments (Margoluis & Salafsky Citation2001; Tallis et al. Citation2011). Modelling and biodiversity assessment, which include assessing the impacts of LU on habitat quality in a given area, assist in (1) understanding the patterns of distribution and richness of biodiversity in the landscape, (2) comparison of spatial patterns of biodiversity and ES, (3) identification of synergies and trade-offs across different scales and scenarios and (4) development of strategies for biodiversity conservation (Tallis et al. Citation2011.) Information on habitat quality allows one to make informed decisions about different conservation strategies (Rouget et al. Citation2003) such as conservation area expansion, introduction and removal of species and identification of habitats that provide high ES, as well as types of ES provided by different habitats. Modelling is a useful tool for assessing the impacts of threats on a suite of biodiversity features and ES (Nelson et al. Citation2009; Polasky et al. Citation2011; Kovacs et al. Citation2013; Bhagabati et al. Citation2014).
This study applied the Integrated Valuation of Ecosystem Services and Trade-offs (InVEST) biodiversity habitat quality model described in Tallis et al. (Citation2011) to assess the condition of habitat as an ES and that of providing a supporting service for the delivery of other ES. The model combined information on LU/land cover (LC) and threats to determine the degradation and extent thereof, on different habitat types in a BR. We selected InVEST because: (1) it can provide estimates of the level and value of ES that are provided by a given area and (2) its models are spatially explicit, with a flexible spatial resolution, thereby enabling users to address questions at different scales.
2. Materials and methods
2.1. Study area
A BR consists of different zones representing different kinds of LU. These include conservation areas represented in the core zones, agricultural systems and settlements represented in the buffer and transition zones of a BR. Vhembe Biosphere Reserve (VBR) is the biggest savannah BR in South Africa (SAMABNC Citation2014). It has a good balance of representation in terms of the main LUs such as conservation areas, human settlements, industries and other cooperatives, which included mining developments and agricultural systems. Despite its size of 3,070,000 ha, this study purposefully extended the VBR study area to cover the whole of the northern section of one of the two major core areas, the Kruger National Park and the whole western section up to the end of the existing BR boundary. This extension enabled us to obtain additional information on the status of biodiversity within the VBR and its most important buffer areas.
There are diverse LUs in the study area (Dombo et al. Citation2006). Conservation is one of the dominant forms of LU with about 1,000,000 ha of land under formal protection, including state-owned land (two national parks and provincial reserves) (Dombo et al. Citation2006). Agricultural systems are also well represented in the Vhembe region. Human settlements are fairly well developed and the human population size is about 1,500,000 (Stats SA Citation2012). There is also good diversity of vegetation types in the study area, with more than 30 types represented (Mucina & Rutherford Citation2006).
2.2. Invest biodiversity model
InVEST is a modelling suite that uses LU/LC patterns to estimate values and levels of biodiversity found in a landscape (Tallis et al. Citation2011). The InVEST biodiversity model 2.2.0 as described by Tallis et al. (Citation2011) uses information about threats () to biodiversity together with LU/LC and information on the sensitivity of habitat types to threats () to produce habitat quality and degradation maps, which provide information about the quality and degradation of different types of habitat in an area over time. The LU/LC map for the VBR was derived from a 2009 LU/LC map for South Africa (SANBI Citation2009) which was the most recent one at the time of our study. We selected the InVEST habitat quality modelling tool because it allows for a rapid assessment of the impacts of different threats and LUs on biodiversity and ES (Tallis et al. Citation2011; Guerry et al. Citation2012). More details regarding the InVEST biodiversity quality model are contained in Annexure A.
Table 1. Threat data used to run InVEST.
Table 2. Sensitivity of different habitat types to threats.
2.3. Running the InVEST biodiversity model
The following process was followed in this study to run the InVEST biodiversity model, as described in Tallis et al. (Citation2011):
Step 1 – Creation of workspace
For each InVEST model, including biodiversity and conservation, a separate workspace was created on the computer hard drive. This was followed by the creation of a folder under the workspace where all output files were stored.
Step 2 – Running the model
After completion of step 1, an ArcMap document was opened followed by adding an InVEST toolbox located on the hard drive. This was followed by double-clicking on the biodiversity InVEST toolbox which created an interface where all required values were authorised.
Step 3 – Progress dialogue
The completion of step 2 brought about a dialogue on the interface, which indicated the model running progress. After the model had been run successfully, it produced either an output or an intermediate folder which contained degradation and quality maps with values. The results were viewed on the ArcMap through an add data button (ESRI Citation2013). The maps attribute tables contained degradation and habitat quality values.
3. Results
Among the seven LC types represented in the study area, two were regarded as natural habitats (water bodies and natural areas) and five as transformed habitats (cultivation, mining, plantation, degraded and urban built-up). Three of these (cultivation, mining and urbanisation) were found to have impacts on natural habitats.
3.1. Habitat quality
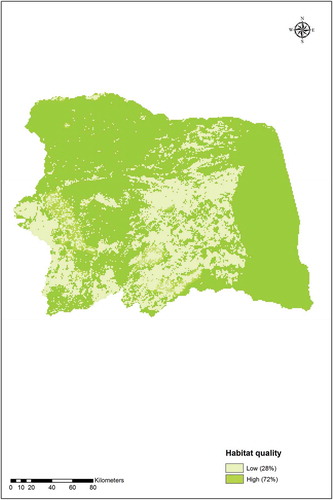
The distribution of habitats with high-quality service in relation to those with low-quality service in the landscape is shown in . About 72% of the habitats were of a high quality and were associated with natural areas. The remaining habitats were of a low quality (28%) and were found in areas under different LUs that excluded conservation.
Figure 1. Habitat quality in the Vhembe Biosphere Reserve and the northern parts of Kruger National Park study areas.
3.2. Habitat loss and degradation
The results of habitat service loss are shown in – and habitat service degradation is presented in . indicates that 35% of the habitat services were lost. In sharp contrast, 65% of the habitat services were intact.
Figure 2. Habitat changes in the Vhembe Biosphere Reserve and the northern parts of Kruger National Park study areas.
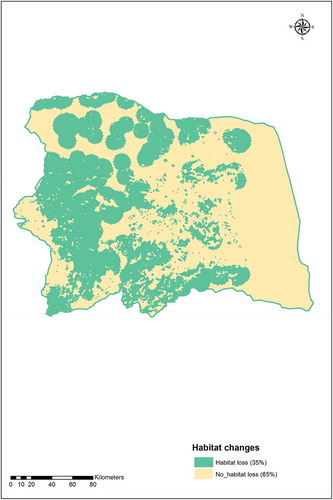
Figure 3. The extent of habitat loss in the Vhembe Biosphere Reserve and the northern parts of Kruger National Park study areas.
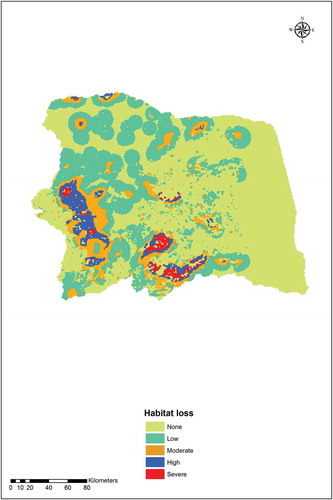
Figure 4. The extent of transformed habitats and natural habitats in the Vhembe Biosphere Reserve and the northern parts of Kruger National Park study areas.
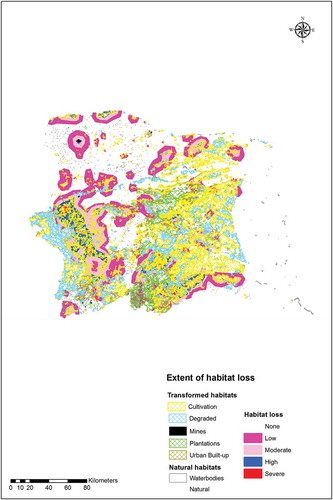
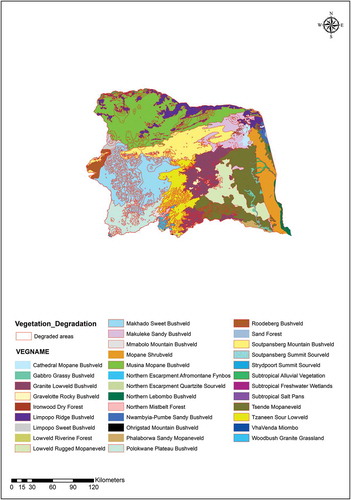
Figure 5. The extent of degradation of vegetation types in the Vhembe Biosphere Reserve and the northern parts of Kruger National Park study areas.
We further quantified the extent of habitat service loss across the landscape as follows: low habitat loss from 0% to 20%, moderate habitat loss represented by 20–32%, high habitat loss represented by 32–56% and 56–95% representing severe habitat loss ().
Areas affected by habitat services loss are shown in . Natural areas and water bodies in formal PAs and privately owned natural areas surrounding PAs had low habitat service loss. Moderate habitat service loss was recorded in areas surrounding cultivation, urbanisation, mining and plantations. Areas adjacent to mining, urban development and cultivation had high habitat service loss and severe habitat service loss was mainly recorded in areas in close proximity to cultivated areas.
The degradation of vegetation types in the study area is illustrated in . At least 19 of the 34 vegetation types (i.e., 56%) were degraded.Footnote1
4. Discussion
4.1. Habitat quality
Most habitats (72%) were in good condition. A habitat in a good state has the capacity to deliver a service of providing suitable living conditions for plants and animal species, and as a supporting service which underpins the delivery of other services such as provisioning, cultural and regulating services (MA Citation2005). Furthermore, a habitat is considered to be in good quality due to the high-quality resources that maximise species survival such as food and nesting sites among other things (Morrison et al. Citation2006; Johnson Citation2007). Habitat quality is also influenced by the proximity of sources of degradation (Tallis et al. Citation2011). High-quality habitats are associated with intact ecosystems with minimal human influence (Tallis et al. Citation2011). An area dominated by high-quality habitats represents high biodiversity (Johnson Citation2007). We attributed the dominance of high-quality habitats in PAs to their regulation (NEMPAA Citation2003), the presence of deterrents and law enforcement, which in privately owned conservation areas were moderately provided (Personal observationa). Other researchers have also shown that legal protection of habitats mitigates the impacts of threats on biodiversity (Stolton & Dundley Citation1999; Tallis et al. Citation2011).
The presence of high-quality habitats within conservation areas suggested that these areas had the potential to support the delivery of a suite of ES such as cultural (recreation), provisioning (medicinal plants and timber) and regulating services (Dombo et al. Citation2006; Stolton et al. Citation2010; WBR Citation2012). Although the habitats were generally found to be of good quality, they could still be vulnerable to degradation, since human pressure/threats are likely to intensify in future. This normally happens with growing demands on ES due to growing human populations (Clay et al. Citation1994; MA Citation2005). The adverse impacts of agriculture, mining and urban developments on natural ecosystems are thus expected to continue especially in developing countries where poverty and population growth are high (Tilman et al. Citation2002; MA Citation2005; NPC Citation2011).
About 28% of the habitats were of a low quality due to anthropogenic threats. These habitats were in close proximity to mining, plantations, cultivated areas and urban settlements. Low-quality habitat was attributed to habitat destruction due to removal of vegetation which is usually carried out during implementation of different LU activities (Ashton et al. Citation2001; McKinney Citation2008; Koh & Gardner Citation2010). Conversion of natural systems to agriculture was found to reduce some ES (Rouget et al. Citation2003; Power Citation2010). However, low-quality habitats in areas designated for agricultural activities were found to be doing well in delivering food-provisioning services such as crops and livestock (Dombo et al. Citation2006; LDA Citation2012; WBR Citation2012). Nevertheless, these low-quality habitats are poor in terms of biodiversity value (Rouget et al. Citation2003; Tallis et al. Citation2011). Low habitat quality has been associated with degraded areas (Lindenmayer et al. Citation2008; Koh & Gardner Citation2010). Low habitat quality has furthermore been associated with low biodiversity in general (Bender et al. Citation2003; Fahrig Citation2003; Tischendorf et al. Citation2003), since a habitat in a poor state has limited ability to provide suitable conditions for species and to support the provision of other services needed to support human well-being (MA Citation2005).
4.2. Habitat loss and degradation
About 35% of the habitats were lost. This resulted in loss of services associated with the provision of suitable living conditions for wildlife and with supporting the delivery of other ES. Cultivation was the greatest cause of habitat loss, followed by urbanisation and plantations, with mining causing the lowest impact. Other researchers have also recorded the contribution of different LUs such as agriculture (Rouget et al. Citation2003; Venter et al. Citation2006; McKinney Citation2008; Polasky et al. Citation2011), mining (Ashton et al. Citation2001; Phillips Citation2001) and urbanisation (Rouget et al. Citation2003; Venter et al. Citation2006; McKinney Citation2008; Uttara et al. Citation2012) to habitat loss. For example, Rouget et al. (Citation2003) found that 30% of sub-tropical thicket had been transformed due to conversion of land to agriculture leading to significant loss of biodiversity in this global biodiversity hotspot.
Areas with low habitat loss fell within the core areas (represented by PAs) of the BR (Dombo et al. Citation2006; WBR Citation2012). Low habitat loss in areas represented by PAs means insignificant loss of habitat services such as living spaces for wildlife and gene pool protection, thus protecting species from decline. Low habitat loss in PAs provides an opportunity for the delivery of recreational, raw materials and a host of regulating services, among others (Stolton et al. Citation2010). Low habitat loss in natural areas was not surprising since PAs are expected to be effective tools for conserving and protecting biodiversity (IUCN Citation2004; Stolton Citation2010; Tallis et al. Citation2011). Moreover, core areas are strictly protected by legislation and activities in these areas are highly regulated (NEMPAA Citation2003).
Areas that suffered significant habitat loss were surrounded by human dominated landscapes such as urbanisation, agriculture and mining. These landscapes fall within the transition zone of the BR which caters for different LU systems (Dombo et al. Citation2006; WBR Citation2012). It is important to note that, urbanisation, mining and agriculture are spatially disparate LU systems as permitted by the current LU zone management (Dombo et al. Citation2006; WBR Citation2012) and are not necessarily degraded areas. However, these LUs are regarded as major threats which lead to habitat service loss and ultimately to biodiversity and other ES loss (Ashton et al. Citation2001; MA Citation2005; Uttara et al. Citation2012; Chaplin-Kramer et al. Citation2015).
The finding of high habitat loss in areas surrounded by urban areas confirms the conclusions of other workers who found urbanisation to be the second highest driver of habitat loss (Czech et al. Citation2000; Venter et al. Citation2006; McKinney Citation2008; Uttara et al. Citation2012). Severe habitat loss in areas adjacent to cultivated areas confirms the findings of other studies (Stolton & Dundley Citation1999; MA Citation2005; Venter et al. Citation2006; Power Citation2010). Agriculture has been found to be the greatest cause of habitat loss in many landscapes (Rouget et al. Citation2003; Chaplin-Kramer et al. Citation2015). Habitat service loss is regarded as the main cause of extinction of species (Foley et al. Citation2005; MA Citation2005; Lindenmayer et al. Citation2008; Rockström et al. Citation2009). Mining has been found to have a negative impact on biodiversity (Ashton et al. Citation2001; Brewer et al. Citation2003; MA Citation2005). South Africa is not exempted from this phenomenon (DWAF Citation2004; Munnik et al. Citation2010; van der Burg Citation2012). Legislation has been put in place to address the negative impacts of mining activities on biodiversity (DEA et al. Citation2013), although more resources need to be channelled towards implementation of the policies (DEA et al. Citation2013).
The finding that Makhado Sweet Bushveld was the most degraded vegetation type of the 19 vegetation types found in the study areas (), is not surprising, as this vegetation type has been found to be hardly protected (Mucina & Rutherford Citation2006). Similarly, vegetation types found to have been moderately affected by habitat loss were also at great risk, as they were poorly protected or unprotected (Mucina & Rutherford Citation2006). The degradation of vegetation under protection might be a result of threats such as pollution, edge effects and habitat fragmentation which are not prevented by the presence of physical/legal or other types of protection (Tallis et al. Citation2011). Degradation of vegetation has a negative impact on the delivery of ES (MA Citation2005; Tallis et al. Citation2011).
Our study could be compared with that of La Notte (Citation2012) with regard to the use of environmental indicators such as habitat sensitivity to threats and the impact of human pressure on habitats, as well as the application of the mapping approach. However, thorough comparison of La Notte (Citation2012) and our findings was difficult due to the following differences. First, La Notte (Citation2012) used the Benefit Transfer (BT) technique to value the services, we used InVEST. Second, it valued services in monetary terms; in our study services were valued in biophysical terms. Lastly, our study assessed and mapped habitats for ES in response to human pressure such as urbanisation, mining and cultivation, La Notte’s (Citation2012) study valued and mapped habitat services using three different indicators (ecological value, ecological sensitivity and human pressure).
Our results demonstrated that the InVEST habitat quality model is useful because of the following reasons. First, it has the ability to characterise the sensitivity of habitats types to various threats. Second, it takes into account the different impacts of threats on habitats. And third, it allows estimation of the relative impacts of one threat over another. Guerry et al. (Citation2012) highlighted other advantages of the InVEST tool which included its applicability to marine systems to evaluate different effects of management practices on the delivery of ES. InVEST, however, has some drawbacks and therefore should be applied with caution as it does not provide detailed species occurrence data. It also provides some difficulties for modelling changes in the occurrence of multiple species, their persistence or vulnerability under future conditions.
5. Conclusions
We demonstrated the contribution of anthropogenic threats to habitat loss. Habitat loss often followed a pattern with more degradation found in human-dominated systems than in natural systems such as conservation areas. Although PAs systems are still crucial for preserving and protecting biodiversity, they are vulnerable to threats. Human-induced impacts resulted in loss of habitat service and degradation that negatively affected the delivery of other ES. There were trade-offs between human-induced LUs and biodiversity conservation.
LUs such as urbanisation, agriculture and mining should find ways to accommodate biodiversity conservation. Strategies should be put in place to inform management of vegetation types that are threatened by degradation. Habitat condition assessment is highly recommended to serve as a basis for assessing delivery of ES and for informing LU planning.
Disclosure statement
No potential conflict of interest was reported by the authors.
Notes
1. The affected vegetation types were Granite Lowveld Bushveld, Gravellote Rocky Bushveld, Makhado Sweet Bushveld, Roodeberg Bushveld, Tzaneen Sour Lowveld, Polokwane Plateau Bushveld, Lowveld Rugged Mopane Veld, Tsende Mopane Veld, Mmabolo Mountain Bushveld, Northern Mistbelt Forest, Woodbush Granite Grassland, Soutpansberg Mountain Bushveld, Musina Mopane Bushveld, Soutpansberg Summit Sourveld, Strydpoort Summit Sourveld, Subtropical Alluvial Vegetation, Limpopo Ridge Bushveld, Limpopo Sweet Bushveld and Makuleke Sandy Bushveld. Of these, Makhado Sweet Bushveld was found to be most degraded. Moderate degradation was recorded in Roodeberg Bushveld, Polokwane Plateau Bushveld, Mmabolo Mountain Bushveld, Northern Mistbelt Forest, Soutpansberg Mountain Bushveld, Tzaneen Sour Lowveld, Musina Mopane Bushveld, Woodbush Granite Grassland and Gravellote Rocky Bushveld. Low degradation was recorded in the following vegetation types; Granite Lowveld Bushveld, Lowveld Rugged Mopane Veld, Tsende Mopane Veld, Soutpansberg Mountain Bushveld, Strydpoort Summit Sourveld, Subtropical Alluvial Vegetation, Limpopo Ridge Bushveld, Limpopo Sweet Bushveld and Makuleke Sandy Bushveld. Despite the fact that some of the vegetation types are well protected such as Musina Mopane Bushveld and Limpopo Ridge Bushveld, they are still affected by degradation
References
- Ashton PJ, Love D, Mahachi H, Dirks PHGM. 2001. An overview of the impact of mining and mineral processing operations on water resources and water quality in the Zambezi, Limpopo and Olifants catchments in southern Africa breaking new ground: mining, minerals and sustainable development. The report of the MMSD Project. London: Earthscan, 2002. [cited 2013]. Available from: http://www.iied.org/mmsd/mmsd_pdfs
- Bender DJ, Tischendorf L, Fahrig L. 2003. Evaluation of patch isolation metrics for predicting animal movement in binary landscapes. Landscape Eco. 18:17–39.
- Bhagabati NK, Rickets T, Sulistyawan TBS, Conte M, Ennaanay D, Hadian O, Mckenzie E, Olwero N, Rosenthal A, Tallis H, Wolny S. 2014. Ecosystem services reinforce Sumatran tiger conservation in land use plans. Biol Conserv. 169:147–156.
- Bibby CJ, Collar NJ, Crosby MJ, Heath MF, Imboden C, Johnson TH, Long AJ, Stattersfield AJ, Thirgood SJ. 1992. Putting biodiversity on the map: priority areas for global conservation. International council for bird preservation. Trends Ecol Evolut. 8:1–37.
- Brewer D, Dennis D, Fry G, Milton D, Dambacher J, van der Velde T, Manson F, Heales D, Koutsoukos A, Skewes T, et al. 2003. Assessment of mine impacts on Lihir Island Fish communities with an estimation of the potential fisheries resources. Brisbane: Commonwealth Scientific and Industrial Research Organisation.
- Bukola D, Zaid A1, Olalekan EI, Falilu A. 2015. Consequences of anthropogenic activities on fish and the aquatic environment. Poult Fish Wildl Sci. 3:2.
- CBD (Convention on Biological Diversity). 1992. Nairobi final act of the conference for the adoption of the agreed text of the convention on biological diversity. Section IX. United Nations Environmental Programme; Nairobi, Kenya. cited 2013. Available from: https://www.cbd.int/doc/handbook/cbd-hb-09-en.pdf
- CBD (Convention on Biological Diversity). 2011. Conference of the Parties Decision X/2:Strategic Plan for Biodiversity 2011–2020. [cited 2014]. Available from: http://www.cbd.int/decision/cop/?id
- Chapin III FS, Zaveleta ES, Eviner VT, Naylor RL, Vitousek PM, Lavorel S, Reynolds HL, Hooper DU, Sala OE, Hobbie SE, et al. 2000. Consequences of changing biotic diversity. Nature. 405:234–242.
- Chaplin-Kramer R, Sharp RP, Mandle L, Sim S, Johnson J, Isabela Butnar I, Canalsb LM, Eichelbergera BA, Van Ramlerd I, Muellerb C, et al. 2015. Spatial patterns of agricultural expansion determine impacts on biodiversity and carbon storage. Pnas. 112:7402–7407.
- CICES (Common International Classification of Ecosystem Services). 2011. European environment agency: paper prepared for discussion at the expert meeting on ecosystem accounts organised by the UNSD, the EEA and the World Bank, London, December 2011. Prepared by: Roy Haines-Young and Marion Potschin, Centre for Environmental Management; UK: University of Nottingham.
- Clay DC, Guizlo M, Wallace S 1994. Population and land degradation: environmental and natural resources policy and training project, Madison, WI. Departments of Agricultural Economics and Sociology, Geography, and Resource Development Michigan State University. USA, ISSN 1072-9496. [cited 2014]. Available from: http://pdf.usaid.gov/pdf_docs/PNABW661.PDF
- Czech B, Krausman P, Devers P. 2000. Economic associations among causes of species endangerment in the United States. U.S. fish and wildlife service. Biol Sci. 50:593–601.
- Dasmann RF 1968. A Different Kind of Country [Internet]. New York (NY): Macmillan Company. [cited 2014]. Available from: https://books.google.co.za/books?id=p_Kqy7KviugC&pg=PA280&dq=dasmann,+r.f.,+1968
- DEA (Department of Environmental Affairs), DME (Department of Mineral Resources),(COM) Chamber of Mines, SMBF (South African Mining and Biodiversity Forum), SANBI (South African National Biodiversity Institute). 2013. Mining and biodiversity guideline: mainstreaming biodiversity into the mining sector. Pretoria: Typo Colour Specialists cc.
- Díaz S, Fargione J, Chapin III FS, Tilman D. 2006. Biodiversity loss threatens human well-being. PLoS Biol. 4:e277.
- Dombo L, Crafford J, Fouche P, Gaigher I, Hahn N, Linden J, Rosmarin J. 2006. The proposed Vhembe biosphere reserve application to UNESCO. Limpopo province department of economic development. Republic of South Africa: Environment and Tourism.
- DWAF (Department: Water and Environmental Affairs). 2004. Water conservation and water demand management strategy for the industry, mining and power generation sectors. Republic of South Africa. cited 2013. Available from: https://www.dwaf.gov.za/Documents/Policies/…/Sep2004/AppendixG.do
- Eldredge N. 1992. Where the twain meet: causal intersections between the genealogical and ecological realms. In: Eldredge, editor. Systematics, ecology and the biodiversity crisis. New York (NY): Columbia University Press; p. 1–14. [cited 2014]. Available from: https://books.google.co.za/books?id=E0F7zhnx1cgC&pg=PA11&dq=eldredge,+n.,+1992
- ESRI (Environmental Systems Research Institute). 2013. ArcGIS for Desktop. Advanced Student Edition, Version 10.2. Redlands (CA): ESRI.
- Fahrig L. 2003. Effects of habitat fragmentation on biodiversity. Annu Rev Ecol Evol Syst. 34:487–515.
- Foley JA, Defries R, Asner GP, Barford C, Bonan G, Carpenter SR, Chapin III FS, Coe MT, Daily GC, Gibbs HK, et al. 2005. Global consequences of land use. Science. 309:570–574.
- Gaston KJ. 1996. What is biodiversity? In: Gaston KJ, editors. Biodiversity: a biology of numbers and difference. Oxford: Blackwell Science; p. 1–9. [cited 2013]. Available from: https://books.google.co.za/books?id=cEIqf13PQScC&pg=PA286&lpg=PA286&dq=Gaston,+K.J.,+1996
- Guerry DA, Ruckelshaus MH, Arkema KK, Bernhardt JR, Guannel G, Kim C, Marsik M, Papenfus M, Toft JE, Verutes G, et al. 2012. Modelling benefits from nature using ecosystem services to inform coastal and marine spatial planning. Int J Biodivers Sci Ecosyst Serv Manage. 8:107–121.
- Gurevitch J, Padilla DK. 2004. Are invasive species a major cause of extinctions? Trends Ecol Evol. 19:470–474.
- Hall LS, Krausman PR, Morrison ML. 1997. The habitat concept and a plea for standard terminology. Wildl Soc Bull. 25:173–182.
- Harper JL, Hawksworth DL. 1994. Biodiversity: measurement and estimation preface. Philos Trans R Soc Lond B. 345:5–12.
- IUCN (International Union for the Conservation of Nature). 2004. Protected Areas Programme. Vol 14, no 3. Protected Areas Categories. The International Journal for Protected Area Managers. ISSN: 0960-233X. Switzerland, Nature Bureau, UK. [cited 2013]. Available from: http://cmsdata.iucn.org/downloads/14_3lowres.pdf
- IUCN (International Union for the Conservation of Nature). 2010. About Biodiversity:International year of biodiversity. [cited 2013]. Available from: http://iucn.org/iyb/about
- IUCN (International Union for the Conservation of Nature). 2011a. Evolution du secteur minier en Afrique de l’Ouest. Quel impact sur le secteur de la conservation? Ouagadougou: UICN Programme Afrique Centrale et Occidentale: Etudes du PAPACO 10. [cited 2013]. Available from: http://www.papaco.org/publication/mining%20study%20complete.pdf
- IUCN (International Union for the Conservation of Nature). 2011b. The West African Protected Areas Newsletter 45. Ouagadougou: Programme Aires Protégées en Afrique de l’Ouest. [cited 2013]. Available from: http://www.papaco.org/publication/lettreAPAO-45-0911%20ENG.pdf
- Johnson MD. 2007. Measuring habitat quality: a review. The Condor. 109:489–504.
- Koh LP, Gardner TA. 2010. Conservation in human-modified landscapes, Chapter 13. In: Sodhi NS, Erlich PR, editors. Conservation biology for all. Oxford University Press. [cited 2014]. Available from: http://ukcatalogue.oup.com/product/9780199554249.do
- Kovacs K, Polasky S, Nelson E, Keeler BL, Pennington D, Plantinga AJ. 2013. Evaluating the return in ecosystem services from investment in public land acquisitions. PLoS One. 8:e62202.
- Kurdoğlu O, Çokçaliskan BA. 2011. Assessing the effectiveness of protected area management in the turkish caucasus. Faculty of forestry, karadeniz technical university, 61080 Trabzon, Turkey. Afri J Biotechnol. 10:17208–17222.
- La Notte A. 2012. Mapping and valuing habitat services: two applications at a local scale. Int J Biodivers Sci Ecosyst Serv Manage. 8:80–92.
- LDA (Limpopo Department of Agriculture). 2012. The mapping of agricultural commodity production in the Limpopo Province, final report. Directorate Spatial Information Services. Limpopo Provincial Government of South Africa, Polokwane. Available from: [email protected]
- Lindenmayer D, Hobbs R, Montague-Drake R, Alexandra J, Bennett A, Burgman M, Cae P, Calhoun A, Cramer V, Cullen P. 2008. A checklist for ecological management of landscapes for conservation. Ecol Lett. 11:78–91.
- MA (Millennium Ecosystem Assessment). 2005. Ecosystems and human well-being: synthesis, world resource institute. Washington, DC: Island Press.
- Margoluis R, Salafsky N 2001. Is our project succeeding? A guide to threat reduction assessment for conservation. Biodiversity Support Program, Washington D.C. [cited 2014]. Available from: http://www.rmportal.net/library/content/tools/biodiversity-support…/download
- Marzluff JM, McGowan KJ, Donnelly R, Knight RL. 2001. Causes and consequences of expanding American crow populations. In: Marzluff JM, Bowman R, Donnelly R, editors. Avian ecology and conservation in an urbanizing world. Norwell (MA): Kluwer Academic; p. 333–365.
- McKinney ML. 2002. Urbanization, biodiversity, and conservation. Biol Sci. 52:883–890.
- McKinney ML. 2008. Effects of urbanization on species richness diversity: a review of plants and animals. Urban Ecosyst. 11:161–176.
- Morrison ML, Marcot BG, Mannan RW. 2006. Wildlife-habitat relationships: concepts and applications. 3rd ed. Washington, DC: Island Press.
- Mucina L, Rutherford MC, editors. 2006. The vegetation of South Africa, Lesotho and Swaziland. Strelitzia 19: South African national botanical institute. Pretoria South Africa Folia Geobot. 43:461–463.
- Munnik V, Hochmann G, Hlabane M, Law S. 2010. The social and environmental consequences of coal mining in South Africa: a case study. A joint initiative of environmental monitoring group, Cape Town, South Africa and Both Ends. Amsterdam.
- Nelson E, Mendoza G, Regetz J, Polasky S, Tallis H, Richard Cameron D, Chan KM, Daily GC, Goldstein J, Kareiva PM, et al. 2009. Modelling multiple ecosystem services, biodiversity conservation, commodity production, and trade-offs at landscape scales. Front Ecol Environ. 7:4–11.
- NEM:PAA (National Environmental Management: Protected Areas Act). 2003. Act no. 57: Biodiversity policy and strategy for South Africa: Strategy on buffer zones for national parks: For general information (Gazette No. 35020 – Notice 106). Available from: http://cer.org.za/wp-content/uploads/2010/05/57-OF-2003-NATIONAL-ENVIRONMENTAL-MANAGEMENT-PROTECTED-AREAS-ACT_2
- NPAES (National Protected Area Expansion Strategy for South Africa). 2008. Priorities for expanding the protected area network for the ecological sustainability and climate change adaptation. Government of South Africa. Pretoria, ISBN 978-1919976-55-6. Available from: https://www.environment.gov.za/sites/default/files/docs/nationalprotected_areasexpansion_strategy.pdf
- NPC (National Planning Commission). 2011. National Development Plan-Vision for 2030 (November 2011). Republic of South Africa. ISBN:978-0-621-40475-3, RP270/2011. Available from: http://www.gov.za/issues/national-development-plan-2030.
- Osti M, Coad L, Fisher JB, Bomhard B, Hutton JM. 2011. Oil and gas development in the world Heritage and wider protected area network in sub-Saharan Africa. Biodivers Conserv. 20:1863–1877.
- Phillips A 2001. Pollution, mining and protected areas. Mining, minerals and sustainable development, no. 62. World Council for Sustainable Development. International Institute for Environment and Development. [cited 2013]. Available from: http://pubs.iied.org/pdfs/G00554.pdf
- Polasky S, Nelson E, Pennington DN, Johnson K. 2011. The impact of land-use change on ecosystem services, biodiversity and returns to landowners: a case study in the state of Minnesota. Environ Resour Econ. 48:219–242.
- Power AG. 2010. Ecosystem services and agriculture: trade-offs and synergies. Phil Trans R Soc. 365:2959–2971.
- Rockström J, Steffen W, Noone K, Persson Å, Chapin III FS, Lambin E, Lenton TM, Scheffer M, Folke C, Schellnhuber H, et al. 2009. Planetary boundaries: exploring the safe operating space for humanity. Ecol Soc. 14:2–32. cited 2013. Available from: http://www.ecologyandsociety.org/vol14/iss2/art32/
- Rouget M, Richardson DM, Cowling RM, Lloyd JW, Lombard AT. 2003. Current patterns of habitat transformation and future threats to biodiversity in terrestrial ecosystems of the Cape floristic region, South Africa. Biol Conserv. 112:63–85.
- SAMABNC (South African Man and Biosphere National Committee). 2014. National report on the implementation of Madrid action plan. 26th Session UNESCO Man and Biosphere Programme ICC International Coordinating Council; Sweden; 2014 Jun 10–13. Pretoria: Department of Environmental Affairs.
- SANBI (South African National Biodiversity Institue). 2009. National land cover 2009. Pretoria: Republic of South Africa.
- Scholes RJ, Biggs R, editors. 2004. Ecosystem services in Southern Africa: a regional assessment. The regional-scale component of the Southern African millennium ecosystem. Pretoria: Council for Scientific and Industrial Research.
- Soule ME, Wilcox BA, Bruce A, editors. 1980. Conservation biology: an evolutionary-ecological perspective. Massachusetts: Sinauer.
- Stats SA (Statistics South Africa). 2012. Census 2011 Statistical release-P0301.4. Available from: http://www.statssa.gov.za.
- Stolton S. 2010. Arguments for protected areas: linking environment and well-being. Stolton S, Dudley N, editors. London: Earthscan; p. 273. ISBN: 978-1-84407-881-3.
- Stolton S, Dundley N. 1999. A preliminary survey of management status and threats in forest protected areas. PARKS 9, 27-33. Gland: Protected Areas Programme. IUCN.
- Stolton S, Mansourian S, Dundley N. 2010. Valuing protected areas. Washington (DC): World Bank`s Global Environment Facility Coordination Team, World Bank GEF Operations.
- Stuart L, Raven P, Raven P. 2000. Biodiversity: extinction by numbers. Nature. 403:843–845.
- Swift MJ, Izac AMN, van Noordwijk M. 2004. Biodiversity and ecosystem services in agricultural landscapes - Are we asking the right questions? Agric. Ecosyst Environ. 104:113–134.
- Tallis HT, Ricketts T, Guerry AD, Nelson E, Ennaanay D, Wolny S, Olwero N, Vigerstol K, Pennington D, Mendoza G, et al. 2011. InVEST 2.0 beta User’s Guide. Stanford: The Natural Capital Project, Stanford. [cited 2011]. Available from: http:www.naturalcapitalproject.org/pubs/InVEST_2.0beta_Users_Guide.pdf.
- TEEB (The Economics of Ecosystems and Biodiversity) 2010. Chapter 1: Integrating the ecological and economic dimensions in biodiversity and ecosystem services valuation. Available from: http://www.teebweb.org/wp-content/upload/2013/014/D0-Chapter-1.
- Tilman D, Cassman KG, Matson PA, Naylor R, Polasky S. 2002. Agricultural sustainability and intensive production practices. Nature. 418:671–677.
- Tischendorf L, Bender DJ, Fahrig L. 2003. Evaluation of patch isolation metrics in mosaiclandscapes for specialist vs generalist dispersers. Landscape Eco. 18:41–50.
- Turner SD 2012. World heritage sites and the extractive industries. Available from: https://cmsdata.iucn.org/downloads/whs_and_extractive_industries_20_jun_12.pdf
- UNESCO (United Nations Educational, Scientific and Cultural Organization). 2010. Lessons from biosphere reserves in the Asia-Pacific region, and way forward. A regional review of biosphere reserves in Asia and the Pacific to achieve sustainable development, Ecological Sciences for Sustainable Development. Regional Science Bureau for Asia and the Pacific. UNESCO Office, Jakarta. Available from: http://www.unesco.org/new/en/…sciences/…sciences/…/asia-and-the-pacific.
- Uttara S, Bhuvandas N, Aggarwal V. 2012. Impacts of urbanization on the environment. Int J Res Eng Appl Sci. 2:1637–1645.
- van der Burg G 2012. The impact of coal mining on agriculture-a pilot study. Bureau for Food and Agricultural Policy, South Africa. [cited 2013]. Available from: http://bfap.co.za/documents/presentations/2012/Impact%20of%20Mining
- Venter O, Brodeur NN, Nemiroff L, Belland B, Dolinsek IJ, Grant JWA. 2006. Threats to endangered species in Canada. Biol Sci. 56:903–910.
- Venter O, Fuller RA, Segan DB, Carwardine J, Brooks T, Butchart SHM, Di Marco M, Iwamura T, Joseph L, O`Grady DO, et al. 2014. Targeting global protected area expansion for imperiled biodiversity. PLoS Biol. 12:e1001891.
- WBR (Waterberg Biosphere Reserve). 2012. Ten year periodic review 2001-2011. [cited 2012]. Available from: http://www.docstoc.com/myoffice/recommendations?docId=161286419&download
- Wilcove DS, Rothstein D, Dubow J, Phillips A, Losos E. 1998. Quantifying threats to imperiled species in the United States. Assessing the relative importance of habitat destruction, alien species, pollution, over exploitation and disease. Biol Sci. 48:607–615.
- Wilson EO, Peter FM, editors. 1988. Biodiversity. Washington D.C.: National Academy of Sciences/Smithsonian Institution. ISBN: 0-309-56736-X, 538 pages, 6 x 9. [cited 2014]. Available from: http://www.nap.edu/catalog/989.html