
 ?Mathematical formulae have been encoded as MathML and are displayed in this HTML version using MathJax in order to improve their display. Uncheck the box to turn MathJax off. This feature requires Javascript. Click on a formula to zoom.
ABSTRACT
Riparian margins can provide a range of environmental, social, and production benefits both on-farm and off-farm. However, our understanding of the relative advantage between various riparian-margin management options is limited. We aim to advance this knowledge by modelling change in food provision, water quality regulation, contact recreation, and amenity ecosystem services in response to riparian-margin management. Estimations in performance were made under grazed; fenced 1 m-wide grass-strips; and fenced 5 m-wide multi-tier planted riparian margin scenarios within a lowland dairy farming landscape as typical in the North Island, New Zealand. Our study allows for simultaneous analysis across the range of ecosystem services (provisioning, regulating, and cultural) and across spatial scales (farm, river network, catchment) as relevant to current policy focus for riparian management. We show both grass-strips and multi-tier planted margins can maintain or increase production values, while also making important contributions to environmental stewardship and community values. Under a multi-tier planted margin scenario, provision of amenity values also increases. Importantly, we also show that riparian management alone is not adequate to address detrimental outcomes of land use on receiving environments, and should be part of wider farm management practices used to maximise opportunities for sustained ecosystem service provision. This is an important consideration for land management policies.
Edited by Alexander van Oudenhoven
1. Introduction
Agricultural landscapes cover 38% of land globally, making agriculture the dominant form of land use at the global scale (Dale and Polasky Citation2007). In parallel, agricultural practices have been a major driver of detrimental environmental change, particularly since the Green Revolution (the period following the 1960s, where technological development, inexpensive pesticides and fertilisers, and mechanisation intensified agricultural production) (Tilman Citation1998; Pingali Citation2012). This has led to the provision of other ecosystem services beyond food provision being compromised or completely prevented (Swinton et al. Citation2007; Plieninger et al. Citation2012; Balbi et al. Citation2015; Tanentzap et al. Citation2015). The decline in the multifunctionality of landscapes (the simultaneous provision of multiple ecosystem functions or services, Byrnes et al. Citation2014; Wagg et al. Citation2014) is undesirable, because functions and services underpin the provision of other ecosystem services which food, soil, and water security are reliant upon (Gordon et al. Citation2010; Bommarco et al. Citation2013; Costanza et al. Citation2014; McBratney et al. Citation2014). This in turn reduces overall benefits for human well-being and compromises the ecological and social resilience of our land-based farming systems.
Agricultural landscapes can contain a wealth of natural capital and through this provide many opportunities for adaptive measures to global scale issues, such as climate change or population pressures. Thus, how we manage these landscapes, beyond just dealing with their immediate environmental footprint, is critical. In heavily modified systems, this will require the re-introduction or manipulation of lost or degraded and dysfunctional system components. This includes natural capital stocks such as soils and vegetation which give rise to required ecosystem services beyond food provision. This is well illustrated in lowland areas of New Zealand which have experienced an almost complete transformation from native vegetation cover to one dominated by exotic herbaceous forage species introduced from the Northern Hemisphere by European settlers from the early–mid 1800s. This transformation resulted in the loss of biological and structural indigenous diversity across large areas of the country (Lee et al. Citation2008; Quinn et al. Citation2009). This includes the loss of the vast majority of riparian margins and associated ecological functionality. This lost functionality includes attenuation to reduce sediment loadings in-stream, provision of terrestrial and aquatic habitat, maintaining food-webs, and regulating stream temperature and shade (Collier et al. Citation1995; Moller et al. Citation2008).
Maseyk et al. (Citation2017b) illustrate that the provision of ecosystem services can be influenced by targeting management interventions on the natural capital stocks that give rise to the required ecosystem services. Here, we use management of riparian margins as an example of an intervention that manipulates and builds on existing natural capital vegetation stocks to improve functions and benefits flowing from those stocks. Vegetation is the easiest riparian attribute to manipulate (Collier et al. Citation1995) which directly, and indirectly through its interaction with soil natural capital stocks, contributes to riparian functionality. For example, by trapping sediment; increasing supplies of terrestrial carbon to waterways; increasing stability of streambanks; and reducing overland flows. Further, as the establishment of riparian margin buffer zones is a relatively easy practice to implement and has immediate and highly visible results on intensively farmed lowland country, the practice has become a widely accepted method by which to respond to land use pressures on ecosystem health, and more specifically, receiving environments. This is reflected by the increasing prevalence of management of riparian margins to address declining surface water quality within public policy internationally (e.g. The European Union Nitrates and Water Framework Directives in Europe and the Agricultural Environmental Options Scheme in Ireland). In New Zealand, the management of riparian margins has also become a common policy-driven intervention associated with regional natural resource management plans and an expected industry standard (e.g. the Sustainable Dairying: Water Accord). As a result, substantial effort and expense has, and continues to be, invested into riparian management across the country. This management involves fencing to exclude livestock and sometimes includes the addition of plantings into the riparian zone. However, little evaluation of the wider benefits on-farm and off-farm flowing from these initiatives, or the marginal gains that planting may bring have been conducted.
As a starting point to describe wider benefits associated with riparian margins, we held workshops (in May 2015) with dairy farmers farming the Taranaki ring plain (Taranaki, North Island, New Zealand), to elicit farmer perceptions as to the advantages and disadvantages of planting riparian margins on their farms. During the workshops, a range of views regarding planted riparian margins were presented, with some farmers perceiving no value additional to those achievable with fenced grass-strip riparian margins, while other farmers perceiving planted riparian margins to provide a number of additional benefits and values (Maseyk et al. Citation2017a). This article builds upon these findings and aims to provide an indicative and initial quantification of the magnitude and direction of change in the provision of services and benefits in response to the management of riparian margin within a lowland dairy farming landscape. The study has three key objectives:
Increase understanding of the influence current management of riparian margins in New Zealand has on the provision of food, water quality regulation, contact recreation, and amenity ecosystem services.
Evaluate how increasing natural capital stocks via the re-introduction of biodiversity (in the form of riparian plantings) into lowland dairy landscapes changes the nature and flow of food provision, water quality regulation, contact recreation, and amenity ecosystem services.
Broaden understanding of the utility of an ecosystem services approach to land-management decision-making by focussing on multiple benefits that span provisioning, regulating, and cultural services at the various scales at which these benefits are realised.
We address these objectives using a hypothetical farm system within a characteristic lowland dairy farming landscape under each of the three riparian-management scenarios (grazed; fenced; fenced and planted). A suite of non-spatially explicit, conceptual models was used to provide indicative estimations of the provision of ecosystem services under each of the three management scenarios, and thus allow us to simultaneously evaluate potential change in the nature and flow of the four study ecosystem services at farm, river, and landscape scales. This study atypically brings together assessment of provisioning (food provisioning), regulating (water quality regulation), and cultural (contact recreation and amenity value) ecosystem services in three different dairy systems reflective of the riparian-management scenarios, illustrating the marginal gains between different management options in a way that is meaningful to end-users operating within a production landscape.
2. Methods
We focused on food provision, water quality regulation, contact recreation, and amenity ecosystem services as these services either reflect values raised by participant farmers during the 2015 workshops (Maseyk et al. Citation2017a), or are issues of current community and industry interest associated with the management of riparian margins. These four ecosystem services (one provisioning, one regulating and two cultural services (MA Citation2003; Haines-Young and Potschin Citation2011)) allowed for the exploration of potential interactions between ecosystem service type that also operate at very different spatial scales (paddock, farm, and catchment).
The link between natural capital (ecosystem properties and processes) and the provision of ecosystem services and associated benefits and values to human communities has been well illustrated (MA Citation2003; de Groot et al. Citation2010; Costanza et al. Citation2017). Several frameworks go further to explicitly capture the influence of land management and policy decisions on the natural capital from which services are derived (e.g. Dominati et al. Citation2010; van Oudenhoven et al. Citation2012; Maseyk et al. Citation2017b). We use the framework described in Maseyk et al. (Citation2017b) as a foundational concept for this study; by testing the impact of land management actions (riparian management) on natural capital stocks and subsequently on ecosystem processes and finally the provision of ecosystem services. We use a combination of indicator types (see van Oudenhoven et al. Citation2012) that capture change in ecosystem property, function, and service provision to estimate the change in performance of the farm system under the three riparian margin management scenarios. Using a mix of indicator types has allowed us to explore change at different points of the ecosystem-services pathway that are responsive to management change, relevant to the study ecosystem services, and meaningful to land managers and decision makers. The indicators used for each service are explained below and summarised in .
Table 1. Indicators used to estimate provision of food, water quality regulation, contact recreation, and amenity ecosystem services under the grazed, 1 m fenced strip, and 5 fenced and planted riparian margin scenarios.
We used a combination of available data, national spatial datasets, published literature, information obtained from dairy farmers, spatial data obtained from local government, and the OVERSEER nutrient budget (OVERSEER® Nutrient Budgets, version 6.2.2; OVERSEER Citation2016) to inform the parameters and assumptions when modelling the change in ecosystem service provision (see supplementary Tables S1 and S2). OVERSEER is a farm-level web-based tool that generates nutrient budgets based on farm-specific information describing the farm natural resources including topography and soils, the farm system, and key interventions and management decisions. OVERSEER is a relevant model for our study as it can be used to connect farm-scale management to service provision, and it is commonly used by New Zealand farmers to calculate farm nutrient-budgets, and by regional councils to determine losses of nutrients off-farm.
Our study does not lend itself to comparative statistical analysis between scenarios as our results are based on model estimations. Instead, we compare these estimations of service provision under each riparian management scenario to evaluate the marginal advantage of one management action over another.
2.1. Model system
Our model system is conceptual rather than spatially explicit. However, we used data and information pertaining to the Taranaki Region (west coast of the North Island, New Zealand) to parameterise the model and inform assumptions. This enabled the model system to be representative of lowland dairy-farm systems on allophanic soils. The majority (60%) of Taranaki Region is under pastoral farming land use. This land use is predominantly dairy farming which produces approximately 12% of New Zealand’s total milk solids (TRC Citation2015). The Council implements a council-assisted voluntary riparian margin planting programme with a specific focus on the waterways flowing through dairy farms for which data is available (TRC Citation2011). In addition, data generated during the workshops with dairy farmers held in Taranaki in 2015 provided information for use in model parameterisation. The workshop design and elicitation methods are described in (Maseyk et al. Citation2017a). This collection of readily available information provided a useful foundation from which to estimate the influence of riparian margins on the provision of ecosystem services.
The system functions and attributes that contribute to the provision of ecosystem services can operate at multiple scales. Here we use a combination of spatial scales to explore ecosystem service provision under the three riparian margin scenarios: food provision and on-farm performance in water quality regulation are assessed at the farm scale; amenity at the catchment scale; and contact recreation is estimated across the river network. These three spatial scales of assessment are defined in . We focused on scales that were the best fit for either the metric (e.g. loss of nitrogen (N) to water at the farm scale) and where values would logically be realised (e.g. benefits of contact recreation values experienced by the wider community across the river network or production values experienced by farmers at the farm scale). The benefits from all the ecosystem services we modelled can, once quantified and valued, conceivable be scaled up or down.
2.1.1. Farm system
As our modelling of ecosystem service provision is conceptual and non-spatial, we designed a hypothetical farm to serve as the model agroecosystem. The farm system was designed using a combination of information obtained from workshop participants as per the characteristics of their farms (Maseyk et al. Citation2017a), publically available data describing a case study Taranaki dairy farm (DairyNZ Citation2016a), and regional dairy production figures (Ministry for Primary Industries Citation2012).
Our model farm system comprises a 122 ha, non-irrigated milking platform on allophanic soils (New Zealand Soil Classification, Hewitt Citation1998; Typic Udivitrand, U.S. soil taxonomy) with a stocking rate of 3.1 cows/ha (peak herd size = 378 milking cows). The herd is replaced at a rate of 26% of lactating cows/year. This is a pasture-based system with dairy cows farmed outdoors year-round. Replacement cows are kept on farm until December each year. Farm topography is flat to rolling and the farm receives a mean annual rainfall of 1700 mm/year. Liquid effluent is applied to 24.4 ha of the farm, and the remaining 97.6 ha receives typical fertiliser inputs. The farm has 6 km of waterways (combined total length), all of which is assumed to be 2 m wide. The spatial configuration of waterways across the farm-scape is not defined. No wetlands occur on the farm. This baseline farm system was modelled as is, or modified to reflect the management scenarios (). Thus, we described three hypothetical farm systems (one reflecting each riparian margin scenario) which were individually entered into OVERSEER and that explicitly account for land area, soil type, climate, and New Zealand dairy farm systems, which are different from other systems found around the world.
Table 2. Key characteristics of the model farm systems which differ with riparian-margin management scenario.
2.1.2. Riparian margin scenarios
Three riparian margin states were used as the management scenarios under which we modelled ecosystem service provision ():
Grazed riparian margins. Pasture is maintained to the waters-edge, livestock graze the margins and have direct access to waterways.
Fenced grass-strip riparian margins. A 1 m-wide strip of riparian margin is retired from grazing (fenced to exclude livestock) and maintained in pastoral species.
Fenced multi-tier riparian margins. A 5 m-wide strip of riparian margin is fenced to exclude livestock and retired from grazing. The margin is planted in a mix of grasses, shrubs, and trees. Plantings are assumed to be 10 years old and well established.
Figure 1. Riparian margin states typical of the three study riparian margin scenarios: 1 = grazed riparian margins; 2 = 1 m-wide fenced grass-strip riparian margins; 3 = 5 m-wide fenced, multi-tier riparian margins. Photo 2 is courtesy of Taranaki Regional Council.
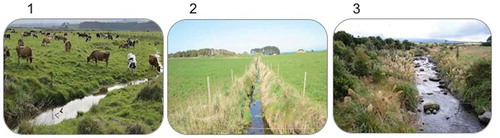
The widths of the riparian margins (e.g. 1 m and 5 m) are reflective of current practice in New Zealand. Farming riparian margins (i.e. scenario 1) is becoming less common as industry standards and community expectations of best practice change. However, the grazed riparian margin scenario provides a useful baseline scenario (a ‘negative control’) to describe what would happen in the absence of management, and to compare the benefits derived from both fencing and planting riparian margins. Within our study, the farm system is changed to represent scenario 2 and scenario 3. For both of these scenarios, complete implementation is assumed (e.g. all waterways on the farm or in the catchment are fenced, or fenced and planted).
2.2. Estimating marginal gains in ecosystem services provision under different riparian margin scenarios
2.2.1. Food provision
We estimate the performance in food provision under each riparian management scenario using milk yield, measured as kg milk solids (MS)/cow, as an ecosystem service indicator (). We did not use a measure of fodder production as although this is an indicator of the system, fodder needs to be converted (via consumption by livestock) to provide a food provisioning service for humans. Indicators that describe the properties of systems can be used to inform on ecosystem service provision (van Oudenhoven et al. Citation2012), but direct measures are preferable where they are available, as is the case here.
Actual milk production for the Taranaki Region in 2012 (1047 kg/ha, Ministry for Primary Industries Citation2012) was used to parametise the OVERSEER runs. We assumed total production of milk solids remained static under each of the three scenarios. We based this assumption on information provided by farmers regarding the increased ability to improve pasture management and grass utilisation by animals when waterways are fenced, and the farmers’ perception that their total milk production was the same or better when comparing their farms with and without riparian-margin plantings (Maseyk et al. Citation2017a). Maintaining total milk production across all three scenarios meant that due to the reduced area of land available for production and the reduced herd size (as stocking rates remained stable) under the grass-strip and multi-tier riparian margin scenarios (), per cow production of milk solids (kg MS/cow) increased. Our modelling focused on the influence of riparian management on grazing management and milk production, and assumes no other additional inputs (e.g. increased fertiliser or supplementary feed) were introduced into the system. This assumption reflects the practice of our participant farmers, and limits the number of variables modified.
Kendall et al. (Citation2006) showed dairy milk production increased by 3% in cows that had access to shade compared with cows that did not have access to shade, although this study only focused on the effect of shade on milk production for a short period of the milking season. Further, we can assume that the herd will be grazing in areas away from the riparian margins for some time of the milking season and thus the benefits of shade provided by riparian plantings will not be constant. Despite these limitations of our assumption, dairy farmers did perceive a benefit to milk production due to the shade provided by riparian margins plantings over that experienced with fenced-only margins (Maseyk et al. Citation2017a). Therefore, we took a conservative approach and assumed a gain in milk production of 1.5% under the multi-tier scenario.
2.2.2. Water quality regulation
The provision of good water quality allows for a number of ecosystem services from which several benefits for humans arise (e.g. provision of water and food sources; cultural well-being; recreational opportunities) (Keeler et al. Citation2012). The state of water quality is measured and defined across a number of parameters, but we focussed here on N and phosphorus (P) which, when lost from the farm system in quantities that exceed critical thresholds, have a detrimental impact on water quality (Parlimentary Commissioner for the Environment Citation2015). Thus, we used the ability to retain N and P (measured as losses of N and P to water) as an ecosystem function indicator by which to estimate the influence each of the riparian management scenarios has on water quality regulation (). Nutrient retention is an appropriate indicator by which to estimate change in service provision as it is both directly responsive to the management actions being compared, and informative of a change in system function that contributes to the desired ecosystem state (good water quality) that gives rise to benefits and human well-being.
We assumed that water quality regulation is increased with improved nutrient attenuation, although we do not quantify this relationship here. Estimates of N loss to water (kg N/ha/year) and P loss to water (kg P/ha/year) were derived from the three OVERSEER runs reflecting each of the riparian margin scenarios and associated changes in farm performance.
2.2.3. Contact recreation
Contact recreation includes recreational activities where there is contact with water (e.g. swimming), the provision of which represents a cultural ecosystem service. Escherichia coli (E. coli) is commonly used in New Zealand as a pathogen indicator organism and in-stream E. coli levels are used to describe alert thresholds that inform society on the risk of becoming ill and thus the ability of the waterway to provide safe contact recreation. Therefore, in-stream E. coli levels provide a useful measure of the ecosystem property required to provide the contact recreation service. Levels in E. coli are also responsive to riparian margin management actions. In the absence of data directly relating to contact recreation (e.g. numbers of people swimming), we considered E. coli levels (measured as cfu/100 ml) to estimate the change in potential for contact recreation under each riparian management scenario ().
Monitored and estimated E. coli levels under each of the riparian margin scenarios were evaluated against the Ministry for the Environment’s alert levels (green, amber, red classes, Ministry for the Environment Citation2003). E. coli monitoring data (2005–2014) for the New Zealand water quality monitoring network was downloaded from the Land and Water Aotearoa website (LAWA Citation2016). This national data set was filtered to exclude all but the four monitoring sites within the Taranaki Region. All four monitoring sites were located in lowland reaches of rivers where the landuse was pastoral (dairy farming). As Taranaki Regional Council (TRC) reported that by June 2012 75% of stream bank was fenced (TRC Citation2016), the Taranaki data set was further filtered to include only sampling events from July 2012 to December 2014 (n = 30 at each of the four monitoring sites). Although not fully reflective of our grass-strip scenario (which assumes 100% of waterways are fenced), this actual monitoring data was used to estimate in-stream E. coli levels under the grass-strip riparian margin scenario, with the recognition that modelled outputs based on this data would be potentially underestimated. The data set was explored to test for seasonal differences in E. coli levels, but as none were observed, the data was analysed as a whole and not split into seasonal periods.
Quinn et al. (Citation2009) estimate that fencing and planting riparian margins reduce E. coli levels by 80–90%. We conservatively took the lower end of this range and assumed that the majority of the improvement was attributable to excluding livestock from waterways, which is known to have immediate and considerable benefits (Davies‐Colley et al. Citation2004; McDowell and Wilcock Citation2007; Wilcock et al. Citation2013; McKergow et al. Citation2016). We attributed the remaining improvement to the addition of riparian-margin plantings, to account for their contribution to reducing overland flows. Therefore, we assumed 75% improvement in E. coli levels is gained via fencing and the additional 5% of the total of 80% improvement is achieved via planting. Thus, to estimate E. coli levels under (i) a grazed riparian margin scenario we calculated each monitoring sample to be 75% worse (>E. coli cfu/100 ml) and (ii) a multi-tier riparian margin scenario we calculated each monitoring sample to be 5% better (<E. coli cfu/100 ml). Frequency distributions of E. coli levels within each of the alert levels (green, amber, red) were calculated for each of the four Taranaki monitoring sites. The mean frequency of samples falling within each of the alert levels across the four sites was then calculated for each riparian margin scenario.
2.2.4. Amenity value
Amenity value refers to the aesthetic pleasure humans experience from landscapes and nature. Amenity value is an important cultural ecosystem service provided by landscapes, but is difficult to describe and quantify. We assumed that increased structural diversity provides ‘scenery’ and thus amenity value (de Groot et al. Citation2002) within the pastoral landscape. We therefore used the presence of landscape features, measured using a Landscape Diversity Index (LDI), as a proxy indicator to estimate ecosystem service provision (). This was also an appropriate indicator to measure the change in amenity value under each of the riparian management scenarios as the LDI was responsive to a change in the presence of structural features in the landscape, as occurs with the introduction of riparian plantings.
We assumed the presence of riparian-margin plantings to have a positive amenity value. This assumption was informed by the views of dairy farmers participating in the riparian margin workshop in 2015 (Maseyk et al. Citation2017a), the majority of whom referred to riparian-margin plantings as visually appealing features that improved the appearance of the farm and wider landscape (see also Jay Citation2005).
Landscape features considered to contribute to landscape diversity included both native and exotic forest, scrub, shrubland, treeland, plantation forest, and open water, rivers, and wetlands. Exotic landscape features were included as they contribute to structural diversity and have become recognised and accepted elements of the New Zealand landscape (Meurk and Swaffield Citation2000; Swaffield and McWilliam Citation2013). All landscape features were weighted equally in our analysis, in that no feature was considered to have more amenity value than another.
The LDI accounts for the number and extent of unique landscape features and adapts Simpson’s Index of Diversity (Simpson Citation1949):
where LDI = landscape diversity; p = the proportional cover of each landscape feature; and P = the total proportional cover of all landscape features. This returns a counter-intuitive value, in that a greater number reflects lesser diversity. This is rectified by subtracting the LDI from 1 to give a value between 0 and 1 whereby the greater the number the greater the diversity:
To calculate the potential for planted riparian margins to increase amenity values, we simulated a pastoral dominated landscape characteristic of lowland dairy farming in New Zealand based on an actual catchment within the Taranaki Region. The extent and spatial configuration of remaining native vegetation in the study catchment (~10% of former extent remaining, present in small, isolated fragments) is typical of lowland areas dominated by pastoral farming elsewhere in New Zealand (Walker et al. Citation2006) and thus provides a representative landscape upon which to inform predicted changes in amenity values provided by the addition of natural features into the landscape.
The simulated catchment was divided into 100 ha grids (spatial analysis was conducted in QGIS (version 2.8.1-Wien). As we were only concerned with the addition of riparian-margin plantings into a pastoral matrix, grid squares dominated by urban settlement or public conservation land were excluded from the analysis, resulting in a total of 79 grids for the grazed and grass-strip scenarios, and 80 grids for the multi-tier grass-strip scenario. The New Zealand Land Cover Database (LCDB v4.1, LCDB Citation2015) spatial layer was used to identify the presence and extent of landscape features and surrounding matrix within each grid. Spatial data obtained from TRC was used to identify riparian-margin plantings implemented under the council’s voluntary riparian margin planting programme (TRC Citation2011).
Within each 100 ha grid, the LDI was calculated first assuming planted riparian margins were absent, and then recalculated with the riparian margin planting data included in the analysis. A frequency distribution of the LDI scores was calculated for the landscape without (grazed and grass-strip riparian margin scenarios) and with riparian-margin plantings (multi-tier riparian margin scenario).
2.2.5. Simultaneous provision of ecosystem services
To compare the simultaneous provision across the four ecosystem services, the measure for each service was categorised into three performance level indicators: high, moderate, or low performance. Performance indicator values for milk production and nutrient attenuation are expressed as direct measures, and for contract recreation and amenity as the proportion (%) of samples falling within the specified value ().
Table 3. Performance level indicator (low, moderate, high) value ranges for each measure or proxy measure of the four study ecosystem services.
Performance thresholds for the food provision ecosystem service were based on national per cow milk solid production (kg MS/cow) figures for dairy farm systems. Average per cow production in New Zealand for the 2013–14 year was 371 kg MS/cow (Livestock Improvement Corporation and Dairy NZ Citation2014). Based on the authors’ knowledge of dairy farm systems and typical production, we estimated threshold ranges for low, moderate, and high food provision performance taking into account our model farm system, soil and landscape. Higher values for per cow milk solids production are indicative of higher food provision, providing stocking rate is held the same.
Performance thresholds for nutrient attenuation were estimated based on published nitrate leaching figures for temperate agroecosystems (Di and Cameron Citation2002) and P losses from dairy dominated catchments (McDowell and Wilcock Citation2008). In contrast to per cow milk solid production, higher values for nutrient loss to water (kg/ha/year) are indicative of lower performance and less service provision.
The proportion of E. coli monitoring events that exceed the red alert level (550 cfu E. coli/100 ml), thus exceeding the safe threshold for contact recreation (Ministry for the Environment Citation2003), was used as a threshold to indicate performance under each riparian margin scenario. The thresholds for performance were based on an assumption that the frequent occurrence of safe levels for contact recreation was desirable.
Performance indicators for amenity value were defined by the frequency that landscape parcels (100 ha grids) had a LDI of >0.7. Values above this threshold were taken to represent a high diversity within landscape parcels. It was assumed that both a high diversity (LDI > 0.7) within landscape parcels and a high frequency (>75%) of landscape parcels with a high diversity are required to provide a high-performance level for amenity values.
3. Results
3.1. Comparison of ecosystem service provision between scenarios
3.1.1. Performance level of ecosystem service provision under each riparian margin scenario
All three riparian margin scenarios delivered some level of performance for all four ecosystem services ().
Figure 2. Performance level (low, medium, high) of the four study ecosystem services: food provision, measured as milk production (kg MS/cow); water quality regulation, measured as N loss to water (N kg/ha/yr) and P loss to water (P kg/ha/yr); contact recreation, measured as the proportion of sampling events exceeding 550 cfu E. coli/100 ml; and amenity value, measured as the proportion of simulated landscape grids (100 ha) with a Landscape Diversity Index of >0.7.
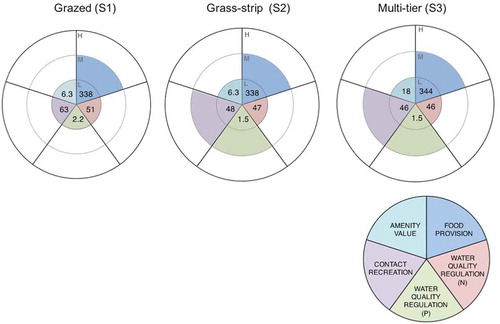
Due to the design of the farm system entered into OVERSEER, food provision (kg MS/cow) remained moderate under all three scenarios. Performance of N attenuation as measured by the decrease in N leaching (kg N/ha/year) remained low under all three scenarios, but P attenuation when measured as reduced risk of P loss to water (kg P/ha/yr) improved in performance level from low (under the grazed riparian margin scenario) to moderate (under the grass-strip and multi-tier riparian margin scenarios) (). Contact recreation (the proportion of sampling events exceeding 550 cfu E. coli/100 ml) showed a similar pattern, with performance measures shifting from within the low performance level under a grazed riparian margin scenario to within the moderate performance level under both the grass-strip and multi-tier riparian margin scenarios (). Amenity performance level (as measured by the proportion of simulated landscape grids with a LDI > 0.7) remained low under all three riparian margin scenarios. None of the measures of ecosystem services reduced in performance under the grass-strips or multi-tier riparian margin scenarios when compared to the grazed riparian margin scenario ().
3.1.2. Change in estimated ecosystem service measures under each riparian margin scenario
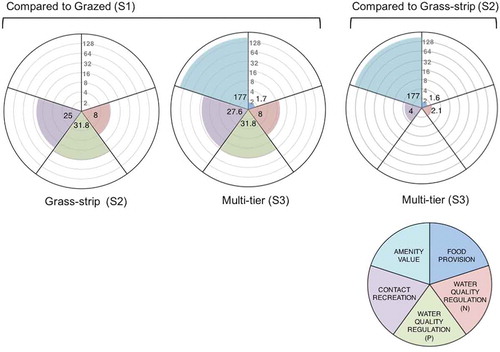
Milk production, as a measure of food provision, increased very slightly (0.2%) under the grass-strip riparian margin scenario compared with the grazed riparian margin scenario, and showed a slight increase (1.7%), from 338 to 344 kg MS/cow under a multi-tier riparian margin scenario (). Nutrient attenuation as measured by reduced N leaching improved slightly under the two fenced riparian margin scenarios compared with the grazed riparian margin scenario (), although this was not enough to change the level of performance (). N loss to water decreased by 7.8% (from 51 to 47 kg N/ha/year for the whole farm) under the grass-strip and 9.8% (from 51 kg to 46 kg N/ha/yr) under the multi-tier riparian margin scenarios (). The shift from low to moderate performance level of nutrient retention when measured as P loss to water () reflects a decrease of 31.8% (from 2.2 to 1.5 kg P/ha/year) under both the grass-strip and multi-tier riparian margin scenarios compared to a grazed riparian margin scenario (). A reduction in the frequency of >550 cfu/100 ml of E. coli of 25% (from 63 occurrences to 48) and 27.6% (exceeded 46 times) under the grass-strip and multi-tier riparian margin scenarios, respectively (), account for the shift from low (grazed riparian margins) to moderate (grass-strip and multi-tier riparian margins) performance level of this measure of contact recreation ecosystem service (). Amenity as measured by landscape diversity increased substantially with the introduction of plantings under the multi-tier riparian margin scenario (), albeit not enough to shift the categorical performance level of this measure above the low threshold (). The proportion (%) of simulated landscape grids with a Landscape Diversity Index greater than 0.7 increased from 6% under both the grazed and grass-strip riparian margin scenarios to 18% under the multi-tier riparian margin scenario, more than a 2-fold increase (). There was a slight increase (1.6% from 338 kg to 344 kg MS/ha) in milk production under the multi-tier compared to the grass-strip riparian margin scenario (). Change in water quality regulation when measured as the reduced N loss to water was also slight (from 47 to 46 kg/N/ha/yr), and when measured as P loss to water showed no change (). Contact recreation as measured as the frequency of >550 cfu/100 ml of E. coli also improved slightly (3.5%), from 48 occurrences to 46 under the multi-tier scenario when compared to the grass-strip riparian margin scenario (). Despite the considerable increase in amenity value under a multi-tier riparian margin, the estimated changes between multi-tier riparian margins compared with grass-strip riparian margins were not enough to improve the categorical performance level beyond that achieved under the grass-strip riparian margin scenario for all four ecosystem services ( and ).
Figure 3. Percentage improvement in performance under grass-strip (S2) and multi-tier planted (S3) riparian margins compared to grazed riparian margins (S1) and under the multi-tier scenario compared to the grass-strip scenario presented on a log scale base 2.
3.2. Frequency distribution of Escherichia coli levels under each riparian margin scenario
All three riparian margin scenarios estimated a high frequency of monitored E. coli levels that were >550 m cfu/100 ml (exceeding the safe level for provision of contact recreation when this occurred) (), suggesting that none of the riparian margin scenarios provided uninterrupted provision of contact recreation. Excluding livestock from waterways and riparian margins (scenario 2) is estimated by our model to increase the frequency of E. coli levels falling into safe levels for contact recreation (green and amber levels) 51% of the time, and introducing riparian-margin plantings (scenario 3) increases this frequency to 53% of the time. Of note is the greater estimated increase in E. coli levels falling within the Green alert level (<260 cfu/100 ml) than the Amber alert level (>260–<550 cfu/100 ml), estimating that the grass-strip and multi-tier riparian margin scenarios increase the chance of E. coli levels to fall well within the safety threshold 33% of the time, compared with less than 20% of the time under a grazed riparian margin scenario.
Figure 4. Frequency of estimated in-stream Escherichia coli concentrations under each riparian margin scenario: S1 = grazed riparian margins; S2 = grass-strip riparian margins; S3 = multi-tier riparian margin. Graph shows mean distribution of samples (n = 30 at each of the four monitoring sites) across each contact recreation alert level for E .coli: green = < 260 cfu/100 ml; amber = > 260 < 550 cfu/100 ml; red = > 550 cfu/100 ml (Ministry for the Environment Citation2003). Contact recreation is unsafe when E. coli levels exceed >550 cfu/100 ml (red).
3.3. Frequency distribution of Landscape Diversity Index (LDI) under each riparian margin scenario
All three riparian margin scenarios provide some amenity value although slightly over half of the LDI scores were <0.5 for the two scenarios which do not provide multi-tier vegetation (), mostly attributable to non-riparian vegetation. Under the multi-tier scenario, the proportion of simulated grids with a LDI < 0.5 is less and a LDI > 0.5 is greater than under the other two scenarios. This is especially apparent at the upper end (>0.7) of the LDI score range, showing that the addition of plantings into riparian margins increases the likelihood of a higher amenity value within dairy landscapes.
Figure 5. Frequency of estimated Landscape Diversity Index (LDI) per simulated landscape grid (100 ha) under each riparian margin scenario: S1 = grazed riparian margins; S2 = grass-strip riparian margins; S3 = multi-tier riparian margin. Graph shows distribution of simulated landscape grids (n = 79 for grazed and grass-strip riparian margin scenarios; n = 80 for multi-tier riparian margin scenario) across ranges of LDI (0–1), the greater the index the greater the landscape diversity.
4. Discussion
Our study illustrates that introducing fenced grass-strip riparian margins into dairy farming landscapes maintains or enhances the provision of food provision, water quality regulation, and contact recreation ecosystem services provided by grazed riparian margins. When non-pastoral vegetation is introduced into fenced riparian margins amenity values, an important cultural ecosystem service are also enhanced.
Our riparian margin scenarios assume uninterrupted fencing and/or planting and consistent 1 m (grass-strip) or 5 m (multi-tier) riparian margins along all waterways within our farm system and within the catchment. In reality, 100% continuous riparian margins (either grass-strip or multi-tier) are unlikely and gaps will be typical. Width of riparian margins will also vary and this will impact on functionality, although even narrow margins give some benefit (Collins et al. Citation2013). There are many areas of uncertainty when modelling ecosystem service provision which our model does not account for. We therefore take our modelled change in flows of ecosystem services as an indication of the direction of travel and maximum possible gains.
4.1. Influence of riparian management on food provision
Based on discussions with farmers, and therefore by design, modelled total milk production did not decrease in response to the loss of pastoral land and reduced herd size associated with both the grass-strip and multi-tier riparian margin scenarios, due to sustained or improved per cow milk production.
The slight additional gains in per cow milk production estimated under a multi-tier riparian margin scenario (compared to both the grazed and the grass-strip scenarios) are attributable to both the improved pasture management gained via introduction of fencing and the shade provided by the riparian-margin plantings (Betteridge Citation2014; Kendall et al. Citation2006). Shade is not just critical for animal welfare but also production, as in an attempt to reduce heat stress, cows will stop feeding to avoid generating further heat via ruminating, causing milk production to drop (Collier et al. Citation2006; Kendall et al. Citation2006). However, the shade provided by riparian-margin plantings may be allowing cows to expend energy on milk production rather than maintaining condition. This could account for stability of milk production between management scenarios despite the loss of land, rather than an increase in per cow production. Critically, the fencing and planting of riparian margins has not had a negative impact on per cow milk production.
4.2. Influence of riparian management on water quality regulation
The relatively small decrease in N loss to water under the grass-strip and multi-tier scenarios compared to the grazed scenario is unsurprising given the evidence that riparian-margin vegetation is not effective at capturing sub-surface nutrient flows (Muscutt et al. Citation1993; Parkyn Citation2004; Buckley et al. Citation2012), the primary pathway of N loss to water within our model system. Although a very slight reduction in N leaching was estimated for the multi-tier scenario over the grass-strip scenario, this estimate is a function of the farm system set-up, including herd size, within OVERSEER for each scenario, rather than increased N attenuation being attributable to the presence of riparian plantings. Where soils are not saturated and anaerobic (such as in our farm system), OVERSEER assumes that riparian margin plantings will perform no differently than vegetation outside of the riparian margin in terms of N attenuation. This suggests that riparian margins by themselves are inadequate to fully address farming-induced water quality issues where N leaching is a major factor.
The modelled scenarios estimated that P loss to water decreases by a third once riparian margins are fenced. This decrease is attributable to the change in direct deposition of excreta when livestock are excluded from waterways. OVERSEER does not account for sediment bound P entering waterways from trampling-induced stream bank erosion and therefore excluding livestock from grazing stream banks will contribute to reducing P loss to water beyond what we estimate here in situations where this is an issue. However, sediment-bound P is the greater source of P loss to water (via stream bank erosion) and this can be also be effectively addressed by livestock exclusion through fencing (McDowell and Wilcock Citation2007; Parfitt et al. Citation2013; McKergow et al. Citation2016).
4.3. Influence of riparian management on contact recreation
We estimated E. coli levels at the scale of the river network, assuming that all farms within the catchment had implemented fencing (grass-strip riparian margin scenario) or fencing and planting (multi-tier riparian margin) along all their waterways. However, these estimates are based on field data collected from a catchment where only 75% of the waterways had been fenced and are therefore potentially underestimated.
At the farm scale, the implementation of riparian-margin management will reduce E. coli contamination at that point in the river network immediately adjacent by eliminating a direct source of faecal contamination concentrations in-stream (Davies-Colley et al. Citation2004) and trapping microbes in surface runoff, although other sources of effluent entering waterways (e.g. livestock crossings, runoff from farm races, preferential flow associated with the spreading of effluents) will also need to be addressed at the farm scale (Collins et al. Citation2007; McKergow et al. Citation2016). At the river network scale, E. coli can reach levels unsafe for contact recreation if farms upstream are not implementing riparian-margin management and controlling other sources of contamination, or point source discharges such as dairy effluent disposal to water or municipal sewage treatment plant discharges occur within the catchment.
4.4. Influence of riparian management on amenity
The increase in landscape amenity under the multi-tier riparian scenario, although substantial, was not enough to shift performance above a ‘low’ level of performance. This is understandable on two counts. First, the predominant vegetation is pastoral, with other vegetation types only occurring in small, isolated, patches. Second, the inherent long but narrow structural configuration of riparian-margin plantings has a small footprint. However, in this heavily modified and homogenous landscape represented by our model catchment, even small increases in structural diversity have a disproportionate impact and the contribution of riparian-margin plantings to amenity values at the landscape level should not be underestimated. Similarly, at the farm scale, riparian-margin plantings can make a substantial difference to the visual appearance of the farm (Maseyk et al. Citation2017a).
Our model estimates amenity assuming that all landscape features; regardless of age, extent, height, or spatial configuration; provide equal amenity value, and that these values are perceived similarly by all people. This is a simplistic approach unlikely to be representative of reality (Swaffield and McWilliam Citation2013). People will also likely perceive native and exotic vegetation differently (e.g. remnant native forest vs. commercial exotic pine plantation). Further subtleties of perception of values flowing from landscape features will also occur as defined by individual value sets.
4.5. Management costs associated with riparian management
The financial costs of establishing and maintaining grass-strip or multi-tier riparian margins are not insubstantial. For example, the average cost to fence riparian margins using a two-wire electric fence (the most commonly used fencing adjacent to waterways on dairy farms) is $4/m (New Zealand dollars; NZ$1 = USD$0.71 on 12 October 2017) (DairyNZ Citation2016b). Establishing plantings increases the cost on average to $10.40/m. These costs will be further inflated on steeper land or in situations where complete replacement may be necessary, such as after extreme storm or flooding events. However, these costs need to be considered alongside the benefits accured and also the production, social, cultural, and environmental costs of not implementing riparian-margin management (e.g. grazed margin scenario). For example, the cost of livestock loss from falling into waterways is in the order of $2000 per cow and $50 per calf lost; additional labour costs of 1–2 h each event of extracting animals from waterways; and additional savings of two hours per day in winter (when there is an increased risk of animals becoming stuck) by not having to erect temporary fences around waterways. This is a real cost on-farm, with farmers participating in the 2015 workshops estimating that 2% of the herd is lost per year in the absence of fenced waterways (with an average herd size of 370 cows, fencing waterways saves $14,000/year in avoided livestock losses). A further considerable benefit identified by workshop participants was the increased safety for farm workers and contractors provided by fencing waterways (Maseyk et al. Citation2017a). This is a consequential benefit given the recent changes to health and safety legislation in New Zealand (in accordance with the Work Safe New Zealand Citation2016).
The spatial configuration of waterways on-farm will have a substantial influence on both the costs and the benefits flowing from riparian margins, and this is something that our modelling does not account for. Further the indirect costs (impacts) of excluding farm activities from riparian margins on production, grazing management, animal running costs, and so forth will differ if the waterway is on the peripheral of the farm or paddock or whether it flows through the middle. The latter could restrict livestock movement, requiring additional walking time to-and-from the milking shed, or installation of additional infrastructure (e.g. crossings) and the associated impact this has on per-head performance, health costs, and infrastructure maintenance budgets.
Further analysis of costs and benefits should be done using a whole farm system model capable of representing the impacts of the changes in infrastructure and the additional costs on the entire system (Rendel et al. Citation2013).
4.6. Implications for riparian management policy and implementation
Riparian management is a practice used to implement public policy aimed at addressing externatilities of land use activities, for example, impacts on water quality. Therefore, it is important for decision-makers and land managers to have a fuller understanding of the benefits of riparian management actions in terms of meeting policy intent. Our study provides several useful insights.
The management of nutirents such as N and P is of particular relevance within New Zealand systems for maintaining water quality. Our study supports the findings of other studies (McDowell and Wilcock Citation2007) by estimating a substantial decrease in P lost to water once livestock was excluded from waterways and stream banks. However, we show that implementing riparian margin management does little to increase performance level in preventing N loss to water. This has also been reported elsewhere (McKergow et al. Citation2016; McDowell et al. Citation2017). Riparian-margin management needs to be implemented within a more holistic approach to managing nutrients across the farm including point sources (e.g. camping areas, effluent ponds) (McKergow et al. Citation2016). These actions need to be coupled with measures to ensure nutrient management matches production levels to address issues of N leaching. Other critical aspects (e.g. clarity, temperature, pH) of providing water quality regulation services need to be further explored.
Fencing and planting of riparian margins are important contributions to maintaining contact recreation values but cannot be expected to improve contact recreation on their own for rivers where point-source discharges remain an issue at the catchment scale. This will be an issue for communities who wish to maintain contact recreation at all times at all points of the river network.
There can be resistance to implementing riparian management on-farm, with one commonly cited reason being the risk to production in reducing the area available for grazing. (Maseyk et al. Citation2017a). Our modelled estimates indicate that per cow milk production is no less as a result in the loss of grazed pasture area, and if this assumption was to hold up in a real-world situation, these concerns can be abated. We do not estimate large gains in milk production, but even a slight per cow increase in production, a current focus of the industry, is not inconsequential. Importantly, this additional income can be achieved alongside reduced livestock costs and increased environmental stewardship.
We suggest that to further understand the marginal advantage for food provision of establishing multi-tier riparian margins rather than grass strip margins, further work to more specifically quantify the effects of shade and shelter is required. Additionally, understanding how shade and shelter might impact on provision of other services (e.g. the potential for shade to encourage stock aggregating, and thus increased effluent deposition adjacent to waterways) would be beneficial.
The establishment of multi-tier riparian margins will potentially have a positive influence on the provision on a wider range of ecosystem services. As most lowland streams in New Zealand drain pastoral-dominated catchments where previous riparian-margin vegetation has been drastically reduced (Walker et al. Citation2006; Moller et al. Citation2008; Quinn et al. Citation2009), the planting of riparian margins will be critical for restoring stream function and the provision of ecosystem services long-term. In highly modified landscapes, planted margins will also contribute to and increase native representation (if not original assemblage) in the otherwise exotic-dominated landscape. Incorporating contributions of riparian-margin vegetation to terrestrial and aquatic biodiversity would allow costs and benefits of riparian-margin management to be considered simultaneously for both production and conservation values, something which currently requires greater attention (Blackwell et al. Citation2008), and obtain a greater understanding of the wider policy outcomes.
This work represents an advance in our understanding of the relationship between the management of riparian margins and the simultaneous provision of ecosystem services, and makes important initial forays into the quantification of this provision, and the marginal gains generated through different management options. Importantly, our approach allows us to integrate production, social, and environmental considerations into our assessment.
Box 1. Scale at which provision of ecosystem services was modelled.
Table_S1_S2_November2017.pdf
Download PDF (128.2 KB)Acknowledgments
The authors thank Don Shearman and Clare Ridler for data on the costs of fencing and planting, and David Wheeler and Andrew Wall for helpful comments on the manuscript.
Disclosure statement
No potential conflict of interest was reported by the authors.
Supplemental material
Supplemental data for this article can be accessed here.
Additional information
Funding
Related Research Data
References
- Balbi S, del Prado A, Gallejones P, Geevan CP, Pardo G, Pérez-Miñana E, Manrique R, Hernandez-Santiago C, Villa F. 2015. Modeling trade-offs among ecosystem services in agricultural production systems. Environ Modell Softw. 72:314–326.
- Betteridge K. 2014. Cattle want shade trees in summer. Prim Ind Manage. 18:19–21.
- Blackwell G, Fukuda Y, Maegli T, MacLeod CJ. 2008. Room for everyone? Refugia and native biodiversity in New Zealand’s agricultural landscapes. N Z J Agric Res. 51:473–476.
- Bommarco R, Kleijn D, Potts SG. 2013. Ecological intensification: harnessing ecosystem services for food security. Trends Ecol Evol. 28:230–238.
- Buckley C, Hynes S, Mechan S. 2012. Supply of an ecosystem service—farmers’ willingness to adopt riparian buffer zones in agricultural catchments. Environ Sci Policy. 24:101–109.
- Byrnes JEK, Gamfeldt L, Isbell F, Lefcheck JS, Griffin JN, Hector A, Cardinale BJ, Hooper DU, Dee LE, Emmett Duffy J. 2014. Investigating the relationship between biodiversity and ecosystem multifunctionality: challenges and solutions. Methods Ecol Evol. 5:111–124.
- Collier KJ, Cooper AB, Davies-Colley RJ, Rutherford JC, Smith CM, Williamson RB. 1995. Managing riparian zones: a contribution to protecting New Zealand’s rivers and streams. Wellington: Department of Conservation.
- Collier R, Dahl G, VanBaale M. 2006. Major advances associated with environmental effects on dairy cattle. J Dairy Sci. 89:1244–1253.
- Collins KE, Doscher C, Rennie HG, Ross JG. 2013. The effectiveness of riparian ‘restoration’on water quality—a case study of lowland streams in Canterbury, New Zealand. Restoration Ecol. 21:40–48.
- Collins R, McLeod M, Hedley M, Donnison A, Close M, Hanly J, Horne D, Ross C, Davies-Colley R, Bagshaw C. 2007. Best management practices to mitigate faecal contamination by livestock of New Zealand waters. N Z J Agric Res. 50:267–278.
- Costanza R, de Groot R, Braat L, Kubiszewski I, Fioramonti L, Sutton P, Farber S, Grasso M. 2017. Twenty years of ecosystem services: how far have we come and how far do we still need to go? Ecosystem Serv. 28:1–16.
- Costanza R, de Groot R, Sutton P, van der Ploeg S, Anderson SJ, Kubiszewski I, Farber S, Turner RK. 2014. Changes in the global value of ecosystem services. Glob Environ Change. 26:152–158.
- DairyNZ. 2016a. Budget case studies, Taranaki system 2. [accessed 2016 Jun 30].http://www.dairynz.co.nz/farm/financial/budgets/budget-case-studies/taranaki-system-2/.
- Dale VH, Polasky S. 2007. Measures of the effects of agricultural practices on ecosystem services. Ecol Econ. 64:286–296.
- Davies‐Colley RJ, Nagels JW, Smith RA, Young RG, Phillips CJ. 2004. Water quality impact of a dairy cow herd crossing a stream. N Z J Mar Freshwater Res. 38:569–576.
- de Groot R, Fisher B, Christie M, Aronson J, Braat L, Gowdy J, Haines-Young R, Maltby E, Neuville A, Polasky S, et al. 2010. Integrating the ecological and economic dimensions in biodiversity and ecosystem service valuation. In: Kumar P, editor. The economics of ecosystems and biodiversity: ecological and economic foundations. London: Earthscan; p. 9–40.
- de Groot R, Wilson MA, Boumans RMJ. 2002. A typology for the classification, description and valuation of ecosystem functions, goods and services. Ecological Econ. 41:393–408.
- Di H, Cameron K. 2002. Nitrate leaching in temperate agroecosystems: sources, factors and mitigating strategies. Nutr Cycl Agroecosyst. 64:237–256.
- Diary NZ. 2016b. Riparian planner. [accessed 2016 Sep 19]. http://www.dairynz.co.nz/environment/waterways/riparian-planner/.
- Dominati E, Patterson M, Mackay A. 2010. A framework for classifying and quantifying the natural capital and ecosystem services of soils. Ecological Econ. 69:1858–1868.
- Gordon LJ, Finlayson CM, Falkenmark M. 2010. Managing water in agriculture for food production and other ecosystem services. Agric Water Manage. 97:512–519.
- Haines-Young R, Potschin M. 2011. Common international classification of ecosystem services (CICES): 2011 update. Nottingham: The University of Notthingham, Centre for Environmental Management.
- Hewitt AE. 1998. New Zealand soil classification. Lincoln: Manaaki Whenua Press.
- Jay M. 2005. Remnants of the Waikato: native forest survival in a production landscape. N Z Geogr. 61:14–28.
- Keeler BL, Polasky S, Brauman KA, Johnson KA, Finlay JC, O’Neill A, Kovacs K, Dalzell B. 2012. Linking water quality and well-being for improved assessment and valuation of ecosystem services. Proc Natl Acad Sci. 109:18619–18624.
- Kendall P, Nielsen P, Webster J, Verkerk G, Littlejohn R, Matthews L. 2006. The effects of providing shade to lactating dairy cows in a temperate climate. Livestock Science. 103:148–157.
- [LAWA] Land and Water Aotearoa. 2016. [accessed 2016 Jun 8]. http://www.lawa.org.nz/.
- [LCDB] Land Cover Database. 2015. Land cover database version 4.1. [accessed 2016 May 20]. https://lris.scinfo.org.nz/layer/423-lcdb-v41-land-cover-database-version-41-mainland-new-zealand/
- Lee WG, Meurk CD, Clarkson BD. 2008. Agricultural intensification: whither indigenous biodiversity? N Z J Agric Res. 51:457–460.
- Livestock Improvement Corporation, Dairy NZ. 2014. [accessed 2016 Jun 30]. New zealand dairy statistics 2013–14. http://www.dairynz.co.nz/publications/dairy-industry?subject=5528.
- [MA] Millennium Ecosystem Assessment. 2003. Ecosystems and human well-being: a framework for assessment. Washington (DC): Island Press.
- Maseyk F, Dominati E, White T, Mackay A. 2017a. Farmer perspectives of the on-farm and off-farm pros and cons of planted multifunctional riparian margins. Land Use Policy. 61:160–170.
- Maseyk FJ, Mackay AD, Possingham HP, Dominati EJ, Buckley YM. 2017b. Managing natural capital stocks for the provision of ecosystem services. Conserv Lett. 10:211–220.
- McBratney A, Field DJ, Koch A. 2014. The dimensions of soil security. Geoderma. 213:203–213.
- McDowell R, Cox N, Snelder T. 2017. Assessing the yield and load of contaminants with stream order: would policy requiring livestock to be fenced out of high-order streams decrease catchment contaminant loads? J Environ Qual. 46:1038–1047.
- McDowell R, Wilcock R. 2007. Sources of sediment and phosphorus in stream flow of a highly productive dairy farmed catchment. J Environ Qual. 36:540–548.
- McDowell R, Wilcock R. 2008. Water quality and the effects of different pastoral animals. N Z Vet J. 56:289–296.
- McKergow LA, Matheson FE, Quinn JM. 2016. Riparian management: a restoration tool for New Zealand streams. Ecol Manage Restoration. 17:218–227.
- Meurk CD, Swaffield SR. 2000. A landscape ecological framework for indigenous regeneration in rural New Zealand-Aotearoa. Landsc Urban Plan. 50:129–144.
- Ministry for Primary Industries. 2012. Farm monitoring 2012. Taranaki dairy. Wellington: Ministry for Primary Industries.
- Ministry for the Environment. 2003. Microbiological water quality guidelines of marine and freshwater recreational areas. Wellington: Ministry for the Environment.
- Moller H, MacLeod CJ, Haggerty J, Rosin C, Blackwell G, Perley C, Meadows S, Weller F, Gradwohl M. 2008. Intensification of New Zealand agriculture: implications for biodiversity. N Z J Agric Res. 51:253–263.
- Muscutt AD, Harris GL, Bailey SW, Davies DB. 1993. Buffer zones to improve water quality: a review of their potential use in UK agriculture. Agric Ecosyst Environ. 45:59–77.
- OVERSEER 2016. Overseer® nutrient budgets. version 6.2.2. [accessed 2016 Jun 9]. http://www.overseer.org.nz
- Parfitt RL, Frelat M, Dymond JR, Clark M, Roygard J. 2013. Sources of phosphorus in two subcatchments of the manawatu river, and discussion of mitigation measures to reduce the phosphorus load. N Z J Agric Res. 56:187–202.
- Parkyn S. 2004. Review of riparian buffer zone effectiveness. Wellington: Ministry of Agriculture and Forestry.
- Parlimentary Commissioner for the Environment. 2015. Update report. Water quality in New Zealand: land use and nutrient pollution. Wellington: Parlimentary Commissioner for the Environment.
- Pingali PL. 2012. Green revolution: impacts, limits, and the path ahead. Proc Natl Acad Sci. 109:12302–12308.
- Plieninger T, Schleyer C, Schaich H, Ohnesorge B, Gerdes H, Hernández-Morcillo M, Bieling C. 2012. Mainstreaming ecosystem services through reformed European agricultural policies. Conserv Lett. 5:281–288.
- Quinn J, Wilcock R, Monaghan R, McDowell R, Journeaux P. 2009. Grassland farming and water quality in New Zealand. Tearmann Irish J Agric Environ Res. 7:1–14.
- Rendel JM, Mackay AD, Manderson A, O’Neill K. 2013. Optimising farm resource allocation to maximise profit using a new generation integrated whole farm planning model. Proc N Z Grassland Assoc. 75:85–90.
- Simpson EH. 1949. Measurement of diversity. Nature. 163:688.
- Swaffield SR, McWilliam W. 2013. Landscape aesthetic experience and ecosystem services. In: Dymond JR, editor. Ecosystem services in New Zealand. Lincoln: Manaaki Whenua Press; p 349–362.
- Swinton SM, Lupi F, Robertson GP, Hamilton SK. 2007. Ecosystem services and agriculture: cultivating agricultural ecosystems for diverse benefits. Ecol Econ. 64:245–252.
- Tanentzap AJ, Lamb A, Walker S, Farmer A. 2015. Resolving conflicts between agriculture and the natural environment. PLoS Biol. 13:e1002242.
- Tilman D. 1998. The greening of the green revolution. Nature. 396:211–212.
- [TRC] Taranaki Regional Council. 2011. Transforming Taranaki. The Taranaki riparian management programme. Stratford: Taranaki Regional Council.
- [TRC] Taranaki Regional Council. 2015. Taranaki as one – Taranaki Tāngata Tū Tahi. State of the environment report 2015. Stratford: Taranaki Regional Council.
- [TRC] Taranaki Regional Council. 2016. Dairying & clean streams accord. [accessed 2016 Jun 13]. http://www.trc.govt.nz/-Dairying-Clean-Streams-Accord/.
- van Oudenhoven APE, Petz K, Alkemade R, Hein L, de Groot RS. 2012. Framework for systematic indicator selection to assess effects of land management on ecosystem services. Ecol Indic. 21:110–122.
- Wagg C, Bender SF, Widmer F, van der Heijden MGA. 2014. Soil biodiversity and soil community composition determine ecosystem multifunctionality. Proc Natl Acad Sci. 111:5266–5270.
- Walker S, Price R, Rutledge D, Stephens RTT, Lee WG. 2006. Recent loss of indigenous cover in New Zealand. N Z J Ecol. 30:169–177.
- Wilcock RJ, Monaghan RM, Quinn JM, Srinivasan M, Houlbrooke DJ, Duncan MJ, Wright-Stow AE, Scarsbrook MR. 2013. Trends in water quality of five dairy farming streams in response to adoption of best practice and benefits of long-term monitoring at the catchment scale. Mar Freshwater Res. 64:401–412.
- Work Safe New Zealand. 2016. The new law health and safety at work act 2015. [accessed 2016 Oct 18]. http://www.worksafe.govt.nz/worksafe/hswa