?Mathematical formulae have been encoded as MathML and are displayed in this HTML version using MathJax in order to improve their display. Uncheck the box to turn MathJax off. This feature requires Javascript. Click on a formula to zoom.
ABSTRACT
As in other ecosystems, provision of ecosystem services from forests is uncertain because of stochastic weather conditions. In general, society is risk-averse, which means that factors increasing or decreasing the uncertainty in ecosystem services add a source of cost or value to society, measurement of which is lacking in the literature. This article suggests a method for calculating the impact of site-specific ecological conditions in Swedish forests on the economic value of uncertain ecosystem services in terms of timber and carbon sequestration. Applying econometric tools from economics and finance to time-series forest data in Sweden reveals that a site quality indicator adds positively to forest growth rate and decreases uncertainty in forest productivity and associated provision of ecosystem services. The importance of site quality is demonstrated by showing that a marginal increase in site quality can raise the economic value of timber and carbon sequestration by 9% and that neglecting uncertainty can underestimate the value of the contribution by 12%. These findings indicate that management practices improving site quality have the potential of raising the total economic value of forest ecosystem and stabilizing its volatility.
EDITED BY Antonio Lara, Alexander van Oudenhoven
1. Introduction
It is well known that forests are multifunctional and provide a number of ecosystem services, such as timber, bioenergy, biodiversity, recreational values and carbon sequestration (e.g. Pearce Citation2001). Optimal management of these services, which can be complements or substitutes in forest production, requires tools for assessing forest growth and productivity. For example, high productivity can promote timber production and carbon sequestration in growing biomass, but may be detrimental for biodiversity. In principle, current and future forest productivity depends on management practices and quality at the site, as determined by environmental, biophysical and climate conditions (see review in Noormets et al. Citation2015). Several of these factors are subject to stochastic fluctuations because of, e.g., weather conditions. Forest productivity and associated ecosystem services can then be predicted only under conditions of uncertainty. Since society is usually concerned about stability of provision of any goods and services, both the mean and variability in production of forest ecosystem services need to be assessed (e.g. Brock and Xepapadeas Citation2002; Vardas and Xepapadeas Citation2010; Gren et al. Citation2014). This means that factors affecting the variability in provision of ecosystem services provide an additional source of value or cost by reducing or increasing risk, respectively.
The aim of this study is to calculate the impact of site quality on the mean and variability in the economic value of timber and carbon sequestration. The contribution of forestry to the Swedish economy is significant, with the sector accounting for approximately 2% of GDP and 10% of total exports (SFA Citation2015). Gren and Isaacs (Citation2009) calculated the value of forest carbon sequestration in extended national and regional income accounting and found that it could correspond to 3% of extended GDP for Sweden. In this article, we consider site quality as one of several inputs into forestry and use well-known methods in economics to calculate its value as associated contribution to social net benefits of ecosystem services (e.g. Shephard Citation1970). Despite long-term use in economics, application of these methods to ecosystems with market (timber) and non-market services (carbon sequestration) is rare (e.g. Gren and Isaacs Citation2009). Specific challenges are to assess the contribution of site quality in relation to other factors and to measure its impact on uncertainty.
In this article, we present a method for estimating the impact of site quality based on forest data available for different regions in Sweden. Specifically, we apply econometric analysis to panel data over a 50-year period on forest growth, management practices and site quality indicators for different forest regions in Sweden. We include harvest of trees, fertilization, thinning and scarification as management practices, and a site quality index as a measure of given environmental conditions at the forest site. Environmental conditions at the site are commonly assessed in forestry, usually by determining a site quality index (see Bontemps & Bouriaud Citation2014 for a review). This site quality index shows the potential for tree growth under ideal conditions and is usually measured as the biomass potential at a certain age of a tree species (e.g. Skovsgaard and Vanclay Citation2008). In Sweden, calculation of the index is based on statistical assessment of multiple effects of different environmental factors at a site (Hägglund and Lundmark Citation1977). As such, the index can indicate the constraints of the ecological niche and distribution of tree species (Bontemps & Bouriaud Citation2014). There is a large body of literature on the role of biodiversity for forest productivity, mainly reporting positive effects (see meta-analyses in Piotto Citation2008; Zhang et al. Citation2012; Gamfeldt et al. Citation2013).
In our view, the novelty of this study lies in calculation of the impact of site quality on the value of uncertain timber and carbon sequestration services provided. To our knowledge, determinants of volatility in forest growth and provision of ecosystem services have not been investigated previously. The remainder of this article is organized as follows: Section 2 presents the conceptual framework of the study. The quantitative methods selected for use and the data are presented in Section 3, while results are presented in Section 4 and discussed in Section 5. Finally, Section 6 presents some conclusions.
2. Conceptual approach
The basic assumption in this study is that site quality affects the provision of ecosystem services through its effects on forest productivity, as illustrated in .
Figure 1. Conceptual approach for calculating the economic value of site quality in forest.

The calculations comprise three main steps: (i) assessment of the contribution of site quality to forest productivity, (ii) determination of the relationship between forest productivity and the value of timber and carbon sequestration and (iii) calculation of the total economic value of timber and carbon sequestration service provision. These steps are described in detail in the following.
With respect to step (i), we estimate the impacts of site quality on forest growth, which is similar to estimation of stand-level forest production and growth function in the economics literature. A common assumption is that growth follows a sigmoid form which starts at the origin (coordinates (0,0)), has a point of inflection occurring early in the adolescent stage, and approaches a maximum value, an asymptote, or peaks and falls in the senescent stage (e.g. Fekedulegn et al. Citation1999). Growth functions that display these features include theoretical models such as the logistic, Gompertz, Chapman-Richards, von Bertalanffy and Schnute functions (Fekedulegn et al. Citation1999; Nguimkeu Citation2014). However, the parameters in non-linear estimation are mostly correlated, since a change in one parameter may cause the other parameters to change in order to maintain its functional form. Introduction of other explanatory variables additively in the function may then give a misleading conclusion about the effect of these variables on the growth rate. Therefore, a linearized version of the logistic function is used in this study to examine the effect of site quality and management practices on the mean and variability in forest growth. The increase in growth in forest volume per hectare during year yt+1 is then written as a function of forest volume in the previous year yt, growth in forest volume, harvest of timber Ht, site quality Zt and a vector of management practices Xt:
where is the intrinsic growth rate, which shows the growth in productivity under ideal conditions,
is the maximum productivity,
shows the impacts on productivity of a marginal change in Zt and
shows the impact of management practices such as thinning, scarification and fertilization. The intrinsic growth rate, i.e.
, is expected to be positive. However, it is more difficult to set the a priori impact of site quality, i.e. the sign of
. The impact of site quality on forest productivity is also expected to be positive (e.g. Hägglund and Lundmark Citation1977), but the marginal impact of site quality and management practice on the growth rate of productivity is less unclear. Equations S1–S3 in the Supplementary Material show how the values of the parameters
,
,
and
are estimated.
Impacts of site quality and management practices on variability in forest productivity, Var(Yt), are estimated by following simple standard tools in finance (e.g. Fisher Citation1959; Damodaran Citation2017). We can then calculate the impact of Zt on risk by estimating the function (see equations S4–S5 in the Supplementary Material):
The parameters φ and λ, which are the main interest in this study, show the increase in volatility from a unit increase in Zt and any Xt, respectively. With respect to expected sign of the parameters, more use of an input usually implies more volatility in output for most production functions (e.g. Pope and Kramer Citation1979). Whether this holds also for ecological conditions as measured by site quality is tested in Section 4.
In step (ii) of our calculations, a full-fledged analysis of the value of timber, i.e. Ht, would require a dynamic optimization approach where the forest owner chooses the level of harvest in each period, Ht, to maximize net benefits given prices of ecosystem services and the forest growth (e.g. Sohngen and Mendelsohn Citation2003; Vass and Elofsson Citation2016). To illustrate the impacts of site quality change, we apply a more simple approach and assume that the harvest per unit area is a constant proportion of the standing volume, , where yt is standing volume per area unit. With respect to carbon sequestration, it occurs both in growing biomass and in soil, but is counteracted by carbon releases from clear-cutting and use of harvested wood products (e.g. Lal Citation2005). In our calculations, a simplification is made by assuming that these processes can be determined by constant conversion of changes in forest productivity between two subsequent periods.
Data on the unit value of timber are available from existing markets. There are currently no markets for carbon sequestration by forests in Sweden, although such markets exist in other countries (see Gren and Aklilu Citation2016 for a review). The unit value of carbon sequestration can be measured as the associated decrease in costs for reducing greenhouse gases (GHG) in other sectors in order to achieve climate targets. Another approach, which is used in this study, is to use existing taxes on emissions of GHG, since this reflects society’s valuation of emissions reduction.
In step (iii), with given unit net income from timber and carbon sequestration, PT and PC respectively, society’s benefits are determined by the value of current benefits from the two ecosystem services according to the following:
where conv is the conversion of change in forest volume to carbon dioxide equivalents (CO2e).
We introduce the role of uncertainty by assuming that society has a risk-averse attitude to fluctuations in benefits. A common approach in assessing the impact of risk on benefits is to apply a mean variance approach where the utility of the benefit, U(B), is a function of mean and variability in benefits (e.g. Markowitz Citation1989), according to the following:
where E is the expectation operator and a is the constant risk attitude, which measures how much the society dislikes risk. When a = 0, risk does not matter for society. Based on Equation (3), we calculate Var(B) as follows:
Changes in site quality thus affect total economic value as described in Equation (4) through the impact on harvest and carbon sequestration by changing mean and variability in forest productivity.
3. Quantitative methods
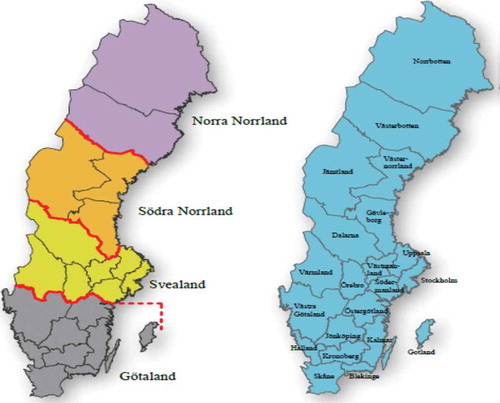
To estimate the forest productivity and risk functions displayed in Section 2, we make use of a panel data set on four different regions in Sweden for the period 1965–2013. In total, the forest area in Sweden was on average about 30.7 million hectares between 1965 and 2014, which corresponds to approximately 75% of the total land area. The four forest zones are delineated by different climate conditions (see in the Appendix). The northern forest zones (i.e. Norra and Södra Norrland) are larger and have larger forest area than the southern zones (i.e. Svealand and Götaland).
Most Swedish forest is part of the boreal coniferous belt, and Scots pine (Pinus sylvestris) and Norwegian spruce (Picea abies) dominate in all four regions, comprising between 76% and 84% of total standing volume in productive forest areas (SFA Citation2014). The most common broad-leaved tree is birch (Betula spp.), which comprises 10–15% of total standing volume. Beech (Fagus spp.) and oak (Quercus spp.) are found in the southern region Götaland, where they comprise approximately 6% of total standing volume. Standing volume measured in m3/ha varies among the four regions (see Amuakwa-Mensah and Gren Citation2016). The standing volume in Götaland is approximately twice that in North Norrland. All regions experienced a steady increase in standing volume per hectare productive forest area in the period 1965–2013 (see Amuakwa-Mensah and Gren Citation2016). In order to capture this, we introduce a trend variable as a control variable in the regression equation.
As discussed in Section 1, site quality is measured as the potential average growth of the forest under ideal conditions. In Sweden, this is expressed in an uneven-aged forest as m3 standing volume/ha at an age of 100 years (SFA Citation2014). It is based on the system suggested by Hägglund and Lundmark (Citation1977), who rank forest sites into different categories according to soil fertility and classify them depending on species composition. The classification of a forest cluster is based on statistical modelling of impacts of different site properties on tree growth, and data are obtained from plots with observations on climate, water, and nutrient variables. The data are collected at approximately 50,000 plots evenly distributed in entire Sweden (SLU Citation2017). In 1985, there was a change in the data collection procedure (SFA Citation1985).
In addition to standing volume and site quality, data are needed on management variables. The main management practices are thinning, scarification and fertilization. Data on all these variables over the period 1965–2013 for each of the four forest regions are available in the Swedish Statistical Yearbook of Forestry 1966–2014 (SFA Citation2014). We assess management practices as percentage of total productive forest area subject to thinning, scarification and fertilization. However, because of eutrophication of coastal waters in Sweden, a fertilization policy was introduced in 1985 which regulated the proportion of forest area that could be fertilized. Eutrophication is caused by excess loads of nutrients and creates damage in terms of dead sea bottom areas, increased frequency of toxic blue algae and changed composition of fish species at the expense of commercial species (e.g. Conley et al. Citation2009). These forms of damage are particularly severe for Götaland, which therefore faced more strict regulations than the rest of Sweden. The change in data collection and introduction of the fertilizer policy occurred in the same year. In our empirical estimation, we therefore introduce a dummy variable which takes a value of 1 in 1985 onwards and 0 otherwise, to capture the fertilization policy and also the change in data collection for site quality.
When estimating the impact of management practices and site quality, the dependent variable is specified as rate of growth in forest productivity over the years, as shown in equation (S4) in the Supplementary Material. Descriptive statistics on the data used in our econometric regression analysis are presented in .
Table 1. Descriptive statistics.
The mean growth rate amounts to 0.0313, although the rate is slightly higher in the southern than in the northern regions (Amuakwa-Mensah and Gren Citation2016). Negative growth rates arise from unfavourable weather conditions affecting different parts of Sweden, e.g. the Gudrun hurricane in 2005 destroyed a large volume of timber in southern Sweden. The average standing volume for all of Sweden is approximately 120 m3/ha, and it is highest in the south of Sweden and lowest in the north (Amuakwa-Mensah and Gren Citation2016). The regions in south also show the highest volatility. Thinning is generally the dominant management practice, followed by scarification.
Given the long period covered by our data, there is a risk of non-stationarity and serial correlation, as confirmed by augmented Dickey–Fuller unit root tests and Durbin Watson statistics. Therefore, we use the fully modified ordinary least square (FMOLS) developed by Phillips and Hansen (Citation1990) for estimating the regression equations for growth rate and volatility in forest productivity. FMOLS is a semi-parametric model that is robust to endogeneity and serial correlation problems. Using this approach is advantageous since the functional form of the linearized logistic function is maintained.
Based on the results from the regression equations, we calculate the effects of site quality on the value of ecosystem services related to forest productivity as described by steps (ii) and (iii) in Section 2. The regression estimates are used to parameterize the forest growth function in Equation (1), which gives information on all parameters except carrying capacity and average harvest. Data on carrying capacity are obtained by doubling the actual average productivity of 120 m3/ha (), which is a common approach in several integrated assessment models including forest as a carbon sink (e.g. Eriksson and Vesterberg Citation2016). The average harvest in relation to standing volume as expressed in Equation (1) amounts to s = 0.03, which is close to the average growth rate of 0.0313 (see ). It is assumed that this relationship prevails in each period of time, which gives Ht = 0.03yt.
In step (iii), data are needed on prices of timber and carbon, conversion of forest volume into carbon sequestration and risk aversion as shown by Equations (3) and (4) in Section 2. All economic values are expressed in SEK in 2014 prices (when 1 Euro = SEK 9.06). The price of timber is SEK 455/m3 for saw timber and SEK 284/m3 for pulpwood (SFA Citation2017). Approximately 40% of the harvested volume is used for saw timber and 50% for pulpwood (SFA Citation2017). The remainder is used for bioenergy, on which there is no official price data since much of the biomass is used by the owners of the forests (Carlsson Citation2012). The average price of forest, PT, is then SEK 360/m3.
The conversion factor of forest volume, conv in Equation (3), should reflect the CO2e per unit change in forest volume during a year, accounting for harvest and other factors. There is a large body of literature on estimation of the forest carbon sink and effects of management practices (e.g. Janssens et al. Citation2005; Helin et al. Citation2013; Lundmark et al. Citation2014). Carbon is stored in soil and aboveground biomass, but is released from clear cutting and wood products. Lundmark et al. (Citation2014) calculated the net carbon sink enhancement in Swedish forests from all these factors and found that the average value is 0.47 ton CO2e/m3 harvest, which gives conv = 0.47. This is not the same as the increment in standing volume between two periods defined in Section 2. Because of lack of data on carbon sequestration from this increment, we use the conversion for harvest, which implies a lower carbon sink enhancement per hectare since the average growth rate in standing volume is higher than the average harvest ().
With respect to the unit value of carbon sequestration, i.e. PC, there is a large body of literature on the social marginal cost of carbon, with the cost reported to vary between 50 and 2470 SEK/ton CO2e (see Tol Citation2013 for a review). In this study, we use the Swedish tax on carbon dioxide, which was introduced in the tax reform programme in 1995. The current tax level is 1080 SEK/ton CO2e.
Information on risk aversion, i.e. a in Equation (4), is not available and we therefore calculate a by assuming a certain value of the risk premium, which shows the relationship between cost of risk and expected benefits written as , where the expression for Var(B) is shown in Equation (5). According to Damodaran (Citation2017), the risk premium on return on Swedish assets in 2014 amounted to 0.061. We assume that this risk premium is the same for return on benefits from timber and carbon sequestration in Swedish forest. The average variance in yt amounts to 964 (). The expected benefit is calculated as E[B] = (PT+conv.PC)H, which gives SEK 2715/ha. The calculated risk aversion is then a = 0.000493.
4. Results
Based on modelling approach and data presented in Sections 2 and 3, we present results from estimation of growth rate and variability in forest productivity and associated calculations of the total economic value.
4.1 Site quality and forest productivity
The results of the regression equations for growth rate and variability in forest productivity show that site quality improves the growth rate and reduces volatility ().
Table 2. Regression results from fully modified ordinary least square (FMOLS) of growth rate and variance in forest productivity for Sweden (t-values in brackets).
With respect to the regression model with growth rate in forest productivity measures, the constant shows the intrinsic growth rate β1 (see Supplementary Material). The significant estimate of 0.13 is close to the estimates of intrinsic growth rate in boreal forests at the large scale, which amounts to 0.11 (e.g. Eriksson and Vesterberg Citation2016). Standing volume has the expected negative sign, i.e. the growth rate in forest productivity is low at high productivity levels. Site quality is significant and positive. The marginal impact of site quality is about 0.0023, i.e. growth rate increases by 0.0023 with a one-unit increase in site quality. This result confirms reports of a positive effect of an indicator of diversity (tree species) on forest productivity (Piotto Citation2008; Zhang et al. Citation2012).Scarification is the only management practice with significant effects, which are shown to be negative.
When estimating volatility as a function of site quality and management practices, the regression results in pass the fitness criteria. The results show that marginal increases in site quality and scarification reduce volatility. This impact of site quality is in line with the expectations of a stabilizing impact of biodiversity on growth rate (e.g. Ives and Carpenter Citation2007; Campbell et al. Citation2011). On the other hand, forest productivity and thinning seem to have the opposite effect. The effects of the other management variables are mixed. The negative sign for the policy indicator implies that the volatility in standing volume is significantly lower for periods with the policy than for periods without the policy.
The predicted growth rate in forest productivity at the average value of all explanatory variables amounts to 0.030, which is close to the average growth rate of 0.031 in . The corresponding predicted variance is lower than the average of 964 in . We therefore use the results from the predicted variance in the regression equation and assume the same proportional differences between the average and predicted variance.
4.2 Calculation of total economic value
Given the parameterizations of the growth rate and volatility functions, we predict levels of standing volume and variance for levels of site quality ranging between 3 and 9, which correspond to the lowest and highest values of the site quality index in our data set displayed in . Expected benefits and costs of risk are then calculated for each site quality level, following the principles and data described in Sections 2 and 3. The predictions show linear increases in expected benefits and linear decreases in costs of risk of timber and carbon sequestration from marginal increases in the site quality index ().
Figure 2. Expected benefits and costs of risk for timber and carbon sequestration at different levels of site quality, SEK/ha.
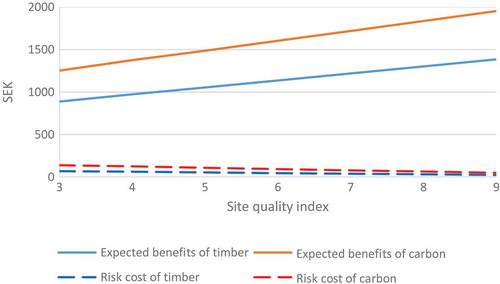
The expected benefits from timber and carbon show an increase by 55% from the lowest to highest site quality index, and the cost of risk are reduced by 64%. These constitute the maximum impacts of site quality since climate conditions differ in the northern and southern forests in Sweden.
Even if the level of site quality index differs among regions, the increase in expected benefits and decrease in cost of risk of a unit increase in the site quality index is the same for the regions and amounts in total to 223 SEK/ha (). In addition to calculating the contribution of site quality to the economic value of forests, we calculate total economic value of the forest.
Table 3. Calculated total economic value and average contribution of a one-unit increment in site quality to the total economic value of timber and carbon sequestration, SEK/ha.
The expected benefits of forest more than double when the value of carbon sink enhancement is included and amount to SEK 2715/ha. This is reduced to SEK 2540/ha when deducting the cost of risk. In contrast, the value of a unit increase in site quality is increased by approximately 11% because of the associated reduction in risk and associated cost. Similar to the total economic value, the main part (60%) of the total value of the incremental increase in site quality is obtained from carbon sequestration.
5. Discussion
Given the estimates of the growth rates and variability in forest productivity, the calculated economic values rest heavily on assumptions on the price of timber, carbon sequestration and risk aversion. To evaluate the robustness of the results presented in , in a sensitivity analysis, the values of these three parameters are changed.
The chosen weighted reference price of timber of SEK 360/m3 is relatively low when compared with the fluctuations in the price during the study period, which ranged between SEK 305/m3 and SEK 680/m3 (SFA Citation2017). We therefore calculate the economic value of forest and site quality at the average price of SEK 493/m3. Our reference cost of carbon emissions of SEK 1080/ton CO2e is the highest carbon tax in the world. It can be compared with the price of carbon on the European carbon emissions trading market, which fluctuated between 45 and 300 SEK/ton CO2 during the period 2007–2014 (Sandbag Citation2017). Calculations are therefore made for a carbon price at the upper limit of the allowance price, which corresponds to 28% of the Swedish CO2 tax.
With respect to choice of risk aversion, there is a large body of literature in finance on estimation of risk premiums on returns on traded assets (e.g. Damodaran Citation2017). It is questionable whether such estimates can be transferred to carbon sequestration. One argument against the use of carbon sequestration in climate policy is the uncertainty compared with a certain reduction in emissions from fossil fuel, because of stochastic weather conditions (Gren and Aklilu Citation2016). Existing markets for trade in forest carbon show that the price of the forest carbon sink is approximately 60% of a certain reduction in fossil fuel emissions by replacement of fossil energy with e.g., solar energy in developing countries (Conte and Kotchen Citation2010). This can be interpreted as a risk premium of 40%, which is considerably higher than our assumption of 6.1%. No data are available on the corresponding risk premium on the forest carbon sink in Sweden, and we therefore simply examine the implications of higher risk aversion by assuming a doubling of the reference risk aversion for carbon sink.
shows the contribution to total economic value from an increase in site quality of one unit for each of these changes separately, and when they act simultaneously.
Figure 3. Economic value of the contribution of increasing site quality by one unit for different prices of timber and carbon sequestration, and risk aversion, SEK/ha. See Table A1 for the data.
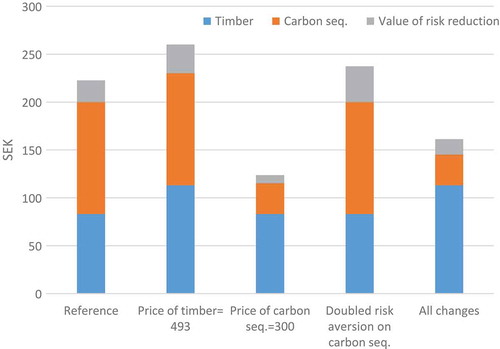
The largest effect occurs for the decrease in carbon price to SEK 300/ton m3, for which the contribution is reduced by 45% compared with the reference case. The contribution is increased when higher timber price and risk aversion are assumed. The latter effect may be regarded as a contradiction. In general, higher risk aversion results in larger costs of risk and thereby lower net benefits, as shown in Equation (3). This is also the case for the total economic value per hectare forest, which is reduced by 5% when risk aversion is doubled ( in Appendix). The value of site quality instead increases, since it reduces risk. The contribution of a reduction in the cost of risk ranges between 7% and 19% of the expected value. On the other hand, the consideration of risk reduces the economic value of forest at most by 12% ( in Appendix).
Admittedly, these results rest not only on the assumed prices of the ecosystem services studied and risk attitudes, but also on the use of a simple sigmoid growth function. The latter has been criticized for neglecting the composition of tree ages, the assumption of constant intrinsic growth rate, and the proportional relationship between volume growth and pressure intensity (e.g. Clark Citation2010). Choices of other functions, such as age-structured models, might give other predictions of forest growth. On the other hand, it would be difficult to estimate such functions at regional and national scale while including our explanatory variables of interest. Nevertheless, our estimates of intrinsic forest growth rate for Sweden are close to results obtained in other studies (Eriksson and Vesterberg Citation2016). We cannot compare our results on the effect of site quality on forest growth and value of timber and carbon sequestration, since we are not aware of any similar studies.
Another factor not considered in this study is the eventual responses in forest management if policies compensating for carbon sequestration were to be introduced in Sweden, as has been done in other countries (Gren and Aklilu Citation2016). In a simplification made in this study, timber and carbon sequestration are related to harvest. However, carbon sequestration is more complex and depends on biomass growth, litter and soil conditions. Introduction of payments for carbon sequestration is likely to result in changes in harvest and forest management in order to optimize the long-term net benefits of both timber and carbon sequestration (Gren and Aklilu Citation2016), which will affect the total economic value and contribution of site quality
6. Conclusions
With respect to the main aim of this study, the results show that site quality contributes to the economic value of timber and carbon sequestration in Swedish forests in two ways: by increasing growth rate and by decreasing variability in forest productivity. Using the estimated forest growth function to calculate the effect of changes in site quality on the economic value of timber and carbon sequestration from forests in Sweden reveals that the contribution from a one-unit increase in site quality amounts to SEK 223/ha, which corresponds to 9% of the total economic value of the forest. The value of carbon sequestration accounts for 60% of the contribution of site quality and the value of reduction in risk to 12%. Our calculations also show that the magnitude of these values is sensitive to assumptions on the prices of timber and carbon, and on risk attitudes. Sensitivity analyses indicate that neglecting uncertainty can underestimate the economic value of site quality by 20% of the expected value.
Although our empirical results are valid only for the Swedish conditions, the suggested approach is generalized to any other spatial scale where the determinants of mean and variability in forest ecosystem services are of concern for society. Our findings of a positive marginal effect on the rate of forest growth and a negative effect on volatility of site quality can have implications for forest management in two respects. One is that exclusion of risk in provision of ecosystem services overestimates their economic value, and thereby the supply when compared with the costs of providing the services. The other is that the consideration of risk creates a source of value for site quality, the neglect of which implies a non-optimal use of other inputs such as labour and capital. Improved understanding of these implications requires more knowledge along three main future research directions. One is the analysis of the determinants of site quality and interaction with management practices. A second is the estimation of links between forest productivity and provision of forest ecosystem services, and the third arena includes the identification, estimation and valuation of uncertainty.
Table A1: Calculated total economic value and average contribution of a one-unit increment in site quality to the total economic value of timber and carbon sequestration for changes in prices of timber (PT), carbon sequestration (PC), and risk aversion, SEK/ha.
TBSM_A_1472143_SupplementaryMaterial.pdf
Download PDF (282.5 KB)Acknowledgment
We are much indebted to the editors and two anonymous reviewers for useful comments.
Disclosure statement
No potential conflict of interest was reported by the authors.
Supplementary material
Supplemental data for this article can be accessed here.
Additional information
Funding
Related Research Data
References
- Amuakwa-Mensah F, Gren I-M. 2016. Fungi diversity in Swedish forests: impact of site quality on standing volume and variability in forest growth. Uppsala; [accessed 2017 Feb 24]. http://pub.epsilon.slu.se/13678/.
- Bontemps J-D, Bouriaud O. 2014. Predictive approaches to forest site productivity: recent trends, challenges and future perspectives. For Int J For Res. 87:109–128. https://academic.oup.com/forestry/article/87/1/109/597454/Predictive-approaches-to-forest-site-productivity.
- Brock W, Xepapadeas A. 2002. Biodiversity management under uncertainty. In: Kriström B, Dasgupta P, Löfgren KG, editors. Econ theory environ essays honour K-G Mäler. UK: Edward Elgar.
- Campbell V, Murphy G, Romanuk TN. 2011. Experimental design and the outcome and interpretation of diversity–stability relations. Oikos. 120:399–408.
- Carlsson M. 2012. Bioenergy from the Swedish forest sector: a partial equilibrium analysis of supply costs and implications for the forest product markets [Licentiate thesis]. Uppsala: Swedish University of Agricultural Sciences; [accessed 2017 May 19]. https://pub.epsilon.slu.se/9117/.
- Clark CW. 2010. Mathematical bioeconomics: the mathematics of conservation. 3 ed. Hoboken (NJ): Wiley.
- Conley DJ, Björck S, Bonsdorff E, Carstensen J, Destouni G, Gustafsson BG, Hietanen S, Kortekaas M, Kuosa H, Markus Meier HE, et al. 2009. Hypoxia-related processes in the Baltic Sea. Environ Sci Technol. 43:3412–3420.
- Conte M, Kotchen M. 2010. Explaining the price volatility of carbon offsets. Clim Chang Econ. 1:93–111. http://environment.yale.edu/kotchen/pubs/explain.pdf.
- Damodaran A. 2017. Country risk: determinants, measures and implications – the 2017 edition. Rochester (NY): Social Science Research Network. [accessed 2017 Feb 27]. https://papers.ssrn.com/abstract=3000499.
- Eriksson M, Vesterberg A. 2016. When not in the best of worlds: uncertainty and forest carbon sequestration. Umea: CERE – the Center for Environmental and Resource Economics. [accessed 2017 May 15]. https://ideas.repec.org/p/hhs/slucer/2016_004.html.
- Fekedulegn D, Mac Slurtain MP, Colbert JJ. 1999. Parameter estimation of nonlinear growth models in forestry. Silva Fenn. 33:327–336.
- Fisher L. 1959. Determinants of risk premiums on corporate bonds. J Polit Econ. 67:217–237. http://www.jstor.org/stable/1827443.
- Gamfeldt L, Snäll T, Bagchi R, Jonsson M, Gustafsson L, Kjellander P, Ruiz-Jaen MC, Fröberg M, Stendahl J, Philipson CD, et al. 2013. Higher levels of multiple ecosystem services are found in forests with more tree species. Nat Commun. 4:1340. http://www.nature.com/ncomms/journal/v4/n1/full/ncomms2328.html.
- Gren I-M, Aklilu AZ. 2016. Policy design for forest carbon sequestration: a review of the literature. For Policy Econ. 70:128–136. http://www.sciencedirect.com/science/article/pii/S1389934116301253.
- Gren I-M, Baxter P, Mikusinski G, Possingham H. 2014. Cost-effective biodiversity restoration with uncertain growth in forest habitat quality. J For Econ. 20:77–92. http://www.sciencedirect.com/science/article/pii/S1104689913000457.
- Gren I-M, Isaacs L. 2009. Ecosystem services and regional development: an application to Sweden. Ecological Econ. 68:2549–2559. https://ac.els-cdn.com/S0921800909001219/1-s2.0-S0921800909001219-main.pdf?_tid=02849205-056c-4dea-ad80-8d55fed261f7&acdnat=1524390588_6717b907643d1b294e25a68d7eccc29d.
- Hägglund B, Lundmark J-E. 1977. Site index estimation by means of site properties. Stockholm; [accessed 2017 Apr 17]. http://pub.epsilon.slu.se/5587/.
- Helin T, Sokka L, Soimakallio S, Pingoud K, Pajula T. 2013. Approaches for inclusion of forest carbon cycle in life cycle assessment - a review. Bioenergy. 5:475–486.
- Ives AR, Carpenter SR. 2007. Stability and diversity of ecosystems. Science. 317:58–62. http://science.sciencemag.org/content/317/5834/58.
- Janssens L, Freibauer A, Schlamadinger B, Ceulemans R, Ciais P, Dolman A, Heimann M, Nabuurs G-J, Smith P, Valentini R, et al. 2005. The carbon budget of terrestrial ecosystems at country-scale a European case study. Biogeosciences. 2:15–26.
- Lal R. 2005. Forest soils and carbon sequestration. For Ecol Manag. 220:242–258. http://www.sciencedirect.com/science/article/pii/S0378112705004834.
- Lundmark T, Bergh J, Hofer P, Lundström A, Nordin A, Poudel BC, Sathre R, Taverna R, Werner F. 2014. Potential role of Swedish forestry in the context of climate change mitigation. Forestry. 5:557–578. https://www.gsfacket.se/globalassets/darfor-ska-sverige-bygga-hus-i-tra/slu.pdf.
- Markowitz HM. 1989. Mean—variance analysis. In: Eatwell J, Milgate M, Newman P, editors. Finance. London: Palgrave Macmillan; p. 194–198. https://link.springer.com/chapter/10.1007/978-1-349-20213-3_21.
- Nguimkeu P. 2014. A simple selection test between the Gompertz and Logistic growth models. Technol Forecast Soc Change. 88:98–105. http://www.sciencedirect.com/science/article/pii/S0040162514002170.
- Noormets A, Epron D, Domec JC, McNulty SG, Fox T, Sun G, King JS. 2015. Effects of forest management on productivity and carbon sequestration: a review and hypothesis. For Ecol Manag. 355:124–140. http://www.sciencedirect.com/science/article/pii/S0378112715002881.
- Pearce DW. 2001. The economic value of forest ecosystems. Ecosyst Health. 7:284–296.
- Phillips PCB, Hansen BE. 1990. Statistical inference in instrumental variables regression with I(1) processes. Rev Econ Stud. 57:99–125. http://www.jstor.org/stable/2297545.
- Piotto D. 2008. A meta-analysis comparing tree growth in monocultures and mixed plantations. For Ecol Manag. 255:781–786. http://www.sciencedirect.com/science/article/pii/S0378112707007360.
- Pope RD, Kramer RA. 1979. Production uncertainty and factor demands for the competitive firm. South Econ J. 46:489–501. http://www.jstor.org/stable/1057421.
- Sandbag. 2017. EU carbon price falls below 4 Euro. [accessed 2017 Feb 14]. https://sandbag.org.uk/2016/09/02/eu-carbon-price-falls-below-e4-2/.
- SFA (Swedish Forestry Agency). 1985. Swedish forestry yearbook 1985. [accessed 2016 Mar 15]. https://www.skogsstyrelsen.se/globalassets/statistik/historisk-statistik/skogsstatistisk-arsbok-1980-1989/skogsstatistisk-arsbok-1985.pdf.
- SFA (Swedish Forestry Agency). 2014. Swedish Statistical Yearbook of Forestry. SkogsSverige; [accessed 2017 Mar 17]. https://www.skogsstyrelsen.se/en/statistics/historical-statistics/.
- SFA (Swedish Forestry Agency). 2015. Forests and forestry in Sweden. [accessed 2018 Apr 10]. https://www.skogsstyrelsen.se/globalassets/in-english/forests-and-forestry-in-sweden_2015.pdf.
- SFA (Swedish Forestry Agency). 2017. Prices on roundwood. [accessed 2017 Mar 24]. https://www.skogsstyrelsen.se/globalassets/statistik/statistiska-meddelanden/rundvirkespriser-jo0303/2016-rundvirkespriser-sm-jo0303.pdf.
- Shephard R. 1970. Theory of cost and production functions. Princeton (NJ): Princeton University Press.
- Skovsgaard JP, Vanclay JK. 2008. Forest site productivity: a review of the evolution of dendrometric concepts for even-aged stands. For Int J For Res. 81:13–31. https://academic.oup.com/forestry/article/81/1/13/623066/Forest-site-productivity-a-review-of-the-evolution.
- SLU (Swedish University of Agricultural Sciences). 2017. The Swedish national forest inventory. [accessed 2017 Feb 24]. https://www.slu.se/en/Collaborative-Centres-and-Projects/the-swedish-national-forest-inventory/about-us/how-we-work/.
- Sohngen B, Mendelsohn R. 2003. An optimal control model of forest carbon sequestration. Am J Agric Econ. 85:448–457. http://www.jstor.org/stable/1245140.
- Tol RSJ. 2013. Targets for global climate policy: an overview. J Econ Dyn Control. 37:911–928. http://www.sciencedirect.com/science/article/pii/S0165188913000092.
- Vardas G, Xepapadeas A. 2010. Model uncertainty, ambiguity and the precautionary principle: implications for biodiversity management. Environ Resour Econ. 45:379–404. https://link.springer.com/article/10.1007/s10640-009-9319-z.
- Vass MM, Elofsson K. 2016. Is forest carbon sequestration at the expense of bioenergy and forest products cost-efficient in EU climate policy to 2050? J For Econ. 24:82–105. http://www.sciencedirect.com/science/article/pii/S1104689916300071.
- Zhang Y, Chen HYH, Reich PB. 2012. Forest productivity increases with evenness, species richness and trait variation: a global meta-analysis. J Ecol. 100:742–749.
Appendix
Figure A1: Forest zones and counties in Sweden
Source: Swedish Forest Data, 2014 report. Department of Forest Resource Management, SLU NB: Norra and Södra Norrland are North and South Norrland, respectively.