
 ?Mathematical formulae have been encoded as MathML and are displayed in this HTML version using MathJax in order to improve their display. Uncheck the box to turn MathJax off. This feature requires Javascript. Click on a formula to zoom.
ABSTRACT
In many cases, initiation is rate limiting to transcription. This due in part to the multiple cycles of abortive transcription that delay promoter escape and the transition from initiation to elongation. Pausing of transcription in initiation can further delay promoter escape. The previously hypothesized pausing in initiation was confirmed by two recent studies from Duchi et al.Citation1 and from Lerner, Chung et al.Citation2 In both studies, pausing is attributed to a lack of forward translocation of the nascent transcript during initiation. However, the two works report on different pausing mechanisms. Duchi et al. report on pausing that occurs during initiation predominantly on-pathway of transcript synthesis. Lerner, Chung et al. report on pausing during initiation as a result of RNAP backtracking, which is off-pathway to transcript synthesis. Here, we discuss these studies, together with additional experimental results from single-molecule FRET focusing on a specific distance within the transcription bubble. We show that the results of these studies are complementary to each other and are consistent with a model involving two types of pauses in initiation: a short-lived pause that occurs in the translocation of a 6-mer nascent transcript and a long-lived pause that occurs as a result of 1–2 nucleotide backtracking of a 7-mer transcript.
Prolonged periods during which RNA polymerase (RNAP) resides in a specific state can be used for efficient control and regulation of DNA transcription. This drives us to study the slow processes that limit the overall rate of transcription.
Transcription is generally divided into three major stages: initiation, elongation and termination, where initiation is usually the rate-limiting stage. Initiation can be further divided into sub-stages.Citation3,4 First, the RNA polymerase (RNAP) holoenzyme is formed by the association of the core enzyme (subunit composition α2,β,β′,ω) with the specificity subunit σ. Different σ factors recognize specific promoter sequences of various groups of genes. The major σ factor in Escherichia coli, σ70, is responsible for recognition of promoters for house-keeping genes. After association with the RNAP holoenzyme, σ70 binds to the promoter DNA to form the RNAP promoter closed complex (RPc), which involves binding at two hexamer sequences centered around positions −10 and −35 relative to the +1 transcription start site. After binding to the promoter, RNAP forms the RNAP promoter open complex (RPo) through successive isomerization steps.Citation5,6 During this process around 13 bp of DNA (from registers −11 to +2) must melt to form the transcription bubble. The sequence of the template strand of the transcription bubble serves as a reading guide for the polymerization of an RNA transcript through base complementation. The two most downstream DNA bases in the template strand of the transcription bubble are coordinated with the active site of RNAP, where the addition of NTPs into the 3′ end of the nascent transcript occurs. The downstream fork of the transcription bubble is located near the active site, facing the RNAP secondary channel, through which NTP substrates enter.Citation7 The upstream fork of the transcription bubble is located between σ70 regions 2 and 3. In initiation, the entrance to the exit channel is blocked by the acidic tip of the σ finger domain (region 3.2, σR3.2), while the exit out of the channel is blocked by σ region 4 (σR4). Structural and biochemical data indicate that RNAP transition to elongation requires a substantial spatial rearrangement of several RNAP domains, including the opening of the β′ clamp and β flap,Citation4,8 and the displacement of σR3.2 and σR4 from the exit channel.Citation9 It has been suggested that this rearrangement leads to destabilization of σ-promoter and σ-RNAP interactions, thereby facilitating transcript elongation and promoter escape.Citation10 Promoter escape is considered to be the main rate-limiting step in initial transcription, after RPo formation.
Initial transcript synthesis occurs via a DNA scrunching mechanism, whereby downstream dsDNA is reeled into the transcription bubble by promoter-bound RNAP, enabling incorporation of NTPs into the growing nascent transcript.Citation11,12 DNA scrunching leads to melting of dsDNA downstream to the bubble. However, in initiation, the upstream fork of the bubble is held tightly by interactions with σR2 and σR3. This leads to a net increase in the size of the transcription bubble in initiation, resulting in the formation of what is better known as a “stressed intermediate.”Citation13,14 In this intermediate, each increase in bubble size is energetically compensated by an increase in the number of transcript bases hybridized to the template strand. Still, this complex is considered “stressed” due to the additional space inside the RNAP–promoter complex that has to be allocated for the DNA bases added into the bubble by scrunching. As initial transcription proceeds, the nascent transcript grows longer with its 5′ end approaching the negatively charged tip of the σ finger.Citation15,16 The resulting clash is assumed to trigger the removal of the exit channel blockage, inducing promoter escape.Citation10,15,17,18 Nevertheless, the stronger the affinity of σ to the promoter, the more probable this encounter will not lead to the additional forward-translocation required to remove the σ finger blockage from the exit channel. Instead, this may lead to successive back-translocation of the downstream fork with concomitant shrinking of the bubble and extrusion of the short nascent RNA through the secondary channel, ultimately resulting in abortive transcript release.Citation19-22 After release, the complex reverts to the RPo state for another attempt of RNA synthesis.Citation14,23-25 Multiple cycles of abortive transcription may occur until the exit channel blockage is successfully removed, enabling the transition to elongation and the production of full RNA transcripts. Until recently, the conventional view was that promoter escape is a rate-limiting step in transcription due to multiple abortive initiation cycles, where each cycle of abortive release could be rapid.Citation14,26-28 However, experimental data indicate that the release of abortive transcripts is relatively slow, which may impede each single abortive cycle.Citation25,29 This calls for a thorough investigation of the abortive release process.
The crystal structures of transcription initiation complexes carrying a nascent transcript of 4–5 nucleotides,Citation16 and up to 6 nucleotides in lengthCitation30 have been obtained. Structural analysis of the transcription bubble and the nascent transcript in these complexes suggests that, starting from a 5-mer nascent transcript, a steric clash forms between the acidic tip of the σ finger and the phosphates of the 5′ end of the nascent transcript.Citation16,31 The steric clash and the electrostatic repulsion between the two negatively charged groups grows larger the closer they get.Citation10,15,17,18 Repulsive forces may lead to the expulsion of the σ finger, elimination of the blockage of the entrance into the RNA exit channel and may induce subsequent disruption of σ-promoter interactions. Alternatively, repulsion between the groups may push the nascent transcript that leads to DNA anti-scrunching with concomitant back-translocation of the nascent transcript and extrusion of the RNA 3′ end into the secondary channel. Successive back-translocation steps ultimately lead to abortive release. However, in each step of back-translocation, the distance between the 5′ end of the nascent transcript and the acidic tip of the σ finger increases, reducing the steric and electrostatic repulsions between the two groups. In the presence of other stabilizing interactions, the backtracked transcript may be temporally stabilized in the complex instead of being immediately released through the secondary channel. The backtracked nascent RNA may be stabilized, for instance, through electrostatic attraction between the phosphate groups of the extruded portion of nascent RNA and the positively charged surface of the secondary channel. as access of new NTPs into the active site is blocked by the extruded RNA, this stabilization may lead to transcriptional pausing. Additionally, structural data suggests the non-electrostatic interactions between the 5′ end nucleotide and acidic tip of the σ finger may actually contribute to stabilization of the nascent transcript in the complex.Citation16,30 Pausing in initiation may also occur without backtracking. As the nascent transcript grows beyond the length of 6- or 7-mer, the electrostatic and steric repulsion forces may also impede the movement of the nascent transcript from pre-translocated to post-translocated states.
Experimental evidence of pausing during transcription initiation
In elongation, transcriptional pausing due to backtracking has been extensively characterized both in vitro and in vivo.Citation19,32-36 Pausing and backtracking were hypothesized to occur in initiation, based on the observations of initiation stalling,Citation25,29 enhancement of promoter clearance by GreA and GreB, and the susceptibility of abortive transcripts to cleavage by Gre factors.Citation9,14,18,37-44 Recently, using different experimental approaches, Duchi et al.Citation1 and Lerner, Chung et al.Citation2 have provided direct evidence of E. coli RNAP transcription pausing during initiation at a modified lac promoter, lacCONS.Citation45 Lerner, Chung et al. measured the kinetics of single-round transcription reactions with unlabeled reconstituted RNAP holoenzyme and promoter DNA free in solution. They observed that formation of a full-length transcript starting from a late initiation stage (e.g., initially transcribing RNAP promoter complex, ITC, synthesizing abortive transcripts of up to 7 nucleotides (nt) in length, RPITC≤ 7) was delayed as compared with transcription starting from early initiation stages (order of delays: RPITC≤ 7 > RPITC≤ 6 > RPITC≤ 4 > RPITC = 2). The average delay in transcription kinetics was several minutes. These results implied on transcriptional pausing, associated with certain states in initiation. At the lacCONS promoter, transition to elongation occurs when the transcript reaches a length of 11 nt;Citation26,46,47 therefore, RPITC≤ 7, RPITC≤ 6, RPITC≤ 4 and RPITC = 2 states exist during initiation. Control experiments showed that the kinetics of a single-round run-off transcription reaction starting from an early elongation complex carrying an 11-mer transcript (RDE11) was almost identical to that starting from an early initiation complex (RPITC = 2). One possible explanation for these observations was that transcriptional pausing occurs due to backtracking. Lerner, Chung et al. also found that the transcriptional pausing reported above is reduced in the presence of GreA. In elongation, transcript cleavage factors GreA and GreB catalyze hydrolysis of the 3′-terminal portion of the nascent transcript that has backtracked into the secondary channel.Citation48-50 This action of Gre factors enables re-association of the newly generated RNA 3′-terminus with the active site, thus rescuing RNAP from the paused-backtracked state and ultimately increasing transcription activity. Gre factors act by inserting their coiled-coil domain into the RNAP secondary channel. Two acidic residues in the tip of the coiled-coil loop stabilize the 3′ end of the backtracked transcript and coordinate the essential Mg2+ ion at the RNAP active site, catalyzing the endonucleolytic reaction. Under the assumption that GreA acts by the same mechanism in initiation and in elongation, Lerner, Chung et al. concluded that the observed delay in the synthesis of the full-length transcript is due to backtracking-associated pausing during transcription initiation. Moreover, the observed abortive transcripts produced by RPITC≤ 7 in the absence of GreA included 5-, 6- and 7-mer RNAs, whereas abortive transcripts produced in the presence of GreA contained mostly a 6-mer RNA and only trace amounts of 5-mer and 7-mer RNAs. These results suggested that GreA promoted cleavage of 1–2 backtracked nucleotides. As stated above, a stabilizing interaction between the 5′-terminal nucleotide and the tip of the σ finger has been proposed based on the analysis of one of the structures of the initiation complex.16 If backtracking does occur, transcripts carrying a 5′ OH group are expected to back-translocate due to steric clash with the σ finger, while transcripts carrying a negatively charged triphosphate group at the 5′ end are expected to be even further back-translocated due to electrostatic repulsion by the acidic tip of the σ finger. Interestingly, Lerner, Chung et al. have shown that the delay in transcription starting from RPITC≤ 7 was longer when the 5′ end of the transcript contained a triphosphate group (5′-priming of transcription with pppApA), compared with when it contained an uncharged OH group (5′-priming with ApA) (see Supplementary information in Ref. Citation2). This observation suggested that the forces that induce backtracking are both steric and electrostatic. At the same time, the contribution of the stabilizing interaction between the tip of the σ finger and the 5′-terminal nucleotide of the nascent transcript (deduced from the crystal structureCitation16) may still occur but to a lesser extent.
These experiments were performed using a partial set of NTPs that only allowed formation of RPITC≤ 7. It was crucial to examine the phenomenon of pausing in initiation with all four NTPs at concentrations comparable to physiologic NTP pools (under standard conditions, 0.1–1.0 mM).Citation51 In addition, the abovementioned experiments provided an indirect evidence for pausing due to backtracking in transcription initiation.
Single-molecule experiments offer direct observation of biochemical events with individual molecules. To follow the actual progression of transcription complex from initiation to elongation, Lerner, Chung et al. tracked the size of the transcription bubble of individual DNA molecules in real-time. They used a magnetic tweezers assay, which applies tension on and tracks the height of a magnetic bead attached to a surface-tethered DNA carrying the lacCONS promoter sequence. In this assay, the dsDNA is negatively supercoiled to a given level by rotating the magnetic bead. This supercoiling forms plectonemes in the DNA. In this mode of supercoiling, melting of base pairs induces an increase in the number of plectonemes, lowering in the height of the bead. Therefore, the height of the bead is a direct measure of the number of melted bases involved in the transcription bubble. When DNA is free and not bound to RNAP, no DNA bubble is formed, setting a maximum bead height. Bubble opening during transcription lowers the bead height and upon initiation, DNA scrunching leads to increase in bubble size and further lowers bead height. Unlike in initiation, the bubble size is minimal in elongation and bead height increases (but not up to the level of an unbound DNA) for a short time, because elongation is fast.Citation52-55 If backtracking occurs during initiation, back-translocation leads to anti-scrunching, which in turn leads to decrease in bubble size. This should lead to a decrease in bubble size relative to scrunched bubble size in initiation but not as small a bubble size as in elongation, leading to a bead higher than in scrunching in initiation but lower than in elongation. Additionally, if the backtracked state is associated with pausing, dwell time in this state is expected to be longer than in the scrunched initiation state. This assay allowed Lerner, Chung et al. to observe traces of bead height as a function of time, corresponding to states of the DNA bubble during a complete transcription cycle from free DNA, to initiation, elongation, and back to free DNA. When GreA was present, initiation-associated dwells were short-lived (350 ± 30 s) and had a minimal bead height compatible with maximal bubble size (16.2 ± 0.2 bp). However, in the absence of GreA, a nonnegligible portion of initiation-associated dwells was long-lived (4,600 ± 2,700 s) and had transcription bubbles with decreased sizes (80% with 14.8 ± 0.4 bp and 20% with 9.9 ± 0.3 bp). These results suggested direct evidence of pausing in transcription initiation associated with backtracking.
Although magnetic tweezer transcription assays allow the observation of full transcription cycles at the single-molecule level for long periods of times (∼10,000 s per molecule on average), they require molecule-by-molecule measurement, which makes accumulating statistics from many single molecules time consuming. In addition, the time resolution for the observation of bubble size-associated transitions is 1 s (average of 31 Hz), which precludes fast kinetic analysis. An alternative method of following transcription of single molecules in real-time by changes in the bubble size is by monitoring changes in FRET efficiency between two fluorescent dyes, placed at positions upstream and downstream from the bubble. Duchi et al. performed such experiments and their results are quite intriguing. Upon supplying the partial set of NTPs that allows reaching RPITC≤ 7, they observed transcriptional pausing that lasts on average 20 s in a state where the size of the bubble corresponds to a scrunched initiation complex carrying a 6-mer transcript (RPITC = 6). The size of this bubble can also correspond to a complex carrying a 7-mer transcript (RPITC = 7) after one nucleotide backtracking. In both states, six DNA bases are scrunched into the bubble (RPbubble = 6). In some of the FRET traces, Duchi et al. observed long dwell times in RPbubble = 6 following short excursions of 5 s on average into RPbubble = 7, which the authors referred to as pausing after backtracking. In single-molecule FRET (smFRET), one of the main limitations is that single-molecule observation times are limited by fluorophore photobleaching. In cases of states with dwell times longer than the available observation time, this may lead to observation of FRET states without a characterized dwell time. Some of the traces were long enough (400 s) to suggest pausing at RPbubble = 6 for times longer times (> 400 s). While 55% of these long smFRET traces have shown both fast (∼8 s) and slow (∼55 s) cycling between the paused state in RPbubble = 6 and RPo, 45% of these FRET traces show pausing in RPbubble = 6 for periods that encompass the whole observation time. Overall, these results were interpreted by Duchi et al. as events that were either on-pathway, or off-pathway of transcript synthesis, as part of backtracking and abortive release. However, in this model, the shorter lived paused state in RPITC = 6 on-pathway of transcript synthesis (∼20 s) was viewed as rate limiting. This interpretation was justified due to the majority of FRET traces showing pausing at RPbubble = 6 without first reaching RPbubble = 7; hence, it served as a plausible explanation given the experimental results. In addition, the authors explained that the long-lived RPbubble = 6 paused states could not represent backtracked states since the long-lived paused RPbubble = 6 state started without prior excursions to RPbubble = 7, required for pausing after backtracking. Yet, it may well be that such prior excursions to RPbubble = 7 before backtracking to RPbubble = 6 occur faster than the reported time resolution (integration into bins of 200 ms). In the magnetic tweezers experiments, with a time resolution of 1 s, Lerner, Chung et al. also observed bubble size changes from no bubble in free DNA directly to its scrunched form in initiation. The pausing times observed with magnetic tweezers transcription assays (4,600 ± 2,700 s) were much longer than typical single-molecule trajectory observation times (a few hundreds of seconds) and may be the extension of the stably paused state reported by Duchi et al. The magnetic tweezer experiments of Lerner, Chung et al. showed clear GreA dependence of both dwell times and bubble sizes in initiation-associated dwells. Thus, repeating these experiments in the presence of GreA may help validate the interpretation proposed by Duchi et al. If the paused state of RPbubble = 6 corresponds to RPITC = 6, with no backtracking, GreA will not affect its dwell time. Alternatively, if RPbubble = 6 corresponds to RPITC = 7, with one nucleotide backtracked, then GreA should induce transcript cleavage, thereby decreasing the dwell time of the paused state.
Additional experimental evidence showing the decrease in bubble size in the paused-backtracked initiation intermediate
To show that pausing in initiation can be rate-limiting during promoter escape, and to discriminate this pausing from events related to inactive (moribund) initiation complexes,Citation56 we performed microsecond alternating laser excitation (μsALEX) smFRET measurementsCitation57,58 using doubly labeled lacCONS promoter DNAs that are freely diffusing in a confocal setup. In this type of smFRET measurement, the proximity ratio (PR; FRET efficiency uncorrected for leakage, direct excitation and γ factor, see the Appendix) is reported for individual molecules transiting through the detection volume during very short bursts (typically ms). The PR values of many different single-molecule bursts are accumulated in histograms in which only abundant and stable states are represented as distinct sub-populations. Similar to the approach taken by Duchi et al., we also tracked the PR between the dyes placed at various positions around the transcription bubble. The labeled promoter DNA used for these experiments were chosen based on the following criteria: (i) exhibiting significant change in PR upon bubble opening; (ii) exhibiting significant promoter bubble opening activity (POA) upon incubation of RNAP; and (iii) exhibiting significant promoter escape activity (PEA) upon incubation with all NTPs (see the appendix). We tested five doubly labeled lacCONS promoter constructs for these criteria and the results are summarized in . For the sake of clarity, we use the following nomenclature to indicate a doubly labeled promoter, (+10)TA−(−5)NTD is a construct with an acceptor dye (ATTO647N) on a template base at register (+10) and with a donor dye (ATTO550 or Cy3B) on a nontemplate base at register (−5). In the case of (+10)TA−(−5)NTD and (−8)TA−(+10)NTD, the change in PR due to bubble opening was expected to be minuscule as expected from assessment of the crystal structure,Citation30 and indeed the differences between their PR histograms in free DNA, RPo and run-off conditions (after addition of all NTPs) are small. Fitting the PR histograms to constrained double Gaussians yielded POA and PEA values that were either small or negligible. One construct that is expected to exhibit a large increase in PR moving from free DNA to RPITC = 2 is a construct in which one dye is upstream and another is downstream from the bubble region, such as in (+15)TA−(−15)NTD (donor Cy3B). This construct exhibits a sub-population with increased PR values compared with that of the free DNA sub-population. Yet, POA and PEA are small. Interestingly, during initiation the constructs with both dyes in the bubble region, (−8)TA−(−5)NTD and (−8)TA−(−3)NTD (donor ATTO550) exhibit lower PR values compared with the free promoter sub-population, due to increase in the size of the bubble and plausible activities (> 45% POA and PEA), especially with respect to the (−8)TA−(−5)NTD construct. We therefore chose to report initiation effects using the construct that exhibits substantial POA (0.71 ± 0.02) and PEA (0.71 ± 0.05) values that are the largest among the set of doubly labeled promoter constructs tested. It is important to mention that the kinetics of transcription starting from RPITC = 2, measured by the single round quenched kinetics assay,Citation2 was very similar to the promoter escape kinetics measured by Ingargiola et al. with an 8×1 multispot smFRET setup, following the open bubble sub-population in (−8)TA−(−5)NTD after addition of all NTPs.Citation59 This indicates that promoter escape kinetics of RPITC = 2 with dyes in the bubble region follow similar run-off kinetics for unlabeled DNA.
Figure 1. Promoter bubble opening activity (POA) and promoter escape activity (PEA) of doubly labeled lacCONS promoter dsDNA. Each panel reports the proximity ratio histogram for FRET between donor (D; ATTO550 or Cy3B in the case of (+15)TA−(−15)NTD) and acceptor (A) labeling different promoter registers on either the template (T) or the nontemplate (NT) strands. From left to right, two panels report results for both dyes in the bubble region in initiation, the third panel reports results when one dye was upstream from the bubble region in initiation and the other was downstream from it, and the last two panels report results when one dye was in the bubble region in initiation, while the other downstream from it. From top to bottom, shown are proximity ratios of the free promoter DNA, in within the RPITC = 2 initiation complex and after run-off should have occurred following supply of all four NTPs. f, g and h represent the fraction of the sub-population that is not the major one in the measurement of free promoter DNA and their values are reported as a result of a constrained two Gaussian fit (see the appendix). Promoter bubble opening activity (POA) and promoter escape activity (PEA) are calculated from these fractions as described in the appendix.
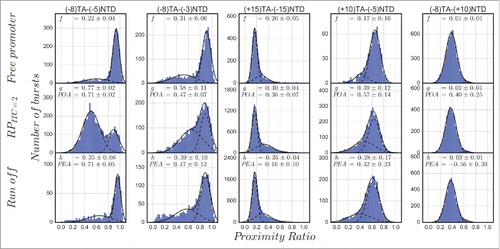
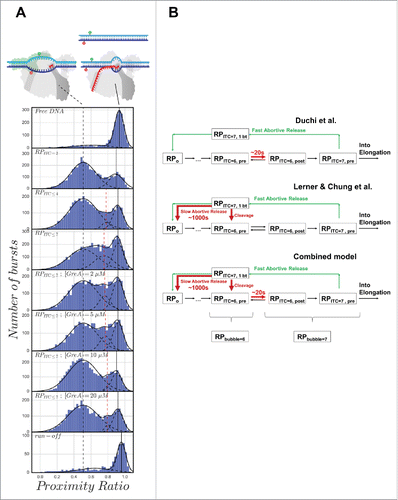
We then compared the PR histograms of the initiation complex in different states () including: RPITC = 2 (RPo in the presence of 500 μM pppApA), RPITC≤ 4 (RPo in the presence of 500 μM pppApA, 100 μM UTP), RPITC≤ 7 (RPo in the presence of 500-μM pppApA, 100 μM UTP and GTP) and RPITC≤ 7 in the presence of increasing concentrations of GreA (2, 5, 10 and 20 μM). The solid black vertical line on the right denotes the peak of high PR, corresponding to the sub-population of free promoter DNA or RPc state. The peak PR value of this sub-population is not expected to change dramatically. The dashed black vertical line denotes the peak of the center value of PR for the open transcription bubble sub-population in RPITC = 2. The dashed red vertical line denotes the peak of the center value of PR for any additional PR sub-population that may appear as a result of scrunching, backtracking, or response to GreA binding. In general the bubble size changes due to DNA scrunching, but it is not clear whether this change will be reflected in PR values of the open transcription bubble sub-population for this construct (−8)TA−(−5)NTD. The crystal structures of initiation complexes corresponding to different steps in initiation show only minor changes in the distance between DNA bases at registers (−8) and (−5) of the template and nontemplate strands, respectively.Citation16,60 Considering the bulky size of the dyes (including the linkers), the distance between the dyes attached to these bases may not show substantial change in PR upon scrunching. The PR histogram for RPITC = 2 includes two sub-populations with peak PR values 0.90 ± 0.02 and 0.51 ± 0.03 of DNA with closed and opened bubble, respectively. These two PR sub-populations also appear in all other measured initiation states, namely in RPITC≤ 4, RPITC≤ 7 in the absence and presence of GreA (, solid and dashed vertical black lines). Upon moving from RPITC = 2 to RPITC≤ 4, we identify an additional sub-population with a peak PR value that is intermediate between the values of the closed and opened DNA bubble (0.77 ± 0.04; , vertical red line). However, in RPITC≤ 4, the contribution of this additional sub-population to the overall PR histogram is small (5%). It is only in RPITC≤ 7 that the contribution of this intermediate sub-population is maximal (24%). This may indicate a large portion of initiation complexes with reduced bubble sizes that are abundant and long-lived enough to be represented in a PR histogram of freely diffusing single molecules. This finding is in agreement with both Lerner, Chung et al. magnetic tweezers findings and smFRET studies of immobilized initiation complexes published by Duchi et al. Subsequently, we tested the response of the open bubble PR sub-population in RPITC≤ 7 as a function of increasing concentrations of GreA. The results show that GreA decreases the contribution of the intermediate PR sub-population to the overall PR histogram close to the levels observed in RPITC = 2 (down to 3% in 20 μM GreA), as if no change in the bubble size had occurred. We interpret these results to indicate that pausing in initiation occurs due to backtracking, which causes reduction in bubble size, and which is reversed by the action of GreA.
Figure 2. (A) Proximity ratio histograms exhibit a sub-population with decreased transcription bubble size in RPITC≤ 7, which is reversible by addition of increasing amounts of GreA. Proximity ratio histograms of (−8)TA−(−5)NTD are shown. From top to bottom, histograms are shown for the conditions indicated in the labels of each panel. The solid black vertical line denotes the peak PR of a sub-population whereby the DNA between the dyes is annealed (either free promoter DNA or RNA-promoter closed complex, see vignettes). The dashed black vertical line denotes the peak proximity ratio the melted DNA in the open bubble sub-population in RPITC = 2 (see vignette). The dashed red vertical line denotes the peak proximity ratio of a sub-population that is intermediate between the sub-populations of closed and opened bubble DNA. Sample preparation, measurement and analysis performed as explained by Ingargiola et al.,Citation59 only with triphosphate adenylyl(3′–5′) adenosine (pppApA, generously provided as a gift by Prof. Richard Ebright), instead of adenylyl(3′–5′) adenosine (ApA). Sub-population fitting analysis was performed as described in the appendix. (B) Two different paused initiation states as described by Duchi et al.Citation1 and by Lerner, Chung et al.,Citation2 and a model that combines both types of initiation pausing. RPITC = 6, pre and RPITC = 6, post denote RPITC = 6 with the 3′-terminal base positioned at the pre- and post-translocated sites in RNAP, respectively. RPITC = 7, pre is defined in the same way as RPITC = 6, pre, but for a 7-mer nascent transcript. RPITC = 7, 1 bt denotes an initiation complex with a 7-mer nascent transcript backtracked by one base.
Conclusions – a unified model of pausing in transcription initiation
Our experimental results complement those reported by Duchi et al. We propose that there are two types of pausing in initiation at the lacCONS promoter. One is short-lived (∼20 s) and involves formation of RPITC = 6 (with RPbubble = 6) with the nascent transcript 3′ end in the pre-translocated position (RPITC = 6, pre), as suggested by Duchi et al. Another pausing is long-lived (thousands of seconds) and involves formation of RPITC = 7 (with RPbubble = 6) with nascent RNA backtracked by one nucleotide (). As multiple occurrences of a short-lived pausing would be equivalent to a few long-lived pauses, both pauses may contribute to the rate-limiting nature of promoter escape. An experiment demonstrating that GreA functions during initiation the same way that it does during pausing and backtracking in elongation would support the mechanism we proposed here.
Disclosure of potential conflicts of interest
No potential conflicts of interest were disclosed.
Authors' contributions
EL and SW designed this study; EL developed, designed and performed the smFRET measurements and analyzed the data, in consultation with AI and X.M; JJL and SB prepared GreA protein; EL, SB, XM and SW wrote the point of view.
Acknowledgments
We thank Dr. SangYoon Chung for fruitful discussions, Ms. Maya Segal for language editing and Mrs. Maya Lerner for preparation of illustrative vignettes of RNAP and promoter DNA, and also Prof. Richard Ebright for generously providing us with the triphosphate dinucleotide pppApA, as a gift. SW discloses equity in Nesher Technologies and intellectual property used in the research reported here. The work at UCLA was conducted in Dr. Weiss's Laboratory. The content is solely the responsibility of the authors and does not necessarily represent the official views of the National Institutes of Health.
Funding
This work was supported by the NIH under grant numbers GM069709 (to SW) and GM095904 (to XM and SW); NSF under grant number MCB-1244175 (to SW).
References
- Duchi D, Bauer DL, Fernandez L, Evans G, Robb N, Hwang LC, Gryte K, Tomescu A, Zawadzki P, Morichaud Z et al. RNA polymerase pausing during initial transcription. Mol Cell 2016; 63:939-50; PMID:5031556; http://dx.doi.org/10.1016/j.molcel.2016.08.011
- Lerner E, Chung S, Allen BL, Wang S, Lee J, Lu SW, Grimaud LW, Ingargiola A, Michalet X, Alhadid Y et al. Backtracked and paused transcription initiation intermediate of Escherichia coli RNA polymerase. Proc Natl Acad Sci USA 2016; 113:E6562-71; PMID:27729537; http://dx.doi.org/10.1073/pnas.1605038113
- Young BA, Gruber TM, Gross CA. Views of transcription initiation. Cell 2002; 109:417-20; PMID:12086598; http://dx.doi.org/10.1016/S0092-8674(02)00752-3
- Murakami KS, Darst SA. Bacterial RNA polymerases: the whole story. Curr Opin Struct Biol 2003; 13:31-9; PMID:12581657; http://dx.doi.org/10.1016/S0959-440X(02)00005-2
- Saecker RM, Record MT, Jr, Dehaseth PL. Mechanism of bacterial transcription initiation: RNA polymerase–promoter binding, isomerization to initiation-competent open complexes, and initiation of RNA synthesis. J Mol Biol 2011; 412:754-71; PMID:3440003; http://dx.doi.org/10.1016/j.jmb.2011.01.018
- Ruff EF, Record MT, Jr., Artsimovitch I. Initial events in bacterial transcription initiation. Biomolecules 2015; 5:1035-62; PMID:26023916; http://dx.doi.org/10.3390/biom5021035
- Zhang G, Campbell EA, Minakhin L, Richter C, Severinov K, Darst SA. Crystal structure of Thermus aquaticus core RNA polymerase at 3.3 A resolution. Cell 1999; 98:811-24; PMID:10499798; http://dx.doi.org/10.1016/S0092-8674(00)81515-9
- Sengupta S, Prajapati RK, Mukhopadhyay J. Promoter escape with bacterial two-component sigma factor suggests retention of sigma region two in the elongation complex. J Biol Chem 2015; 290(47):28575-83; http://dx.doi.org/10.1074/jbc.M115.666008
- Hsu LM. Promoter escape by Escherichia coli RNA polymerase. EcoSal Plus 2008; 3; PMID:26443745; http://dx.doi.org/10.1128/ecosalplus.4.5.2.2
- Murakami KS, Masuda S, Campbell EA, Muzzin O, Darst SA. Structural basis of transcription initiation: an RNA polymerase holoenzyme-DNA complex. Science 2002; 296:1285-90; PMID:12016307; http://dx.doi.org/10.1126/science.1069595
- Kapanidis AN, Margeat E, Ho SO, Kortkhonjia E, Weiss S, Ebright RH. Initial transcription by RNA polymerase proceeds through a DNA-scrunching mechanism. Science 2006; 314:1144-7; PMID:17110578; http://dx.doi.org/10.1126/science.1131399
- Revyakin A, Liu C, Ebright RH, Strick TR. Abortive initiation and productive initiation by RNA polymerase involve DNA scrunching. Science 2006; 314:1139-43; PMID:17110577; http://dx.doi.org/10.1126/science.1131398
- Straney DC, Crothers DM. A stressed intermediate in the formation of stably initiated RNA chains at the Escherichia coli lac UV5 promoter. J Mol Biol 1987; 193:267-78; PMID:2439694; http://dx.doi.org/10.1016/0022-2836(87)90218-X
- Hsu LM. Promoter clearance and escape in prokaryotes. Biochim Biophys Acta 2002; 1577:191-207; PMID:12213652; http://dx.doi.org/10.1016/S0167-4781(02)00452-9
- Pupov D, Kuzin I, Bass I, Kulbachinskiy A. Distinct functions of the RNA polymerase sigma subunit region 3.2 in RNA priming and promoter escape. Nucleic Acids Res 2014; 42:4494-504; PMID:24452800; http://dx.doi.org/10.1093/nar/gkt1384
- Zuo Y, Steitz TA. Crystal structures of the E. coli transcription initiation complexes with a complete bubble. Mol Cell 2015; 58:534-40; http://dx.doi.org/10.1016/j.molcel.2015.03.010
- Mekler V, Kortkhonjia E, Mukhopadhyay J, Knight J, Revyakin A, Kapanidis AN, Niu W, Ebright YW, Levy R, Ebright RH. Structural organization of bacterial RNA polymerase holoenzyme and the RNA polymerase-promoter open complex. Cell 2002; 108:599-614; PMID:11893332; http://dx.doi.org/10.1016/S0092-8674(02)00667-0
- Samanta S, Martin CT. Insights into the mechanism of initial transcription in Escherichia coli RNA polymerase. J Biol Chem 2013; 288:31993-2003; PMID:24047893; http://dx.doi.org/10.1074/jbc.M113.497669
- Epshtein V, Mustaev A, Markovtsov V, Bereshchenko O, Nikiforov V, Goldfarb A. Swing-gate model of nucleotide entry into the RNA polymerase active center. Mol Cell 2002; 10:623-34; PMID:12408829; http://dx.doi.org/10.1016/S1097-2765(02)00640-8
- Hsu LM, Cobb IM, Ozmore JR, Khoo M, Nahm G, Xia L, Bao Y, Ahn C. Initial transcribed sequence mutations specifically affect promoter escape properties. Biochemistry 2006; 45:8841-54; PMID:16846227; http://dx.doi.org/10.1021/bi060247u
- Martinez-Rucobo FW, Cramer P. Structural basis of transcription elongation. Biochim Biophys Acta 2013; 1829:9-19; PMID:22982352; http://dx.doi.org/10.1016/j.bbagrm.2012.09.002
- Weixlbaumer A, Leon K, Landick R, Darst SA. Structural basis of transcriptional pausing in bacteria. Cell 2013; 152:431-41; PMID:23374340; http://dx.doi.org/10.1016/j.cell.2012.12.020
- Carpousis AJ, Gralla JD. Cycling of ribonucleic acid polymerase to produce oligonucleotides during initiation in vitro at the lac UV5 promoter. Biochemistry 1980; 19:3245-53; PMID:6996702; http://dx.doi.org/10.1021/bi00555a023
- Luse DS, Jacob GA. Abortive initiation by RNA polymerase II in vitro at the adenovirus 2 major late promoter. J Biol Chem 1987; 262:14990-7; PMID:3667620
- Ellinger T, Behnke D, Bujard H, Gralla JD. Stalling of Escherichia coli RNA polymerase in the +6 to +12 region in vivo is associated with tight binding to consensus promoter elements. J Mol Biol 1994; 239:455-65; PMID:8006961; http://dx.doi.org/10.1006/jmbi.1994.1388
- Straney DC, Crothers DM. Intermediates in transcription initiation from the E. coli lac UV5 promoter. Cell 1985; 43:449-59; PMID:2416465
- Margeat E, Kapanidis AN, Tinnefeld P, Wang Y, Mukhopadhyay J, Ebright RH, Weiss S. Direct observation of abortive initiation and promoter escape within single immobilized transcription complexes. Biophys J 2006; 90:1419-31; PMID:1367292; http://dx.doi.org/10.1529/biophysj.105.069252
- Tang GQ, Roy R, Ha T, Patel SS. Transcription initiation in a single-subunit RNA polymerase proceeds through DNA scrunching and rotation of the N-terminal subdomains. Mol Cell 2008; 30:567-77; PMID:2459238; http://dx.doi.org/10.1016/j.molcel.2008.04.003
- Brodolin K, Zenkin N, Mustaev A, Mamaeva D, Heumann H. The sigma 70 subunit of RNA polymerase induces lacUV5 promoter-proximal pausing of transcription. Nat Struct Mol Biol 2004; 11:551-7; PMID:15122346; http://dx.doi.org/10.1038/nsmb768
- Basu RS, Warner BA, Molodtsov V, Pupov D, Esyunina D, Fernandez-Tornero C, Kulbachinskiy A, Murakami KS. Structural basis of transcription initiation by bacterial RNA polymerase holoenzyme. J Biol Chem 2014; 289:24549-59; PMID:24973216; http://dx.doi.org/10.1074/jbc.M114.584037
- Murakami KS, Masuda S, Darst SA. Structural basis of transcription initiation: RNA polymerase holoenzyme at 4 A resolution. Science 2002; 296:1280-4; PMID:12016306; http://dx.doi.org/10.1126/science.1069594
- Foster JE, Holmes SF, Erie DA. Allosteric binding of nucleoside triphosphates to RNA polymerase regulates transcription elongation. Cell 2001; 106:243-52; PMID:11511351; http://dx.doi.org/10.1016/S0092-8674(01)00420-2
- Sousa R. A new level of regulation in transcription elongation? Trends Biochem Sci 2001; 26:695-7; PMID:11738586; http://dx.doi.org/10.1016/S0968-0004(01)02000-X
- Holmes SF, Erie DA. Downstream DNA sequence effects on transcription elongation. Allosteric binding of nucleoside triphosphates facilitates translocation via a ratchet motion. J Biol Chem 2003; 278:35597-608; PMID:12813036; http://dx.doi.org/10.1074/jbc.M304496200
- Nedialkov YA, Gong XQ, Hovde SL, Yamaguchi Y, Handa H, Geiger JH, Yan H, Burton ZF. NTP-driven translocation by human RNA polymerase II. J Biol Chem 2003; 278:18303-12; PMID:12637520; http://dx.doi.org/10.1074/jbc.M301103200
- Bar-Nahum G, Epshtein V, Ruckenstein AE, Rafikov R, Mustaev A, Nudler E. A ratchet mechanism of transcription elongation and its control. Cell 2005; 120:183-93; PMID:15680325; http://dx.doi.org/10.1016/j.cell.2004.11.045
- Borukhov S, Sagitov V, Goldfarb A. Transcript cleavage factors from E. coli. Cell 1993; 72:459-66; PMID:8431948; http://dx.doi.org/10.1016/0092-8674(93)90121-6
- Feng GH, Lee DN, Wang D, Chan CL, Landick R. GreA-induced transcript cleavage in transcription complexes containing Escherichia coli RNA polymerase is controlled by multiple factors, including nascent transcript location and structure. J Biol Chem 1994; 269:22282-94; PMID:8071355
- Hsu LM, Vo NV, Chamberlin MJ. Escherichia coli transcript cleavage factors GreA and GreB stimulate promoter escape and gene expression in vivo and in vitro. Proc Natl Acad Sci USA 1995; 92:11588-92; PMID:8524809; http://dx.doi.org/10.1073/pnas.92.25.11588
- Shaevitz JW, Abbondanzieri EA, Landick R, Block SM. Backtracking by single RNA polymerase molecules observed at near-base-pair resolution. Nature 2003; 426:684-7; PMID:14634670; http://dx.doi.org/10.1038/nature02191
- Stepanova E, Lee J, Ozerova M, Semenova E, Datsenko K, Wanner BL, Severinov K, Borukhov S. Analysis of promoter targets for Escherichia coli transcription elongation factor GreA in vivo and in vitro. J Bacteriol 2007; 189:8772-85; PMID:17766423; http://dx.doi.org/10.1128/JB.00911-07
- Goldman SR, Ebright RH, Nickels BE. Direct detection of abortive RNA transcripts in vivo. Science 2009; 324:927-8; PMID:19443781; http://dx.doi.org/10.1126/science.1169237
- Stepanova E, Wang M, Severinov K, Borukhov S. Early transcriptional arrest at Escherichia coli rplN and ompX promoters. J Biol Chem 2009; 284:35702-13; PMID:19854830; http://dx.doi.org/10.1074/jbc.M109.053983
- Skancke J, Bar N, Kuiper M, Hsu LM. Sequence-dependent promoter escape efficiency is strongly influenced by bias for the pre-translocated state during initial transcription. Biochemistry 2015; 54(28):4267-75; PMID:26083830; http://dx.doi.org/10.1021/acs.biochem.5b00272
- Kim S, Streets AM, Lin RR, Quake SR, Weiss S, Majumdar DS. High-throughput single-molecule optofluidic analysis. Nat Methods 2011; 8:242-5; PMID:21297618; http://dx.doi.org/10.1038/nmeth.1569
- Hansen UM, McClure WR. Role of the sigma subunit of Escherichia coli RNA polymerase in initiation. II. Release of sigma from ternary complexes. J Biol Chem 1980; 255:9564-70; PMID:7000759
- Krummel B, Chamberlin MJ. RNA chain initiation by Escherichia coli RNA polymerase. Structural transitions of the enzyme in early ternary complexes. Biochemistry 1989; 28:7829-42; PMID:2482070
- Toulme F, Mosrin-Huaman C, Sparkowski J, Das A, Leng M, Rahmouni AR. GreA and GreB proteins revive backtracked RNA polymerase in vivo by promoting transcript trimming. EMBO J 2000; 19:6853-9; PMID:305891; http://dx.doi.org/10.1093/emboj/19.24.6853
- Borukhov S, Lee J, Laptenko O. Bacterial transcription elongation factors: new insights into molecular mechanism of action. Mol Microbiol 2005; 55:1315-24; PMID:15720542; http://dx.doi.org/10.1111/j.1365-2958.2004.04481.x
- Reppas NB, Wade JT, Church GM, Struhl K. The transition between transcriptional initiation and elongation in E. coli is highly variable and often rate limiting. Mol Cell 2006; 24:747-57; PMID:17157257; http://dx.doi.org/10.1016/j.molcel.2006.10.030
- Buckstein MH, He J, Rubin H. Characterization of nucleotide pools as a function of physiological state in Escherichia coli. J Bacteriol 2008; 190:718-26; PMID:17965154; http://dx.doi.org/10.1128/JB.01020-07
- Wang MD, Schnitzer MJ, Yin H, Landick R, Gelles J, Block SM. Force and velocity measured for single molecules of RNA polymerase. Science 1998; 282:902-7; PMID:9794753; http://dx.doi.org/10.1126/science.282.5390.902
- Adelman K, La Porta A, Santangelo TJ, Lis JT, Roberts JW, Wang MD. Single molecule analysis of RNA polymerase elongation reveals uniform kinetic behavior. Proc Natl Acad Sci USA 2002; 99:13538-43; PMID:12370445; http://dx.doi.org/10.1073/pnas.212358999
- Abbondanzieri EA, Greenleaf WJ, Shaevitz JW, Landick R, Block SM. Direct observation of base-pair stepping by RNA polymerase. Nature 2005; 438:460-5; PMID:16284617; http://dx.doi.org/10.1038/nature04268
- Abbondanzieri EA, Shaevitz JW, Block SM. Picocalorimetry of transcription by RNA polymerase. Biophys J 2005; 89:L61-3; PMID:1367007; http://dx.doi.org/10.1529/biophysj.105.074195
- Susa M, Sen R, Shimamoto N. Generality of the branched pathway in transcription initiation by Escherichia coli RNA polymerase. J Biol Chem 2002; 277:15407-12; PMID:11854291; http://dx.doi.org/10.1074/jbc.M112481200
- Kapanidis AN, Laurence TA, Lee NK, Margeat E, Kong X, Weiss S. Alternating-laser excitation of single molecules. Acc Chem Res 2005; 38:523-33; PMID:16028886; http://dx.doi.org/10.1021/ar0401348
- Lee NK, Kapanidis AN, Wang Y, Michalet X, Mukhopadhyay J, Ebright RH, Weiss S. Accurate FRET measurements within single diffusing biomolecules using alternating-laser excitation. Biophys J 2005; 88:2939-53; PMID:1282518; http://dx.doi.org/10.1529/biophysj.104.054114
- Ingargiola A, Lerner E, Chung S, Panzeri F, Gulinatti A, Rech I, Ghioni M, Weiss S, Michalet X. Multispot single-molecule FRET: high-throughput analysis of freely diffusing molecules. bioRxiv 2016; http://dx.doi.org/10.1101/085027
- Bae B, Feklistov A, Lass-Napiorkowska A, Landick R, Darst SA. Structure of a bacterial RNA polymerase holoenzyme open promoter complex. eLife 2015; 4; PMID:4593229; http://dx.doi.org/10.7554/eLife.08504
- Nir E, Michalet X, Hamadani KM, Laurence TA, Neuhauser D, Kovchegov Y, Weiss S. Shot-noise limited single-molecule FRET histograms: comparison between theory and experiments. J Phys Chem B 2006; 110:22103-24; PMID:17078646; http://dx.doi.org/10.1021/jp063483n
- Ingargiola A, Lerner E, Chung S, Weiss S, Michalet X. FRETBursts: an open source toolkit for analysis of freely-diffusing single-molecule FRET. PLoS One 2016; 11:e0160716; PMID:27532626; http://dx.doi.org/10.1371/journal.pone.0160716
- Ingargiola A, Laurence T, Boutelle R, Weiss S, Michalet X. Photon-HDF5: an open file format for timestamp-based single-molecule fluorescence experiments. Biophys J 2016; 110:26-33; PMID:4805879; http://dx.doi.org/10.1016/j.bpj.2015.11.013
Appendix
In single-molecule μsALEX analysis, three streams of photons are analyzed: donor and acceptor fluorescence photons during green laser excitation (noted here as DD and DA, respectively), and acceptor photons during red laser excitation (noted here as AA). Burst photon counts in each of these photon streams, are background-corrected by subtracting the burst duration times the background rate. A dual channel burst search (DCBS; intersection of bursts from green excitation burst search and red excitation burst search)Citation61 is performed using m = 10 and F = 6, to isolate the FRET data from non-FRET data (Donor-Only and Acceptor Only) for further analysis. Next, the following two conditions are used to filter smFRET burst data:
| 1. | | ||||
| 2. | | ||||
where nDD, nDA and nAA are the number of photons in a burst in streams DD, DA and AA, respectively, corrected for background counts. Then, proximity ratio, PR, is calculated for each burst:PR is related to FRET efficiency; however, it is not corrected for leakage of donor fluorescence into the acceptor detection channel (lk), direct excitation of the acceptor with the laser intended for donor excitation (dir) and for the ratio of donor acceptor fluorescence quantum yields and the ratio of detection efficiencies of the 2 detection channels (γ factor). We assume the values of these correction values are similar for a given doubly labeled DNA construct across different states. We compare relative results; thus, we report on PR and not on FRET efficiency.
To calculate the promoter bubble opening activity (POA) and the promoter escape activity (PEA), PR histograms of doubly labeled promoter in its free dsDNA (free promoter) form, RPITC = 2 and run-off forms were fitted to two Gaussian functions. PR sub-populations can be approximated by a Gaussian function. Nevertheless, the quality of Gaussian fits, being functions with no skewness, is affected by the skewness of the distribution toward peak PR value of 0.5. The farther the peak PR value is from 0.5, the larger this skewness is. We approximated the PR histograms with fitting of two Gaussians, where one Gaussian described the sub-population of promoter DNA that is free of binding to RNAP. The second sub-population represented the conformation of the open transcription bubble. However, due to the skewness of PR sub-populations toward a peak value of 0.5, it is possible that some spurious bursts with peak PR values outside the free promoter sub-population may also contribute to the second sub-population. For this reason, we constrained the fitting to two Gaussians with the major PR sub-population in free promoter, and we used the area under the second PR sub-population to quantify ratiometric quantities related to bubble opening activity and bubble closure upon promoter escape activity. We defined f, g and h as the fraction of the histogram that is occupied by the sub-population with center PR values. f for free promoter, g for RPITC = 2 and h for run-off. We defined two quantities:
| 1. | Promoter bubble opening activity: | ||||
| 2. | Promoter escape activity: PEA = | ||||
The definition of POA accounts for the relative increase in the fraction of bursts in the second PR sub-population, due to addition of initiation complexes with opened transcription bubble. The definition of PEA accounts for the relative decrease in the fraction of bursts in the second PR sub-population, due to bubble movement to downstream DNA, which leads to DNA re-annealing of the bubble region in initiation. This definition also takes into account that some bursts in the second PR sub-population are spurious and seen in measurement of the free promoter. The error estimation of these activity values are propagated, using these equations, from the fitting errors on f, g and h.
To quantify the presence of PR sub-populations and their contributions to the PR histograms in , we fitted a function of sum of Gaussians to the PR histograms. As in , we used a sum of two Gaussians to fit the PR histograms of doubly labeled promoter in its free dsDNA (free promoter) form, RPITC = 2 and run-off forms. Then, we used a sum of three Gaussians to fit the PR histograms of RPITC≤ 4, RPITC≤ 7 in the absence and presence of GreA, where the peak PR values of two sub-populations were constrained to the values of the two sub-populations in the fitting results of RPITC = 2. This allowed elucidating a third sub-population and its relative contribution.
Data analysis and figure preparation was performed using FRETBursts, an open source burst analysis program for smFRET data.Citation62 Python notebooks that describe the data analysis from raw data to the results presented in the figures are available in https://figshare.com/s/2b3399ace2a6a9b2bcec (DOI: 10.6084/m9.figshare.4590721). Raw data is saved in Photon-HDF5 formatCitation63 and is available in https://figshare.com/s/489f12461399cc2adca4 (DOI: 10.6084/m9.figshare.4588741) and in https://figshare.com/s/87ad049f556d18966a80 (DOI: 10.6084/m9.figshare.4589560).