 ?Mathematical formulae have been encoded as MathML and are displayed in this HTML version using MathJax in order to improve their display. Uncheck the box to turn MathJax off. This feature requires Javascript. Click on a formula to zoom.
ABSTRACT
Cloverleaf tRNA with a 75 nucleotide (nt) core is posited to have evolved from ligation of three 31 nt minihelices followed by symmetric internal deletions of 9 nt within ligated acceptor stems. Statistical tests strongly support the model. Although the tRNA anticodon loop and T loop are homologs, their U-turns have been treated as distinct motifs. An appropriate comparison, however, shows that intercalation of D loop G19 between T loop bases 4 and 5 causes elevation of T loop base 5 and flipping of T loop bases 6 and 7 out of the 7 nt loop. In the anticodon loop, by contrast, loop bases 3–7 stack tightly to form a stiff connection to mRNA. Furthermore, we identify ancient repeat sequences of 3 (GCG), 5 (UAGCC) and 17 nt (∼CCGGGUUCAAAACCCGG) that comprise 75 out of 75 nts of the tRNA cloverleaf core. To present a sufficiently stiff 3-nt anticodon, a 7-nt anticodon loop was necessary with a U-turn between loop positions 2 and 3. Cloverleaf tRNA, therefore, was a radical evolutionary innovation essential for the 3-nt code. Conservation of GCG and UAGCC repeat sequences indicates that cloverleaf tRNA is at the interface between a strange RNA repeat world and the first evolution of molecules that fold to assume biologic functions. We posit that cloverleaf tRNA was the molecular archetype around which translation systems evolved.
Introduction
Translation systems appear overly ornate, posing a problem for understanding their evolution by a simple stepwise process.Citation1 A proposed solution, however, is to consider translation to have evolved around proto-tRNAs (i.e., 17-nucleotide (nt) core + 3′-CCA microhelices giving way to 31-nt core + 3′-CCA minihelices) and cloverleaf tRNA (75-nt core + 3′-CCA).Citation1 Remarkably, cloverleaf tRNAs with many specificities are largely unaltered in 75 nt core length and highly conserved in sequence since LUCA (the last universal common (cellular) ancestor). According to this view, tRNA is the core function of the cellular translation system, and the two subunit ribosome, initiation, translocation and termination functions evolved after and around cloverleaf tRNA.Citation1
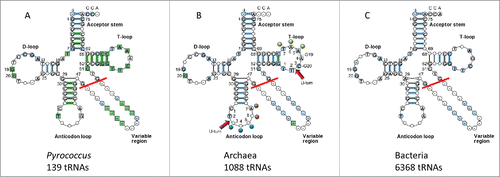
Cloverleaf tRNA has an overall “L” shape (), with one end of the L presenting the anticodon (Ac) to mRNA and the other end presenting the amino acid to be joined to a growing polypeptide chain. The bend of the L is the “elbow,” at which the D loop and the T loop interact to brace the joint.Citation2 In , three typical cloverleaf sequence diagrams are shown comparing Pyrococcus (an archaeal family; three species), archaeal and bacterial tRNAs.Citation3 Based on the extent of sequence pattern conservation, Pyrococcus tRNAs appear to show the least sequence divergence from LUCA. Next most conserved is archaeal tRNA. Bacterial tRNAs, by contrast, display more evolutionary innovation. In tRNA, a sharp “U-turn” forms at two homologous positions in the Ac and T loops almost invariably following a U or a modified U base.Citation3,Citation4 Remarkably, the Ac loop and the T loop resemble one another in structure () and sequence ().
Figure 1. The tRNA structure. The 7-nt paired As are green (5′-As: 1–7; 3′-As: 69–75). The 5-nt As* are cyan (D loop 25–29 and V loop 47–51). The homologous Ac and T loop 17-nt microhelices are red (Ac loop: 30–46; T loop: 52–68). The D loop 17-nt microhelix is magenta (8–24). 3′-CCA is white. Blue dots indicate the anticodon (37–39). Blue and orange dots indicate stacked bases (37–41) in the Ac loop. Yellow dots indicate elevated base 61 (loop nt 5) and flipped out bases 62 and 63 (loop nts 6 and 7) in the T loop. G19 and G20 (magenta) and C59 (red) that help form the elbow are indicated. Homologous Ac and T loops are numbered for loop positions (1–7). Numbering is based on a 75-nt cloverleaf tRNA core ().
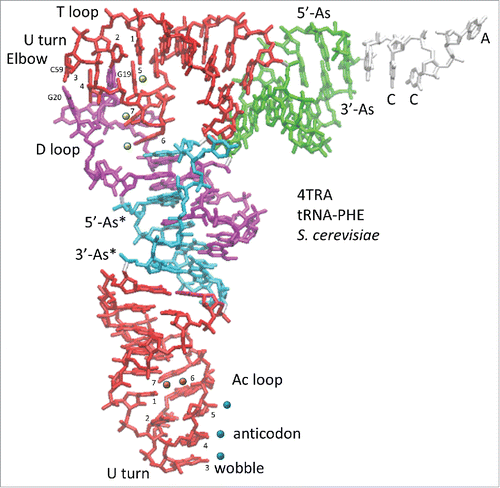
Figure 2. “Typical” cloverleaf diagrams. (A) Pyrococcus (archaeal) tRNAs (three species). (B) Archaeal tRNAs. (C) Bacterial tRNAs.Citation3 Only 5 nts of the V loop (47–51) are considered (red line) in the model because additional nts result from inserts. The model is numbered for a 75-nt core, neglecting the 3′-CCA, where the amino acid is covalently attached.Citation1 A previous 72-nt numbering system was based on tRNAs with 3 nt deletions in the D loop. In (B) U-turns are indicated. D loop G19 and G20 interactions with the T loop are shown. Blue dots indicate the anticodon (37–39). Orange dots indicate stacked bases in the Ac loop (40–41). Yellow dots indicate elevated base 61 and flipped out bases 62 and 63 in the T loop (loop positions 5–7) (colored dot labels as in ).
tRNA is a molecular fossil that appears to include relics of prior generations of translation adapters.Citation1 The anticodon (Ac) loop (30–46) and the T loop (52–68) represent 17-nt microhelices that in isolation might attach 3′-CCA to function as 20-nt translation adapters. Part of the D loop (8–24) is posited also to be refolded from a 17-nt microhelix. A 31-nt minihelix is a 17-nt microhelix improved by the addition of an acceptor stem (2 × 7 nt), enhancing the accuracy of amino acid attachment at 3′-CCA. Cloverleaf tRNA also includes an intact 31-nt minihelix (1–7 (5′-As (acceptor stem)) + 52–75 (T loop + 3′-As)) + 3′-CCA), with positions 8–51 (see above) inserted between. Compared to the 17-nt microhelix system, the 31-nt minihelix system could support coding in which a larger number of amino acids were specified and/or in which amino acids were specified more accurately. Type I and type II amino acyl tRNA synthetases recognize opposite faces of acceptor stems, allowing acceptor stems with similar sequences to encode two amino acids, and making the acceptor stem a major determinant of amino acid attachment to 3′-CCA. In principle, therefore, adding acceptor stems to 17-nt proto-tRNA microhelices might as much as double the number of amino acids specified by a genetic code.Citation5,Citation6
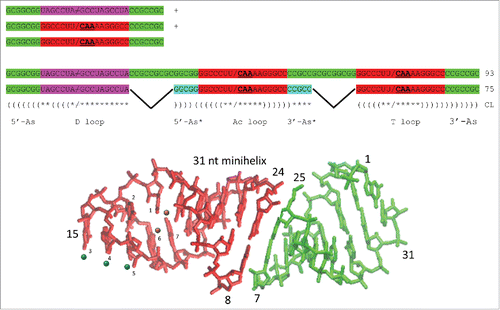
Cloverleaf tRNA is posited to be evolved by ligation of three 31-nt minihelices (93 nt totally), followed by symmetric internal processing of ligated acceptor stems to delete 2 × 9 nt, to form the 75-nt tRNA core (missing 3′-CCA) ().Citation1 The cloverleaf evolutionary model makes very strong predictions for sequence homologies and complementarities throughout the tRNA core, and proposed homologies and complementarities were confirmed here using a statistical permutation test.Citation7 Significantly, some sequence complementarities posited for proto-tRNA minihelices that are no longer used in cloverleaf tRNA folding are nonetheless still evident. The D loop and acceptor stems evolved from two distinct short contiguous repeat sequences that bridge an inanimate RNA (and protein) polymer world that includes many short repeating RNA sequences to a world with molecules that fold to assume biologic currency. Many alternate views on tRNA evolution have been suggested,Citation8–11 but these competing models present difficulties and do not make readily testable sequence predictions. For instance, a model for tRNA evolution from two minihelices appears to be based on a tRNA with a 3-nt deletion in the D loop (72-nt core vs. 75-nt core). As we have shown, the tRNA core should be considered to be 75 nts, and most bacterial and eukaryotic tRNAs are deleted within the D loop, often by 3 nts.Citation1 Furthermore, because of their proximity and positions in the cloverleaf, the homology of the anticodon loop and T loop is inconsistent with a two-minihelix model. Our model, by contrast, accounts for every nucleotide in the 75-nt cloverleaf core and also the homology of the anticodon loop and T loop. From our model, we make very strong sequence predictions, all of which are supported by statistical tests, logos, typical tRNA sequences () and loop structures. Using statistical methods, we cannot design a strategy to do homology tests to confirm or reject the alternate tRNA models in the way we report here for the model we propose ().
Figure 3. A model for cloverleaf tRNA evolution. Three 31-nt minihelices are ligated to form a 93-nt precursor. Two symmetric 9 nt deletions within ligated acceptor stems generate the 75-nt tRNA core. Colors as in . Parentheses indicate base pairing. Asterisks indicate unpaired bases. / indicates a U-turn. / indicates no U-turn.
Results
Structural analysis of tRNAs based on the evolutionary model
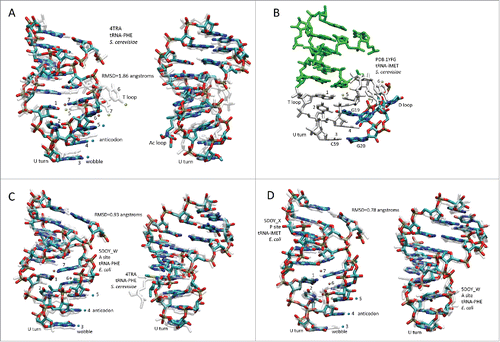
Because of Ac and T loop homology () and because Ac loops function in different contexts, 17-nt microhelix motifs in tRNAs were compared (). To understand the characteristics of Ac loops that make an adequate translation adaptor, Ac loops were considered bound to and free of the ribosome and also bound in different ribosome sites. shows an overlay of an Ac loop and a T loop. The loops are very similar except for different placements of loop residues 5, 6 and 7. Comparing microhelix motifs for the Ac and T loops, the RMSD (root mean square deviation) is 1.86 Å for backbone atoms.Citation1 Differences between the Ac loop and the T loop arise because of contacts of the T loop with the D loop (). Notably, D loop residue G19 intercalates between T loop nts 4 and 5, elevating loop nt 5 and flipping loop nts 6 and 7 out of the T loop ( and ). D loop G20 forms a Watson–Crick base pair to T loop C59.Citation2 In the Ac loop, nts 3–7 are stacked and tightly packed within the loop ().
Figure 4. Comparisons of 17-nt microhelix structures and their interactions. (A) Comparison of an Ac loop and a T loop. Overlay of Saccharomyces cerevisiae tRNAPHE Ac and T loops (PDB 4TRA). Loop positions are numbered. The Ac loop was colored for chemistry. The T loop is transparent white. Two views. (B) Interactions of the D loop with the T loop. The paired stem is green. The 7-nt T loop is white. The D loop is colored for chemistry. (C) Comparison of an Ac loop from a ribosome- and mRNA-bound tRNA (5DOY_W) (A site; colored for chemistry) and an Ac loop from an unbound tRNA (4TRA) (transparent white). Two views. (D) Overlay of an Ac loop from a P site (colored for chemistry) and an Ac loop from an A site (transparent white) tRNA. Two views. Blue dots indicate anticodon positions. Orange dots indicate stacked bases 6 and 7 of the Ac loop. Yellow dots indicate elevated base 5 and flipped out bases 6 and 7 in the T loop (A and B only). RMSD is for backbone atoms.
Because the cloverleaf elbow, where the T loop and the D loop join, appears to be a stiff structure,Citation2 we considered the hypothesis that the translation adaptor needed to be relatively rigid. Stiffness in the adaptor seemed reasonable to cluster an amino acid and a polypeptide chain at the 3′-CCA tRNA ends opposite the Ac loop ends that pair with the mRNA. We considered two hypotheses. One idea was that the 7-nt Ac loop with the sharp U-turn was a dynamic structure that changed conformation to present a 3-nt anticodon to mRNA but to hide the anticodon when the tRNA is in solution free of the ribosome. The opposing idea was that the 7-nt Ac loop with a sharp U-turn was a tight structure, and that the value of the Ac loop was its relatively rigid presentation of a 3-nt anticodon. According to this second view, the Ac loop might have restrained dynamics similar to the tRNA elbow, where the D loop braces the T loop ().
Not surprisingly, we find that the second idea is correct. Whether free in solution or bound to mRNA on a ribosome, the conformation of the Ac loop is very similar. This result indicates that the stiffness of the tight 7-nt U-turn Ac loop forms a relatively rigid translation adaptor () (RMSD = 0.93 Å).Citation12,Citation13 To extend the analysis, we compared two tRNAs bound to mRNA on the ribosome, one in the P site and one in the A site (D). We find that these tRNAs vary in the Ac loop by RMSD = 0.78 Å, indicating by comparison that the Ac loop may slightly tighten upon binding to mRNA on the ribosome during translation. Because of the extent of tRNA sequence and structure conservation, comparisons of tRNA motifs from bacteria and eukaryotes, as in , are reasonable and can be generalized to many tRNAs of many species.
Because acceptor stems pair in cloverleaf tRNA, the acceptor stem immediately 5′ to the D loop (5′-As; 1–7) and the acceptor stem immediately 3′ to the T loop (3′-As; 69–75) were assumed to be initially complementary to one another. The assumption was made even though acceptor stems were derived from 31-nt minihelices with different loop sequences.Citation1 Furthermore, it was assumed that the Ac loop (30–46) and T loop (52–68) microhelices and minihelices were initially identical or nearly so. In their 1976 paper, Quigley and Rich reported the close structural similarity of the Ac loop and the T loop, including the shared RNA U-turn just before the anticodon in the Ac loop sequence (between loop positions 2 and 3 of the 7-nt Ac and T hairpin loops) ( and ).Citation4 The strong structural similarity of the Ac loop and T loop indicates that these 17-nt microhelices may initially have presented identical stems, loops and possibly triplet anticodons. In archaeal tRNAs, 59-CAA-61 encoding leucine occupies the anticodon position in the T loop (), but C59 forms a base pair with G20 of the D loop, so the original Ac anticodon may not have been CAA.
Using sequence logo comparisons, the posited D loop 17-nt microhelix (8–24) appears to be distinct from the Ac loop and T loop 17-nt microhelices. Because the Ac and T loops are nearly identical in sequence, only two 31-nt minihelices, derived from what may have been a robust ancient protein coding system, survived the transition from the proto-tRNA minihelix world to the cloverleaf tRNA world. The tRNA cloverleaf is thought to have evolved in a single event, in part, because of the strong typical tRNA sequences for the D loop and T loop microhelices (). Building a cellular coding system with 20 amino acids, therefore, appears to require that all but one anticodon be acquired (i.e., by gene duplications and mutations) into tRNA copies after initial cloverleaf evolution. Essentially, cloverleaf tRNA appears to be a reinvention of templated coding, by displacement of prior minihelix-based translation systems.
The model in posits that the 75-nt tRNA core can be divided into two complementary 7-nt acceptor stems (5′-As (1–7) and 3′-As (69–75)), two complementary 5-nt acceptor stem remnants (5′-As* (5-nt acceptor stem remnant) D loop (25–29) and 3′-As* V loop (47–51)) and three 17-nt microhelices (D loop (8–24), Ac loop (30–46) and T loop (52–68)) (75 nts totally). A segment of the 5′-As (3–7) and the 5′-As* (25–29) segment of the D loop are expected to be homologous to one another and complementary to the 3′-As* (47–51) V loop and a segment of the 3′-As (69–73). Because the D loop (8–24) is posited to be a refolded 17-nt microhelix, 8–12 and 20–24 are expected to be derived from complementary 5-nt stems, even though these sequences no longer pair in the cloverleaf fold, and therefore have not paired in cloverleaf tRNA since LUCA.
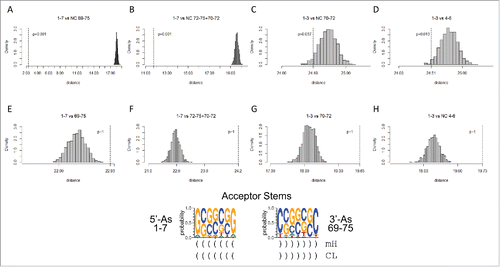
Surprisingly, after ∼3.5 to 3.8 billion years of evolution, the statistical permutation tests support every feature of the tRNA cloverleaf evolution model (–; ). Qualitatively, if the dotted line in – is to the left of the gray histogram and the p-value is <0.05, this indicates sequence similarity that may indicate homology. If the dotted line is to the right of the gray histogram and/or the p-value is >0.05, this indicates that sequences are dissimilar and may not represent homologous positions. Distance on the x-axis of the graph indicates apparent evolutionary distance of alignments (dotted line) vs. the scoring of 1000 random permutations of a sequence alignment with the same base composition (the gray histogram). Apparent homologies, p-values and model predictions for comparisons are summarized in . Green shading indicates tests that support key features of the tRNA evolution model, including two conserved sequence complementarities predicted to have paired only before cloverleaf folding (>3.5 billion years ago). In addition to archaeal tRNAs, shows p-values for statistical tests using 6368 bacterial tRNAs. Interestingly, although cloverleaf diagrams () using bacterial tRNAs indicate a degraded pattern of conservation, statistical results with this large set of tRNAs support every aspect of the evolution model. The permutation test, therefore, detects sequence similarities that are not necessarily apparent from visual inspection.
Figure 5. Homology of acceptor stems and acceptor stem remnants. The dotted line indicates the observed alignment evolutionary distance score. The gray histogram indicates 1000 randomly permuted sequences of the same base composition. In the sequence logo, blue arrows indicate homologous positions. Parentheses indicate base pairing. Asterisks indicate loops. mH indicates minihelices or microhelices. CL indicates cloverleaf fold.
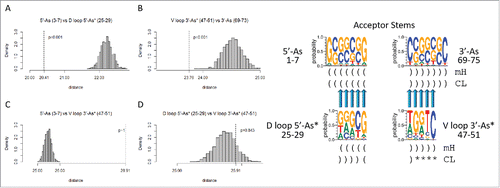
Table 1. Analyses of p-values for homology and complementarity tests indicate that the model for tRNA cloverleaf evolution is correct. The tests that most strongly support the model were highlighted in green. NC indicates that the test is against the complement (the non-coding DNA strand) of the sequence. For convenience, sequences are annotated (As: Acceptor stem; As*: Acceptor stem remnant; D: D loop; Ac: Anticodon loop; T: T loop). Note that, because sequences are not palindromic, a test of a sequence against its complement or against the complement of its homolog gives a high p-value (p >0.05).
shows the expected homologies of the acceptor stems and posited acceptor stem remnants. shows that the 5′-As (3–7) and the 5′-As* of the D loop (25–29) test as similar with high confidence (p = 0.001), as predicted by the model. Similarly, V loop 3′-As* (47–51) and the 3′-As (69–73) test as similar (p = 0.001), as predicted (). Sequences predicted to be complementary and therefore not homologous test as dissimilar (p ∼1 and p = 0.843), as predicted by the model ( and D).
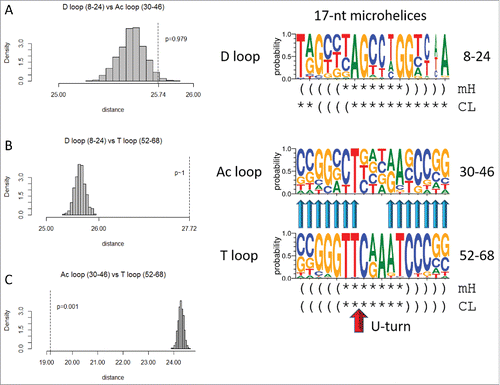
Next we compared the three 17-nt microhelix sequences (). Because of the 17 nt lengths, a dinucleotide statistical permutation test could also be applied (see Methods section). From inspection of sequence logos, the D loop microhelix is expected to be non-homologous to the Ac loop (p = 0.979). Using the dinucleotide test, the score is p = 0.246, which is in agreement with the mononucleotide permutation test (a p-value >0.05 indicates non-homology). The D loop also appears to be non-homologous to the T loop microhelix, as confirmed by the permutation test (p ∼1). Using the dinucleotide test, the score is also p ∼1. The Ac loop and the T loop microhelices, by contrast, are expected to be homologous p = 0.001, using either test). We suggest that 17-nt microhelices with two distinct sequences were included (i.e., ligated as RNAs) in tRNA cloverleaf evolution. The D loop is distinct, but the Ac loop and T loop minihelices were initially identical in sequence or nearly so. The model for tRNA cloverleaf evolution posits that these 17-nt microhelices were ligated together as 31-nt minihelices, each with 2 × 7 nt complementary acceptor stems (as in cloverleaf tRNA) ().Citation1
Figure 6. The T loop and the Ac loop 17-nt microhelices are homologs, but the D loop microhelix is distinct in sequence. Symbols for sequence logos are the same as in . The U-turn is indicated by a red arrow.
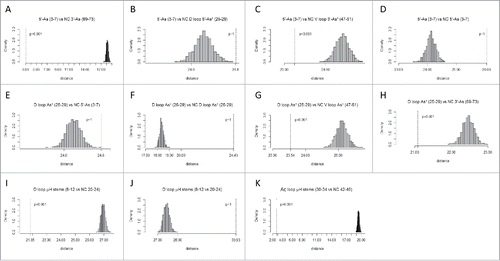
Because tRNA includes many paired sequences and because the D loop and V loop appear to be derived from sequences that once paired in a pattern that is distinct from the pattern of base pairing in cloverleaf tRNA, complementarity of segments was determined within the tRNA sequence (). To present reasonable comparisons, a combination of predicted and non-predicted complementary pairs was tested. In the comparisons shown, G was paired only with C. In parallel tests, G was allowed to pair with either C or T (allowing for G–U pairing in RNA), but the results were in agreement, so these redundant data are not shown. Homology with a complementary sequence indicates base pairing or potential base pairing. Homology to a complement is indicated in , C, G–I and K (p = 0.001). tests for the known pairing of the 5′-As and 3′-As sequences in cloverleaf tRNA (see ). tests for the predicted complementarity of the 5′-As (3–7) with the V loop (47–51) (p = 0.001), in strong support of the model that the V loop was derived from a 3′-As. G tests for the posited complementarity of the D loop 5′-As* (25–29) and the V loop 3′-As* (47–51) (p = 0.001). Potential D loop pairing to the V loop was predicted from the evolutionary model but is not consistent with the cloverleaf tRNA fold, so this observed residual sequence complementarity, without the support of any likely ongoing positive selection, strongly supports the proposed model for tRNA evolution. We conclude from potential D loop to V loop complementarity that the D loop (25–29) and the V loop (47–51) were once paired sequences, as acceptor stems flanking the Ac loop, as predicted from the cloverleaf tRNA evolution model (). also shows complementarity comparing the D loop 5′-As* (25–29) and the 3′-As (69–73) (p = 0.001), as predicted from the model. I shows complementarity of the posited D loop microhelix stems (8–12 vs. NC 20–24) (NC for non-coding DNA strand) consistent with the D loop (8–24) being refolded from a 17-nt microhelix. Stem pairing of the D loop microhelix (8–24) (8–12 vs. NC 20–24) is not maintained in the tRNA cloverleaf (), but conservation of potential stem pairing supports the prediction that this segment of the D loop was once similar to a 17-nt microhelix. As a negative control, J tests the posited D loop complementary stems without taking the complement (8–12 vs. 20–24). As expected, the posited complementary D loop microhelix stems test as non-homologous (p ∼ 1). H is a trivial positive test demonstrating the known complementarity of the Ac loop microhelix 5-nt stems (30–34 vs. NC 42–46) (p = 0.001). Other tests are negative controls for the analysis, all of which test negative for complementarity, as expected. In aggregate, these analyses strongly favor the tRNA cloverleaf evolution model (), and no inconsistencies with the model (i.e., false positive tests or false negative tests) are noted in –. Although not necessarily indicated by inspection of typical cloverleaf patterns (), all tests with bacterial tRNAs were in agreement with the model (). We conclude that the model for evolution of the cloverleaf tRNA is very likely to be correct and is strongly supported by the accurate archaeal and bacterial tRNA sequence alignments obtained from the tRNA database.Citation3
Figure 7. Complementary sequences in the tRNA cloverleaf support the model for tRNA evolution. J is a negative control test for I. Because these sequences are complementary but not homologous, the posited D loop minihelix stems test as homologs vs. their stem complement (I) but as non-homologs (stem vs. stem) in a direct sequence comparison (J).
Conserved sequence repeats
Inspection of cloverleaf diagrams in and indicates that the D loop microhelix may be generated from a TAGCC repeat (UAGCC in RNA). To test for this repeat, the homology comparisons shown in were done. –C indicates that the posited (TAGCC)1–3 repeats are highly similar in sequence and possibly homologous (p = 0.001), as predicted from the (TAGCC)4 repeat model. Because, in the 17-mer, truncated (TAGCC)4 is only represented by TA, dinucleotide comparisons of the (TA)1–4 repeats were also done. Because of their short lengths, dinucleotide sequence similarity comparisons are somewhat uncertain tests. Despite this caveat, all dinucleotide TA tests indicate possible homology (p = 0.001) except one (H), in which (TA)2 (13–14) is tested against (TA)3 (18–19) (p = 0.96). The third repeat contains two notable degeneracies and has the dominant sequence TGGTC affecting homology tests using the (TA)3 dinucleotide. We consider this single break from the TAGCC repeat pattern as a false negative sequence homology test due to genetic selection of G in the 2nd position of the degenerate (TAGCC)3 repeat. G is selected at position 2 of the (TAGCC)3 repeat because G19 (repeat position 2) is the intercalated base that disrupts base stacking in the T loop and helps to join the D loop and T loop ( and ). Furthermore, invariant A14 in the 2nd position of the (TAGCC)2 repeat causes position 2 of the repeat to score as non-similar vs. (TAGCC)3 (invariant A vs. invariant G in repeat position 2 comparing the 2-nt repeats). A14 is invariant because it interacts with invariant U8 by a trans-Watson–Crick/Hoogsteen base pair in tRNA.Citation2 In , this single deviation from the truncated (TAGCC)4 repeat model for evolution of the D loop (8–24) is highlighted in yellow. One possible flaw with modeling the D loop as a 17-nt microhelix is that the hypothesized loop sequence is awkward for forming a RNA U-turn (UA⌿GCCUA; “⌿” indicates that the predicted position of the U-turn in the 7-nt loop does not appear likely). Almost invariably, tRNA U-turns follow a U or a modified U and never, so far as we know, an A.Citation3
Figure 8. Breaking the 17-nt D loop microhelix into TAGCC4 repeats. In the sequence logo, different modes of folding the D loop microhelix are indicated (TAGCCTAGCCTAGCCTA repeat folding; folding in a 17-nt microhelix or a 31-nt minihelix (mH); folding in the cloverleaf tRNA (CL)). Parentheses indicate base pairing. Asterisks indicate unpaired bases. Tests A–I are predicted to test as similar for a perfect repeat. Degeneracy in the third repeat (invariant A14 vs. invariant G19) causes the test in H to test as negative for similarity.
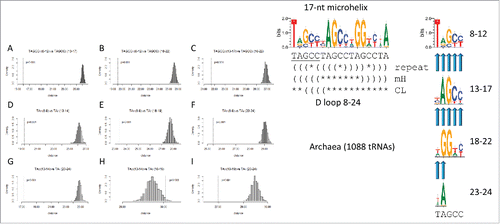
Table 2. Homology tests for the (UAGCC)4 D loop repeat. Yellow shading indicates a single break from the (UAGCC)4 repeat pattern due to invariant A14 vs. invariant G19.
Because the 17-nt D loop microhelix appears to have evolved from a truncated (TAGCC)4 repeat, acceptor stems were inspected to see whether they might also have evolved from a contiguous repeat. From cloverleaf diagrams ( and ), we posit that the 5′-As evolved from a truncated (GCG)3 repeat (1-GCGGCGG-7), and the 3′-As appears to be evolved from a complementary truncated (CGC)3 repeat (69-CCGCCGC-75) (). Of course, as is equally true of the D loop (TAGCC)4 repeat, evolution of a sequence allows the complementary sequence to be generated by replication, so it is now not relevant to know which strand may have evolved first. The permutation test for evolutionary distance was applied to examine the divergence of the repeat sequence. Our expectations were that the statistical test would give mixed results for the (GCG)3 repeat model because acceptor stems swap C = G pairs to provide determinants for accurate amino acid placement at 3′-CCA. Particularly, near the center of the acceptor stems (5′-As (3–6); 3′-As (70–73)), sequences appear to be either C or G with little preference. Nonetheless, in , sequence homology and complementarity tests are shown in support of the (GCG)3 repeat model. is a trivial demonstration of the known complementarity of the 5′ and 3′ acceptor stems. shows that a 3′ acceptor stem can be permuted according to the (GCG)3 repeat pattern and still show complementarity to the 5′ acceptor stem. shows complementarity of residues 1–3 with 70–72, as predicted from the (GCG)3 repeat model. D shows similarity of sequences 1–3 and 4–6, consistent with the (GCG)3 repeat. E–H shows the negative controls for the complementarity and similarity tests shown in –D that are directly above. We conclude that it is very likely that acceptor stems were generated from a truncated (GCG)3 repeat. Using bacterial tRNA sequences, statistical tests for the (GCG)3 repeat do not appear informative because of greater bacterial innovation of acceptor stem sequences compared with archaea (). Apparent false positive and false negative tests with bacterial tRNAs, therefore, give the results we expected with archaeal tRNA sequences from inspection of logos. Slightly unexpectedly, the statistical test is able to provide reasonable confirmation of the GCG repeat for archaeal sequences.
A non-contiguous repeat
A total of 41 out of 75 nts of the tRNA cloverleaf core were apparently derived from short contiguous repeating sequences (TAGCC)4 (D loop microhelix; 8–24) and (GCG)3 (5′-As (1–7), 5′-As* (25–29), 3′-As* (47–51) and 3′-As (69–75)). Therefore, the remaining 34 nts, the Ac loop (30–46) and T loop (52–68) microhelices, were considered. The inferred ancestral sequence of both the Ac loop and T loop microhelix is 30/52-CCGGGTTCAAAACCCGG-46/68 in the initial cloverleaf tRNA ( and ). No model based on contiguous sequence repeats can account for generation of this patchwork sequence, so it must have evolved from ligated and replicated RNAs combining different sequences. Generation of the first 13 nts of this sequence or of its complement would allow snap back priming of the rest of the segment, so this is a possible mechanism. Generation of CCGGG would generate CCCGG by replication, and the 7-nt loop could be attached via ligation. Probably the 17-nt microhelix was generated by ligation of various unrelated (or complementary) RNAs, replication and RNA processing (i.e., RNA cleavage at the base of paired stems). Because a sequence resembling CCGGGTTCAAAACCCGG is present in both the Ac and T loops, however, 75 out of 75 nts of the tRNA cloverleaf core are generated from short repeats of 3, 5 and 17 nts.
Discussion
tRNA evolution
A model for evolution of the 75-nt tRNA cloverleaf core is proposed ().Citation1 Here, we apply a statistical permutation test that scores sequence similarities and complementarities,Citation7 and the analysis is fully consistent with the model (–; ). The most obvious evidence for the model is obtained from archaeal tRNAs ( and , and and ). Although not as strongly indicated from inspection of sequence (), statistical tests with bacterial tRNAs also support the model (), indicating the power of the statistical method, particularly for comparing short nucleotide sequences in large alignments.
Based on typical tRNA sequences () and confirmed by statistical tests ( and and ), we posit two conserved short contiguous sequence repeats in cloverleaf tRNA accounting for 41 out of 75 nts of the conserved tRNA core. We posit that the D loop (8–24) was generated from a truncated (TAGCC)4 repeat, and that the acceptor stems and acceptor stem remnants were generated from a truncated (GCG)3 repeat. Remarkably, the tRNA cloverleaf is essentially unchanged in core length and almost unchanged in sequence since LUCA (> 3.5 billion years ago), so that these repeat sequences can still be detected, particularly in archaeal tRNAs.
Generation of complexity from repeats
In the RNA–protein world, we posit that contiguous repeating RNA sequences were generated through ligation of identical or nearly identical short RNAs and also by replication slippage. In a pre-cellular world of RNA genomes, it is easy to imagine genes or short RNA fragments with significant independence from one another. Upon evolution of the rapidly replicating prokaryotic DNA genomes that arose at LUCA, genes become more co-dependent. Genes in the RNA–protein world, however, may have existed as gene colonies often of identical or nearly identical sequences. Such a genetic system results in repeats through RNA ligations and replication slippage, and ligations were necessary to replicate short RNAs. Another exigency for replication in the ancient RNA–protein world, the ligation of a snap back RNA primer allows complementary strand RNA synthesis.Citation14 Significantly, microhelices and minihelices can function as snap back primers for RNA replication, partly explaining their biologic value.Citation1
Evolution of tRNA was first considered by our group, because of an interest in the evolution of core protein motifs, RNA polymerases and general transcription factors. From these other studies, we were cognizant that in ancient evolution repeating sequences and motifs often generated the most lasting biologic complexity. Sometimes pseudo symmetry results from repeats, as in the case of protein barrels or pseudo-dimeric folds, as in (β−α)8 barrels,Citation15 cradle loop barrels (i.e., RIFT barrels and double-Ψ−β-barrels; ββαβ repeats) (including RNA polymerases of the two double-Ψ−β-barrel type)Citation15,Citation16 and TATA-binding protein (a pseudo-dimer of two TBP folds). The Rossmann fold is a twisted linear (β−α)8 sheet possibly rearranged from a (β−α)8 barrel.Citation15 Archaeal TFB (transcription factor B; related to eukaryotic TFIIB) includes two helix-turn-helix repeats. Bacterial sigma transcription factors are homologs of archaeal TFB and evolved from a ≥four helix-turn-helix repeat.Citation16,Citation17 Archaeal and bacterial promoters are posited to be evolved from a ≥(TFB-recognition element-TATA box)4 repeat, initially recognized by a ≥(helix-turn-helix)4 repeat primordial initiation factor (a precursor of archaeal TFB and bacterial sigma) and also TBP.Citation16 The carboxy terminal domain of eukaryotic RNA polymerase II is a (YSPTSPS)n repeat.Citation15 Also, rRNAs appear to be formed by ligation and degeneration of tRNAs.Citation5,Citation18-22 Thus, even the most complex cellular machinery seems to have a simple modular basis.
Familiarity with iteration in evolution inspired searches for repeating motifs and sequences in tRNA resulting in a model that accounts for all 75 nts in the cloverleaf core (). Only two distinct 17-nt microhelices appear to have survived the transition of the 31-nt minihelix proto-tRNA world to the 75-nt cloverleaf tRNA world, with likely sequences close to TAGCCTAGCCTAGCCTA (D loop, 8–24, based on a truncated contiguous TAGCC repeat) and ∼CCGGGTTCAAAACCCGG (Ac loop (30–46) and T loop (52–68)). Other 31-nt proto-tRNA minihelices and adapters are posited to have become extinct through failed competition, and we posit that amino acid specificities they may have represented were acquired anew by cloverleaf tRNA (i.e., via tRNA gene duplications and mutations). We posit, therefore, that the genetic code, which eventually expanded to encode 20 amino acids, was reinvented after evolution of cloverleaf tRNA, and competing systems were suppressed. Also, cloverleaf tRNA is posited to have preceded and driven the evolution of the two subunit ribosome.Citation1
Biological complexity evolved from repeating sequences and motifs, but why should this be so? Pseudo-symmetry in protein barrels and pseudo-dimers can confer closure and solubility. Similarly, the tRNA cloverleaf fold was evolved by iteration, processing and folding. Complementary acceptor stems at the 5′ and 3′ ends of tRNA also confer closure and resistance to exonucleases. In the RNA–protein world, the relative isolation of some RNA fragments and genes provides a mechanism for generating repeats. Interacting gene colonies, by contrast, can generate mixed polymers by ligation, snap back priming, replication and RNA processing. The tRNA cloverleaf sequence includes evidence of truncated contiguous repeats (GCG)3 and (TAGCC)4 and the non-contiguous repeat (∼CCGGGTTCAAAACCCGG)2. The 17-nt microhelix sequence that generated the Ac and T loops was apparently generated from ligation, replication and processing of mostly unrelated and/or complementary short RNA fragments. RNAs often display “rugged” evolution in which many or most mutational changes have a large effect on function and fold.Citation23 This could partly explain why the tRNA cloverleaf core and its initial repeating sequences are so strongly conserved. We suggest that a strange polymer world that included RNA and protein fragments with a tendency to generate repeating RNA sequences preceded the RNA-protein world. The amazing aspect is that these repeating sequences remain recognizable in the tRNA cloverleaf, and that tRNA, therefore, bears witness to this ancient transition between iterated sequences, fold and function. To see back almost 4 billion years in evolution to the initial acquisitions of biologic complexity is remarkable and unexpected.
U-turns and T-loops
U-turns and T-loops (a specialized U-turn) have been considered distinct RNA motifs.Citation2,Citation4,Citation24,Citation25 One consequence was that the structural similarity of the U-turns and the homologies of the Ac loops and T loops was obscured. We argue that differences in Ac loops and T loops result from contacts between the T loop and the D loop that stiffen the tRNA elbow ( and ). and D shows that tRNA has essentially the same tight Ac loop structure whether it is free in solution or bound to mRNA on a ribosome. Apparently, an adaptor with a relatively stiff Ac loop and elbow evolved to present an anticodon to mRNA at one end and to align a covalently attached amino acid or a peptide chain, within the ribosome peptidyl transferase center, at the other.
17-nt microhelices, U-turns and standardization of the code
We have posited that the D loop (8–24) was a 17-nt microhelix,Citation1 but there are some potential objections to this model. We would argue that the D loop was part of a 31-nt minihelix, because it is linked to the 5′ acceptor stem (1–7). The D loop segment from 8 to 24 is also 17-nt long, so it is the correct length for a microhelix. Shortened D loops found in many tRNAs were generated by deletions. Furthermore, D loop 8–12 appears complementary to D loop 20–24 (I), as predicted from the microhelix model. However, without an acceptor stem, the D loop repeat TAGCCTA/GCCTAGCCTA does not form a stable stem-loop structure without at least one base change to improve pairing in the stem (position 4 or 14). Also, the D loop sequence does not easily form a 7-mer loop to present a 3-nt anticodon as found in cloverleaf tRNAs. Because U-turns in tRNA Ac loops and T loops almost invariably follow a U and never an A (), the D loop microhelix does not appear to present a 3-nt anticodon. T loop-like U-turns in other RNAs (i.e., RNase P, tmRNA, 16S, 18S, 23S rRNA, Group II introns, riboswitches) have U or more often G just before the U-turn and never A (of 105 structurally identified and verified U-turns termed “T-loops”).Citation24,Citation25 Similarities of the D loop to a 17-nt microhelix and a 31-nt minihelix could, therefore, be deceptive. Also, the D loop microhelix and minihelix could have had functions distinct from proto-tRNA functions (i.e., as a snap back primer for replication). It is also possible that the genetic code may not always have been a strict triplet code, and other types of translation adapters (i.e., presenting 1 or 2 nt anticodons) may have been used. If the D loop was a proto-tRNA minihelix translation adaptor, it was a distinct type and fold compared with the Ac and T loops, and it almost certainly did not present a 3-nt anticodon.
By contrast, the ∼CCGGGTT/CAAAACCCGG sequence posited to give rise to the Ac and T loops is a typical cloverleaf tRNA stem-loop with a typical 7-nt U-turn signature sequence. Because the D loop and the similar Ac and T loops appear to be the only two potential proto-tRNA stem loops to have survived the transition from the proto-tRNA world to the cloverleaf tRNA world, there is still much to learn and much information has been lost relating to the most ancient templated translation mechanisms. Remarkably, because the apparent D loop microhelix cannot easily present a triplet anticodon, full standardization to a 3-nt code appears to correspond to the advent of 75-nt cloverleaf tRNA. The data presented in this paper make it very unlikely that a 3-nt code specifying more than just a few amino acids could be established based on 31-nt minihelices. We posit that the cloverleaf fold, therefore, was the founding innovation in evolution of cellular translation systems with a 3-nt code. Before most of the molecular biology was known, Francis Crick hypothesized a ∼25-nt RNA translation adaptor.Citation26 It now appears that evolution of the 3-nt code, expansion of the code to 20 amino acids and evolution of the two subunit ribosome and cellular translation systems required prior evolution of cloverleaf tRNA with a 75-nt core.
Methods
tRNA sequences and sequence logos
Archaeal and bacterial tRNA sequences were collected from the tRNA database (http://trnadb.bioinf.uni-leipzig.de/).Citation3 A “typical” tRNA sequence (similar to a consensus sequence) is defined in the tRNA database website. Sequence logos were generated using Weblogo 3.5 (http://weblogo.threeplusone.com/create.cgi).Citation27
Molecular graphics
Molecular images were prepared using Visual Molecular Dynamics (http://www.ks.uiuc.edu/Research/vmd/).Citation28 Overlays of structures were done by extracting separate PDB files using PyMOL (http://www.pymol.com/) and doing alignments using Visual Molecular Dynamics.
Permutation statistical method
The similarity of two sequences can be tested using a permutation technique.Citation7 The algorithm was adapted here to compare two large alignments of very short sequences. Our adjustments to the method, therefore, perform the test on shorter sequences by taking many tRNAs into account simultaneously. Because of large data sets (1088 archaeal tRNAs; 6368 bacterial tRNAs), the algorithm generates a reliable statistical comparison. The magnitude of the evolutionary distance metric described below is affected by sequence, the number of sequences and the extent of evolutionary divergence in a compared set. Comparisons of tests, therefore, are done using p-values ( and ). The permutation test is reported to give very similar results to Markov model analyses of similar sequences, which must however be of sufficient length.Citation7,Citation29
We let Ai and Bi be two sequences of equal size of m from an ith tRNA, where i = 1, …, n, and n is the number of total tRNAs. We denote the alignment score Di as the number of cases that two alignments Ai and Bi have different nucleotides. For instance, if we pick one tRNA that has two sequences of GGCCG (3–7) and GGACG (25–29), the alignment score will be one because only the third nucleotide of the 2 sequences is not matched. If an aligned pair includes an undefined nucleotide, it is treated as a mismatch, and our alignment score is exactly the same as the Levenshtein distance. With the alignment score calculated from all tRNAs, we define the evolutionary distance using the Euclidean distance from the origin, which is
. If the two sequences are identical to each other, the evolutionary distance will be zero because all Di's are zero. Hence, the smaller the evolutionary distance, the stronger the evidence of similarity between two sequences.
The evolutionary distance between two randomly permuted sequences is expected to have a bigger distance than that of two sequences considered homologous. The distribution of a permuted evolutionary distance is approximated as repeating the procedure of getting the evolutionary distance using randomly permuted sequences many times. Next, the similarity of two sequences can be tested using the probability of obtaining the smaller distance than the real evolutionary distance from the approximate distribution. If two sequences are sufficiently similar to be potentially homologous, only a few or none of the calculated permuted evolutionary distances will be less than the real evolutionary distance. Under the null hypothesis that the similarity of two real sequences are not different from that of randomly permuted sequences, the p-value can be defined by , where M is the number of permuted distances that are smaller than the real evolutionary distance out of N permutations. At a 5% significance level, we will reject the null hypothesis when the p-value is less than 0.05. The algorithm for checking the similarity of two sequences is shown below.
Evolutionary distance permutation algorithm
The significance of the similarity between two sequences having m nucleotides can be measured by following steps (1)–(5).
| (1) | For each tRNA i, calculate the alignment score using two sequences, Ai and Bi, and then denote the alignment score as Di. | ||||
| (2) | Compute the real evolutionary distance using | ||||
| (3) | Permute Ai and Bi separately, and calculate the permuted evolutionary distance using them. Repeat this step until N permuted evolutionary distances are obtained. | ||||
| (4) | Count the permuted evolutionary distances that are less than the real evolutionary distance from step (2) and denote it as M, and then compute the p-value using | ||||
| (5) | Determine the similarity of the two sequences within a 5% significance level. If the p-value is smaller than 0.05, conclude that sequence similarity exists. | ||||
We used N = 1000 for our implementation. With N = 1000, the p-value cannot be below 1/1001, which is 0.001 when rounded up to the third digit after the decimal point. In step (3) of the algorithm, the permutation of each sequence can be performed using mononucleotide usage, dinucleotide usage or codon usage as described in Altschul and Erickson.Citation7 Note that dinucleotide usage or codon usage may decrease the number of possible permutations up to the situation in which there are no or few possible permutations, when very short sequences are considered. For instance, GGCCG (3–7) has only one possible permutation (i.e., GCCGG) with dinucleotide usage and no possible permutation with codon usage. With the large available sequence database, the modified permutation test can be applied to many similar evolutionary problems.
Abbreviations
| Ac | = | anticodon |
| As | = | acceptor stems |
| As* | = | acceptor stem remnants |
| LUCA | = | last universal common cellular ancestor |
| nt | = | nucleotide |
Disclosure of potential conflicts of interest
No potential conflicts of interest were disclosed.
References
- Root-Bernstein R, Kim Y, Sanjay A, Burton ZF. tRNA evolution from the proto-tRNA minihelix world. Transcription 2016; 7:153-63; PMID:27636862; https://doi.org/10.1080/21541264.2016.1235527
- Zhang J, Ferre-D'Amare AR. The tRNA elbow in structure, recognition and evolution. Life (Basel) 2016; 6; PMID:26771646
- Juhling F, Morl M, Hartmann RK, Sprinzl M, Stadler PF, Putz J. tRNAdb 2009: compilation of tRNA sequences and tRNA genes. Nucleic Acids Res 2009; 37:D159-D162; PMID:18957446; https://doi.org/10.1093/nar/gkn772
- Quigley GJ, Rich A. Structural domains of transfer RNA molecules. Science 1976; 194:796-806; PMID:790568; https://doi.org/10.1126/science.790568
- Caetano-Anolles D, Caetano-Anolles G. Piecemeal buildup of the genetic code, ribosomes, and genomes from primordial tRNA building blocks. Life (Basel) 2016; 6.
- Rodin AS, Szathmary E, Rodin SN. On origin of genetic code and tRNA before translation. Biol Direct 2011; 6:14; PMID:21342520; https://doi.org/10.1186/1745-6150-6-14
- Altschul SF, Erickson BW. Significance of nucleotide sequence alignments: a method for random sequence permutation that preserves dinucleotide and codon usage. Mol Biol Evol 1985; 2:526-538; PMID:3870875.
- Di Giulio M. The origin of the tRNA molecule: Independent data favor a specific model of its evolution. Biochimie 2012; 94:1464-1466; PMID:22305822; https://doi.org/10.1016/j.biochi.2012.01.014
- Di Giulio M. A comparison among the models proposed to explain the origin of the tRNA molecule: a synthesis. J Mol Evol 2009; 69:1-9; PMID:19488799; https://doi.org/10.1007/s00239-009-9248-z
- Tamura K. Origins and Early Evolution of the tRNA Molecule. Life (Basel) 2015; 5:1687-1699; PMID:26633518.
- Giege R, Juhling F, Putz J, Stadler P, Sauter C, Florentz C. Structure of transfer RNAs: similarity and variability. Wiley Interdiscip Rev RNA 2012; 3:37-61; PMID:21957054; https://doi.org/10.1002/wrna.103
- Westhof E, Dumas P, Moras D. Restrained refinement of two crystalline forms of yeast aspartic acid and phenylalanine transfer RNA crystals. Acta Crystallogr A 1988; 44 (Pt 2):112-123; PMID:3272146; https://doi.org/10.1107/S010876738700446X
- Polikanov YS, Starosta AL, Juette MF, Altman RB, Terry DS, Lu W, Burnett BJ, Dinos G, Reynolds KA, Blanchard SC et al. Distinct tRNA accommodation intermediates observed on the ribosome with the antibiotics hygromycin A and A201A. Mol Cell 2015; 58:832-844; PMID:26028538; https://doi.org/10.1016/j.molcel.2015.04.014
- Weiner AM, Maizels N. tRNA-like structures tag the 3′ ends of genomic RNA molecules for replication: implications for the origin of protein synthesis. Proc Natl Acad Sci USA 1987; 84:7383-7387; PMID:3478699; https://doi.org/10.1073/pnas.84.21.7383
- Burton ZF. The old and new testaments of gene regulation. Evolution of multi-subunit RNA polymerases and co-evolution of eukaryote complexity with the RNAP II CTD. Transcription 2014; 5:e28674; PMID:25764332; https://doi.org/10.4161/trns.28674
- Burton ZF, Opron K, Wei G, Geiger JH. A model for genesis of transcription systems. Transcription 2016; 7:1-13; PMID:26735411; https://doi.org/10.1080/21541264.2015.1128518
- Burton SP, Burton ZF. The sigma enigma: bacterial sigma factors, archaeal TFB and eukaryotic TFIIB are homologs. Transcription 2014; 5:e967599; PMID:25483602; https://doi.org/10.4161/21541264.2014.967599
- Ohnishi K. Origin of 16S and 23S rRNAs and the E. coli str operon, as derived from tandem tRNA repeats. Nucleic Acids Symp Ser 1993:163-164; PMID:7504242
- Ohnishi K. Evolution from semi-tRNA to tRNAs, rRNAs and an early peptide-synthesizing RNA molecule. Nucleic Acids Symp Ser 1992:145-6; PMID:1283904
- Tamura K. Ribosome evolution: emergence of peptide synthesis machinery. J Biosci 2011; 36:921-928; PMID:22116290; https://doi.org/10.1007/s12038-011-9158-2
- Root-Bernstein M, Root-Bernstein R. The ribosome as a missing link in the evolution of life. J Theor Biol 2015; 367:130-158; PMID:25500179; https://doi.org/10.1016/j.jtbi.2014.11.025
- de Farias ST, Rego TG, Jose MV. tRNA core hypothesis for the transition from the RNA world to the ribonucleoprotein world. Life (Basel) 2016; 6; PMID:27023615
- Lau MW, Ferre-D'Amare AR. Many activities, one structure: functional plasticity of ribozyme folds. Molecules 2016; 21; https://doi.org/10.3390/molecules21111570
- Chan CW, Chetnani B, Mondragon A. Structure and function of the T-loop structural motif in noncoding RNAs. Wiley Interdiscip Rev RNA 2013; 4:507-522; PMID:23754657; https://doi.org/10.1002/wrna.1175
- Krasilnikov AS, Mondragon A. On the occurrence of the T-loop RNA folding motif in large RNA molecules. RNA 2003; 9:640-643; PMID:12756321; https://doi.org/10.1261/rna.2202703
- Tamura K. The genetic code: Francis Crick's legacy and beyond. Life (Basel) 2016; 6; PMID:27571106
- Schneider TD, Stephens RM. Sequence logos: a new way to display consensus sequences. Nucleic Acids Res 1990; 18:6097-6100; PMID:2172928; https://doi.org/10.1093/nar/18.20.6097
- Humphrey W, Dalke A, Schulten K. VMD: visual molecular dynamics. J Mol Graph 1996; 14:33-38; PMID:8744570; https://doi.org/10.1016/0263-7855(96)00018-5
- Fitch WM. Random sequences. J Mol Biol 1983; 163:171-176; PMID:6842586; https://doi.org/10.1016/0022-2836(83)90002-5

