
ABSTRACT
The ribosomal RNA genes (rDNA) of Drosophila melanogaster reside within centromere-proximal nucleolar organizers on both the X and Y chromosomes. Each locus contains between 200–300 tandem repeat rDNA units that encode 18S, 5.8S, 2S, and 28S ribosomal RNAs (rRNAs) necessary for ribosome biogenesis. In arthropods like Drosophila, about 60% of the rDNA genes have R1 and/or R2 retrotransposons inserted at specific sites within their 28S regions; these units likely fail to produce functional 28S rRNA. We showed earlier that R2 expression increases upon nucleolar stress caused by the loss of the ribosome assembly factor, Nucleolar Phosphoprotein of 140 kDa (Nopp140). Here we show that R1 expression is selectively induced by heat shock. Actinomycin D, but not α-amanitin, blocked R1 expression in S2 cells upon heat shock, indicating that R1 elements are transcribed by Pol I. A series of RT-PCRs established read-through transcription by Pol I from the 28S gene region into R1. Sequencing the RT-PCR products confirmed the 28S-R1 RNA junction and the expression of R1 elements within nucleolar rDNA rather than R1 elements known to reside in centromeric heterochromatin. Using a genome-wide precision run-on sequencing (PRO-seq) data set available at NCBI-GEO, we show that Pol I activity on R1 elements is negligible under normal non-heat shock conditions but increases upon heat shock. We propose that prior to heat shock Pol I pauses within the 5ʹ end of R1 where we find a consensus “pause button”, and that heat shock releases Pol I for read-through transcription farther into R1.
Introduction
The ribosomal RNA genes (rDNA) in Drosophila melanogaster reside as tandem repeats in peri-centromeric nucleolar organizer regions on both the X and Y chromosomes. Each nucleolar organizer contains between 200–300 potential rDNA transcription units. Functional rDNA units in Drosophila encode 45S pre-rRNA that consists of an External Transcribed Spacer (ETS), 18S rRNA, Internal Transcribed Spacer 1 (ITS1), 5.8S and 2S rRNAs, Internal Transcribed Spacer 2 (ITS2), followed by the 28S rRNA [Citation1]. The ETS, ITS1, and ITS2 are removed and degraded during pre-rRNA processing, while the mature 18S, 5.8S+2S, and 28S rRNAs contribute to ribosome assembly [Citation1,Citation2].
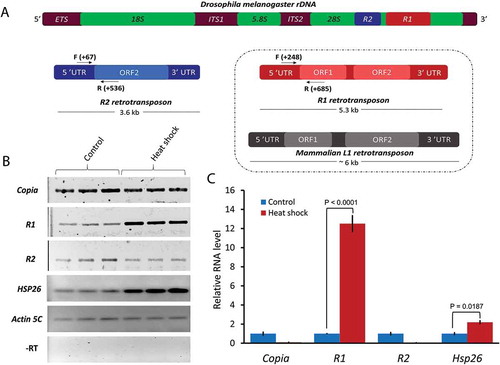
R1 and R2 are evolutionarily conserved retrotransposons in most arthropods [Citation3]. Both belong to the non-LTR family of Long Interspersed Nuclear Element (LINE) retrotransposons. R1 and R2 elements are structurally dissimilar from each other ()). Full-length R1 elements are about 5.3 kb in length with two open reading frames (ORF1 and ORF2); ORF1 encodes a protein of unknown function, while ORF2 encodes a protein with endonuclease and reverse transcriptase domains [Citation4]. While the majority of R1 elements are full length, R1 elements with 5ʹ truncated ends have been described [Citation5,Citation6]. Full-length R2 elements are about 3.6 kb in length with a single ORF that encodes a protein with DNA binding, endonuclease, and reverse transcriptase domains [Citation4].
Figure 1. Comparisons of R1 and R2 elements and selective induction of R1 by heat shock. (A) Schematic representation of R1 and R2 retrotransposons shown inserted into the 28S region of Drosophila melanogaster ribosomal DNA. R2 has a single ORF whereas R1 has two ORFs. R1 is therefore structurally similar to the mammalian LINE-1 (L1) retrotransposon (box). Horizontal arrows and corresponding numbers indicate the positions of primers (F = Forward and R = Reverse) used for semi-quantitative RT-PCRs and qRT-PCRs. (B) Semi-quantitative RT-PCRs were performed with total RNA isolated from non-heat shocked (control) and heat shocked wild type third instar larvae. (C) qRT-PCR analyses performed with first-strand cDNAs from control and heat shocked larvae as in (B). Ct values for each gene were normalized to Actin 5C transcript levels. P values were determined using the Student’s t-test with degrees of freedom = 3.
Both R1 and/or R2 elements are inserted within the 28S region of ~50–60% of the rDNA units at specific sequences. The vast majority of full-length R1 elements reside at nucleotide A5964 (Drosophila melanogaster rDNA sequences from Genebank, accession no. M21017.1) which is 51 bp downstream of G5913, the insertion site for most full-length R2 elements [Citation5]. Frequencies for R1 and R2 insertions within rDNA units of Drosophila melanogaster differ: about 44% of rDNA units contain only R1 elements, 11% have only R2 elements, and 5% have both R1 and R2 elements [Citation7]. The remaining 40% of the rDNA repeats contain no R1 or R2 insertions. Under normal growth conditions, R1-inserted rDNA units transcribe at about 1/5 the rate of un-inserted units, while R2-inserted units transcribe at about 1/10 the rate of un-inserted units [Citation7]. Overall, less than 10% of the inserted rDNA units are transcriptionally active. Ye and Eickbush [Citation7] showed that inserted and un-inserted rDNA units are not different in terms of nuclease sensitivity, psoralen cross-linking, or in epigenetic modifications to their core histone proteins. Occasional read-through transcription is believed to result in low-level R1 or R2 expression [Citation7]. Most work has been done on R2: it is cotranscribed with the 28S rDNA from the rDNA promoter by RNA polymerase I (Pol I) [Citation7]. The 5ʹ end of the R2 transcript encodes a self-cleaving hammerhead type ribozyme to separate itself from the 28S cotranscript [Citation8]. The rDNA units containing either R1 or R2 elements likely do not produce functional 28S rRNA [Citation7,Citation8].
Recent evidence suggests that R2 transcription increases upon nucleolar stress caused by the loss of Nopp140, a nucleolar ribosome assembly factor [Citation9], and that both R1 and R2 along with several other DNA-transposons and retrotransposons increase expression upon Lamin gene knockout in Drosophila [Citation10]. Several retrotransposons are known to respond to environmental stress conditions [Citation11–Citation13]; for example, the LINE-1 element (L1) in mammals and ONSEN in plants are prominent examples of retrotransposons that respond to heat shock [Citation11,Citation12]. Thus we undertook this study to test the effect of environmental stress conditions on R1 and R2 transcription. We report here that RNA Pol I is responsible for increased R1 transcription upon heat shock. We propose that heat shock releases Pol I from a stall site within the 5ʹ end of R1 elements thus allowing Pol I to transcribe nucleolar R1 elements. To our knowledge, this is the first positive correlation between heat shock and Pol I activity.
Results
Effect of heat shock on R1 expression
To test whether heat shock has an effect on the expression of R1 or R2 retrotransposons, we isolated total RNA from third instar larvae that were treated with or without heat shock. Semi-quantitative RT-PCRs (visual inspection of PCR product band intensities) and qRT-PCRs were performed to measure R1 and R2 transcript levels. We also tested for the expression of copia, another retrotransposon in Drosophila that does not insert into rDNA. Reports conflict on whether or not copia responds to heat shock [Citation14,Citation15]. We found that R1 transcription was significantly increased compared to that of R2 or copia after heat shock ()). qPCR data showed a 12-fold relative increase in R1 transcription in heat shock larvae versus non-heat shock larvae, whereas copia and R2 were downregulated after heat shock ()). We used Hsp26 transcription as a positive control for heat shock, and saw a two-fold increase in Hsp26 transcript levels over non-heat shocked controls (,)), suggesting that R1 induction by heat shock was robust as measured by qRT-PCR.
Effects of oxidative stress and nucleolar stress on R1 expression
To test if R1 and R2 respond to other forms of stress, we used oxidative stress and nucleolar stress. Oxidative stress is known to influence expression of retrotransposons like L1 in mammals and MAGGY in fungi [Citation11,Citation13]. To induce oxidative stress, third instar larvae were treated overnight with 3% hydrogen peroxide dissolved in the agar in petri plates. The plates were supplemented with granular yeast to prevent starvation. We used Thioredoxin-2 as a positive control as it responds positively to oxidative stress [Citation16], and we used Actin 5C as a loading and normalization control. Semi-quantitative RT-PCRs showed that R1, R2, and copia were not upregulated upon oxidative stress ()). In fact, qRT-PCR data indicated that copia and R1 transcription was suppressed upon oxidative stress ()). Expression of R2 appeared to be slightly elevated by qRT-PCR; however, the significance was minimal ()).
Figure 2. Oxidative stress and nucleolar stress fail to induce R1 expression. (A) Semi-quantitative RT-PCR analyses measuring respective transcripts in total RNA from control larvae versus larvae treated with 3% H2O2 (oxidative stress). (B) qRT-PCR analyses measuring respective transcripts in total RNA from control larvae and larvae treated with 3% H2O2. Ct values for each gene were normalized to Actin 5C transcript levels. P values were determined using the Student’s t-test with degrees of freedom = 3. (C) Semi-quantitative RT-PCRs measuring respective transcripts in total RNA from control wild type larvae, control P5CDh1-/- larvae (homozygous for a pBac element in the P5CDh1 gene) which control for nucleolar stress documented in homozygous Nopp140-/- gene knock out larvae [Citation9]. (D) qRT-PCR analyses measuring the copia, R1, and R2 transcript levels from wild type (WT), P5CDh1-/- larvae, and nucleolar stressed Nopp140-/- larvae. Ct values for each gene were normalized to Actin 5C transcript levels. P values were determined using the Student’s t-test with degrees of freedom = 3.
![Figure 2. Oxidative stress and nucleolar stress fail to induce R1 expression. (A) Semi-quantitative RT-PCR analyses measuring respective transcripts in total RNA from control larvae versus larvae treated with 3% H2O2 (oxidative stress). (B) qRT-PCR analyses measuring respective transcripts in total RNA from control larvae and larvae treated with 3% H2O2. Ct values for each gene were normalized to Actin 5C transcript levels. P values were determined using the Student’s t-test with degrees of freedom = 3. (C) Semi-quantitative RT-PCRs measuring respective transcripts in total RNA from control wild type larvae, control P5CDh1-/- larvae (homozygous for a pBac element in the P5CDh1 gene) which control for nucleolar stress documented in homozygous Nopp140-/- gene knock out larvae [Citation9]. (D) qRT-PCR analyses measuring the copia, R1, and R2 transcript levels from wild type (WT), P5CDh1-/- larvae, and nucleolar stressed Nopp140-/- larvae. Ct values for each gene were normalized to Actin 5C transcript levels. P values were determined using the Student’s t-test with degrees of freedom = 3.](/cms/asset/8b2e5b63-c431-473b-945b-6ab657d1de22/ktrn_a_1506682_f0002_oc.jpg)
We previously showed that transcription of R2 was significantly upregulated upon Nopp140 gene knockout (nucleolar stress) [Citation9]. To test if nucleolar stress has an effect on R1 transcription, we compared the expression of R1, R2, and copia in wild type versus Nopp140-/- knockout larvae by RT-PCR. While R2 transcript levels were elevated in Nopp140-/- larvae as expected [Citation9], expression of R1 and copia remained unchanged (,)).
P5CDh1-/- larvae (,)) served as controls for the Nopp140-/- larvae. These larvae are homozygous for a pBac transposon (fly line f04633) that resides within the 3ʹ end of delta-1-pyrroline-5-carboxylate dehydrogenase 1, the gene immediately downstream of the Nopp140 gene that encodes a mitochondrial matrix enzyme required for the normal breakdown of excess proline. This pBac element was used to delete the Nopp140 gene [Citation9], thus we use P5CDh1-/- larvae to control for all phenotypes associated with Nopp140-/-. We can readily distinguish the separate phenotypes since P5CDh1-/- larvae display later lethality than do Nopp140-/- larvae [see [Citation9]]. Both R1 and R2 transcripts were under-produced in late P5CDh1-/- larvae, due perhaps to disrupted mitochondrial function [Citation17]. In summary, our combined data suggest that R1 and R2 respond to different stress conditions, R1 to heat shock and R2 to nucleolar stress.
RNA polymerase I transcribes R1 upon heat shock
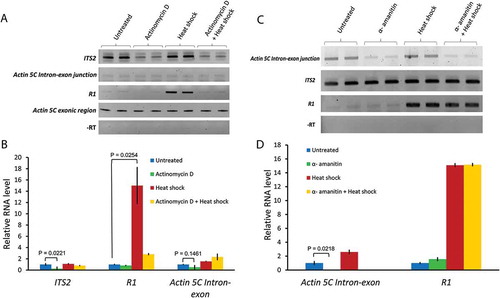
We know that R2 is transcribed by RNA polymerase I (Pol I) [Citation7], but we wanted to determine which polymerase (Pol I or II) is responsible for R1 transcription upon heat shock. Knowing which polymerase is responsible for R1 transcription upon heat shock should reveal possible mechanisms regulating R1 expression. To test for the possible involvement of Pol I, we treated Drosophila S2 culture cells with a low dose (0.08 μg/mL) of Actinomycin D [Citation18,Citation19] for 6 hrs. The 5ʹ ETS sequences generated by abortive Pol I transcription upon Actinomycin D treatment are known to be polyadenylated [Citation20]. However, no such modification is known to exist for the ITS transcripts which are rapidly degraded by exosomes [Citation21]. We therefore used ITS2 expression as an indicator for Pol I transcription. We found a significant loss of ITS2 transcript levels upon Actinomycin D treatment, indicating that Pol I transcription was inhibited by the drug, as expected (,)). To test if Pol I is responsible for the heat shock induced transcription of R1, S2 cells were again treated with Actinomycin D as before, but now heat shocked in the continuous presence of Actinomycin D. Heat shock induction of R1 decreased from 15-fold to about 3-fold by the Actinomycin D treatment ()). These results support the involvement of Pol I in transcribing R1 elements upon heat shock.
Figure 3. Actinomycin D, but not alpha-amanitin, blocks R1 expression upon heat shock. (A) Semi-quantitative RT-PCR assays measuring respective transcript levels in total RNA isolated from untreated, Actinomycin D (0.08 µg/mL) treated, heat shocked, and actinomycin D + heat shock treated S2 cells. (B) qRT-PCR analyses performed with the first strand cDNAs from all of the treatments used in (A). Ct values for each gene were normalized to the expression of Actin 5C exonic transcript. P values were determined using the Student’s t-test with degrees of freedom = 2. (C) Semi-quantitative RT-PCR assays measuring R1, ITS2, and Actin 5C intron-exon junction transcripts in untreated, α-amanitin (15 µg/mL) treated, heat shocked, and α-amanitin + heat shock treated S2 cells. (D) Bar graph showing qRT-PCR analysis performed with the first strand cDNAs from all of the treatments used in (C). Ct values for each gene were normalized to ITS2 transcript levels. P values were determined using the Student’s t-test with degrees of freedom = 2.
RNA polymerase II fails to transcribe R1 upon heat shock
Most non-LTR retrotransposons have an internal Pol II promoter [Citation22–Citation24]. To rule out the possibility that Pol II was responsible for R1 transcription upon heat shock, we first determined if Pol II transcription in general was affected by the dose of Actinomycin D used above to inhibit Pol I. We again used RT-PCR to demonstrate a region within the Actin 5C pre-mRNA that contained an intron-exon junction; the intron is expected to degrade quickly upon removal, so the appearance and abundance of the RT-PCR intron-exon junction product should denote active Pol II transcription. With Actinomycin D treatment we failed to see a change in the Actin 5C intron-exon junction product compared to controls (,)). We therefore conclude that Pol II transcription was not affected by the concentration of Actinomycin D used to block Pol I.
We then ruled out the possibility of Pol II-mediated transcription of R1 upon heat shock by treating S2 cells with 15 μg/mL α-amanitin followed by heat shock (,)). We found that the same Actin 5C intron-exon junction RT-PCR product was now downregulated as expected upon α-amanitin treatment, but that R1 expression remained high. The relative amounts of R1 RNA were 10 to 15-fold higher in cells treated either with heat shock only or with a combination of α-amanitin followed by heat shock versus R1 transcript levels in control cells ()).
As an additional control, we tested for possible changes in Pol I activity due indirectly to α-amanitin treatment again by measuring ITS2 expression in cells treated with α-amanitin. We saw no difference in ITS2 transcript abundance, suggesting that α-amanitin at 15 μg/mL had no effect on Pol I transcription (,)). Taken together, our observations support Pol I-mediated transcription of R1 elements during heat shock, and rule out Pol II-mediated transcription of R1 upon heat shock.
RNA Pol I reads through to transcribe nucleolar R1 elements upon heat shock
Ye and Eickbush [Citation7] predicted that under normal growth conditions, RNA Pol I would fall off within first 1 kb of the 5ʹ end of R1. To test for 28S-R1 cotranscripts in third instar larvae upon heat shock, we again used RT-PCR with forward primers placed within the 28S region at −47 bp and at −167 upstream of the R1 element and a reverse primer placed within R1 at position +685. Both RT-PCRs showed accumulation of 28S-R1 cotranscripts upon heat shock ()).
Figure 4. Read-through transcription from 28S into R1 elements upon heat shock. (A) Read-through transcription was shown by semi-quantitative RT-PCRs using two separate forward primers at positions −47 and −167 in upstream 28S sequences to amplify first strand cDNAs prepared using a reverse primer at position +685 within R1. (B) Sequence analysis of the RT-PCR products displayed in Figure 4(a) showed the 28S rDNA sequences β’ (green) and β” (purple) directly upstream of R1 elements [see [Citation27]]. The complete 5ʹ end of R1 is shown in red with two putative pause buttons in yellow and a heat shock element in blue. Consensus sequences for the pause button [Citation30] and the heat shock element [Citation31] are provided for comparison. R represents a purine (A or G), and W represents a weaker hydrogen-bonding base (A or T).
![Figure 4. Read-through transcription from 28S into R1 elements upon heat shock. (A) Read-through transcription was shown by semi-quantitative RT-PCRs using two separate forward primers at positions −47 and −167 in upstream 28S sequences to amplify first strand cDNAs prepared using a reverse primer at position +685 within R1. (B) Sequence analysis of the RT-PCR products displayed in Figure 4(a) showed the 28S rDNA sequences β’ (green) and β” (purple) directly upstream of R1 elements [see [Citation27]]. The complete 5ʹ end of R1 is shown in red with two putative pause buttons in yellow and a heat shock element in blue. Consensus sequences for the pause button [Citation30] and the heat shock element [Citation31] are provided for comparison. R represents a purine (A or G), and W represents a weaker hydrogen-bonding base (A or T).](/cms/asset/fd78e180-6e72-45bf-89e5-d81c6852ab52/ktrn_a_1506682_f0004_oc.jpg)
R1 elements that reside within rDNA units of the nucleolar organizers have been well characterized in terms of their flanking 28S rDNA sequences [Citation5,Citation25]. For example, the genomic rDNA clone from Drosophila melanogaster, cDm103, contains a full-length R1 element flanked by diagnostic 28S sequences. Tandemly repeated R1 elements are also known to reside within centromeric heterochromatin, and at least one truncated R1 copy exists on Chromosome 4 [Citation25–Citation29]. Genomic clone cDm219 from Drosophila melanogaster contains five of these tandem centromeric R1 repeats. Each repeat in cDm219 is flanked by 28S sequences that distinguish these centromeric copies from nucleolar copies [Citation27]. Therefore, we sequenced the 28S-R1 junction in the two RT-PCR products derived from heat shocked S2 cells shown in ) in order to determine if the R1 elements expressed during heat shock originated from nucleolar organizer rDNA or from centromeric heterochromatin. The sequence we obtained ()) consists of 28S rDNA segments β’ (green) and β’’ (purple) (nomenclature from [Citation27]) fused to R1. This sequence matches the left side of the 28S-R1 junction as found in genomic clone cDm103. The sequencing peaks were clean, indicating that the majority of R1 elements induced by heat shock had identical 28S-R1 sequence junctions. Thus we conclude that the vast majority of heat shock induced R1 elements were complete at their 5ʹ ends.
Each R1 repeat within genomic clone cDm219 contains flanking 28S sequences that distinguish these elements as centromeric (Supplementary Data Fig. S1, upper panel). They include the 28S β* sequence (a transposition duplication) immediately upstream of β’’ which in turn is upstream of an R1 repeat [Citation27]. While our RT-PCR sequence ()) contains the β’’ sequence directly upstream of R1, it lacks the distinctive β* sequence, and has instead the B’ sequence upstream of B”. In addition, R1 elements inserted into rDNA (e.g., cDm103) differ in sequence from R1 elements in the centromeric heterochromatin (e.g., cDm219) [Citation27]. These differences include several base pair changes as well as small insertions and deletions (Supplementary Data Fig. S1, lower panel). Because our RT-PCR product is identical to the left side 28S-R1 junction in cDm103 and distinctly different from that in cDm219, we conclude that Pol I transcribes from 28S β’ and β’’ (i.e. lacking β*) into R1 elements that are complete at their 5ʹ ends and that reside within nucleolar organizer rDNA rather than in centromeric heterochromatin.
Finally, upon closer examination of these sequences, we found a “pause button” as defined for RNA Pol II genes [Citation30] at the immediate 5ʹ end of the R1 element and an imperfect “pause button” at +175 within R1 element (), enlarged yellow sequences). We also found a partially inverted sequence (GACTCGTC in )) that is reminiscent of the consensus heat shock element (GAATNTTC) [Citation31] typically bound by Heat Shock Factor (HSF) upon heat shock. We note a single inverted GAGA element at −67 in the 28S region upstream of R1 (not shown). The presence of the pause buttons and the heat shock-related consensus element within the 5ʹ end of R1 elements is consistent with Pol I stalling at or within the 5ʹ end of R1 under normal growth conditions, but then releasing from the stall and reading farther into R1 elements upon heat shock.
Analysis of PRO-seq data to assess active Pol I densities
PRO-seq data set submitted to NCBI-GEO by Duarte et al. [Citation32] supports our experimental data. The PRO-seq technique measures the density of active RNA polymerases on any genomic region. This density is measured by the number of nascent transcript reads at that particular region [Citation33]. The data sets used here include sequence reads from S2 cells that were heat shocked for 20 min versus non-heat shocked S2 control cells. While we could analyze R1 elements separately from 28S regions, we could not isolate only those 28S regions that contained R1 elements from un-inserted 28S regions. Pol I densities upon heat shock were reduced on 28S regions as compared to Pol I densities on the same regions under non-heat shocked conditions (), left panel). Pol I densities on R2 elements did not differ with or without heat shock (), middle panel). However, analysis of only R1 elements in heat shocked cells versus control cells showed that Pol I densities were greater but heterogeneous along the length of R1 elements (~ 5.3 kb) upon heat shock. This is consistent with our experimental evidence of enhanced R1 transcription during heat shock (), right panel and ), top panel).
Figure 5. Precision run-on sequencing (PRO-seq) data [Citation30] analysis showing RNA Pol I within R1 elements upon heat shock. (A) Bar graphs showing Pol I density on the 28S region (left panel), on R1 elements (right panel), and on R2 elements (middle panel). Bar graphs were generated using UGENE software for control (no heat shock, NHS) and heat shocked (HS) S2 cells (see Materials and Methods). Graphs were scaled equally on their Y axes. (B) Upper panel: PRO-seq data analysis bar graphs showing RNA Pol I within R1 elements (5356 bp) under no heat shock (NHS) and heat shock (HS) conditions. Bar graphs were generated and scaled equally on their Y axes using IGV2 [Citation48]. Lower panel: magnified view of Pol I densities on the 5ʹ end of R1 elements under heat shock conditions. Dashed blue lines magnify the 5ʹ end of R1 elements where transcripts accumulate upon heat shock. This graph and the underlying DNA sequence were generated using Savant genome browser (Materials and Methods). A partially inverted motif (GACTCGTC) reminiscent of a HSF binding site is boxed. Nucleotide position +349 (T, arrow) marks an increased accumulation of R1 transcripts upon heat shock.
![Figure 5. Precision run-on sequencing (PRO-seq) data [Citation30] analysis showing RNA Pol I within R1 elements upon heat shock. (A) Bar graphs showing Pol I density on the 28S region (left panel), on R1 elements (right panel), and on R2 elements (middle panel). Bar graphs were generated using UGENE software for control (no heat shock, NHS) and heat shocked (HS) S2 cells (see Materials and Methods). Graphs were scaled equally on their Y axes. (B) Upper panel: PRO-seq data analysis bar graphs showing RNA Pol I within R1 elements (5356 bp) under no heat shock (NHS) and heat shock (HS) conditions. Bar graphs were generated and scaled equally on their Y axes using IGV2 [Citation48]. Lower panel: magnified view of Pol I densities on the 5ʹ end of R1 elements under heat shock conditions. Dashed blue lines magnify the 5ʹ end of R1 elements where transcripts accumulate upon heat shock. This graph and the underlying DNA sequence were generated using Savant genome browser (Materials and Methods). A partially inverted motif (GACTCGTC) reminiscent of a HSF binding site is boxed. Nucleotide position +349 (T, arrow) marks an increased accumulation of R1 transcripts upon heat shock.](/cms/asset/9e75c123-235f-4919-b877-dc3293e1afe9/ktrn_a_1506682_f0005_oc.jpg)
In assessing Pol I densities on R1 elements in the heat shocked S2 cells, we noticed that the Pol I density remained relatively low within the first ~350 bp of R1 (), top panel). This is the region that contains the putative pause buttons at positions +1 and +175. We used the Savant genome browser to analyze the Tiled Data File (TDF) file (see Materials and Methods) generated with the heat shock data set, along with the reference genome of R1 sequence to narrow down the region within R1 where Pol I begins to show a density increase upon heat shock. The generated bar graph (expanded region in ), lower panel) indicates that nucleotide +349 (T) within R1 is where Pol I density begins to increase upon heat shock with a significant peak at +356–396. PRO-seq showed undetectable Pol I densities on R1 elements in non-heat shocked cells compared to heat shock cells when the Y axes were scaled equally. Interestingly, nucleotide +349 (T) lies within the partially inverted heat shock-related consensus sequence, GACTCGTC, described above in ) (shown again as the boxed sequence in the lower panel of )).
Discussion
While R1 expression remains relatively silent under normal, non-heat shock conditions and during oxidative stress or nucleolar stress, we showed that R1 expression rises significantly upon heat shock, and that this transcription is mediated by RNA Pol I (, , ). As far as we know, this is the first example of a positive response by Pol I to heat shock. Several reports indicate that mammalian Pol I transcription is reduced or eliminated by heat shock at 42–43°C [e.g. [Citation34–Citation36],]. The effects of heat shock on Pol I transcription in Drosophila seem to be mixed; early reports [Citation37–Citation39] indicated that Drosophila Pol I continues transcribing pre-rRNA upon heat shock (35–37°C). One of these reports [Citation39] stated that Pol I transcription rates remain at 70% of control levels upon heat shock. All three Drosophila reports, however, indicated that pre-rRNA processing and ribosomal protein synthesis were blocked by heat shock. Contrary to these early reports, the PRO-seq profiles generated by the Lis lab [Citation32] clearly show that Pol I densities on the 18S and 28S rDNA regions are reduced during heat shock, but not completely eliminated ()).
A model for R1 transcription upon heat shock
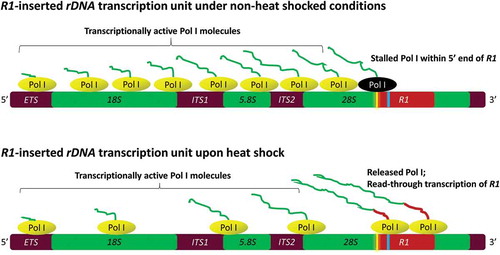
The model we favor () for R1 expression is that RNA Pol I reads-through from upstream 28S regions and then stalls within the first 350 bps of R1 elements under normal non-heat shock conditions. Three observations support read-through transcription. First, BLAST sequence comparisons between the first 680 bps of intact R1 elements and the Drosophila rDNA core promoter show no significant homology, suggesting there are no discernible Pol I promoter sequences within the 5ʹ end of R1 elements. Second, previous nuclear run-on transcription assays of R1 in Drosophila melanogaster indicated that Pol I reads into the 5ʹ end of R1 where it either arrests or falls off the DNA with little read-through to the 3ʹ end of R1 [Citation7]. Third, our sequence analyses of the two RT-PCR products ()) clearly indicate that 28S-R1 cotranscripts result from read-through transcription upon heat shock.
Figure 6. Proposed model showing a stalled RNA Pol I complex (black) near the “pause button” (yellow) within the 5ʹ end of R1 elements under non-heat shock conditions. Thin irregular lines attached to the Pol I complexes (green) represent pre-rRNA transcripts. Upon heat shock, pre-positioned and stalled Pol I complexes on R1 elements are released allowing them to read farther into R1 resulting in the accumulation of 28S-R1 cotranscripts with R1 transcript sequences represented as the thicker red line. Extended heat shock likely reduces the number of Pol I complexes on the 18S and 28S regions of the rDNA. The inverted repeat sequence (GACTCGTC) at +349 is shown in blue.
While precise mechanisms controlling Pol I’s arrest within R1 elements remain unknown, it is interesting to note that the very 5ʹ ends of complete R1 elements begin with a DNA sequence (+1–6) that is nearly identical to the consensus “pause button” ()) as described for RNA Pol II complexes that stall on Drosophila heat shock genes and developmental control genes [Citation30]. We see a second, but imperfect pause button at position +175–180 within the 5ʹ end of R1 ()). Multiple pause buttons suggest multiple Pol I complexes arresting within the 5ʹ region of R1 elements prior to heat shock. Interestingly and for reasons that remain uncertain, the PRO-seq analysis shows that upon heat shock, this region maintains a relatively low density of active Pol I complexes ()).
Our model also proposes that upon heat shock, stalled Pol I complexes are released to continue transcription further into R1 elements. Our RT-PCR studies show abundant cotranscripts extending to at least position +685 of R1 ()), and the PRO-seq analysis shows active Pol I complexes beginning at +349 upon heat shock ()). The PRO-seq analysis, however, also shows a loss of active Pol I on the 28S rDNA upstream of R1 elements during heat shock ()). While this seems to be a contradiction, Zhao et al. [Citation36] showed that in mammalian cells heat shock blocks rDNA transcription initiation by inactivating Transcription Initiation Factor 1A (TIF1A), and by activating a long non-coding RNA (PAPAS) that in turn recruits the NuRD complex to rDNA enhancers. NuRD then remodels the enhancer chromatin toward configurations that repress transcription initiation. If similar mechanisms repress rDNA transcription initiation in Drosophila upon heat shock, active Pol I complexes should decline on the rDNA coding sequences as the PRO-seq analysis indicates ()). We propose that Pol I complexes arrested within the first ~350 bp of R1 elements are pre-positioned before heat shock for rapid release upon thermo-stress. If this proves true, we predict an initial burst of R1 transcription with the onset of heat shock. R1 transcription rates would then diminish with extended heat shock as fewer active Pol I complexes would read-through from upstream 28S regions due to a loss of Pol I recruitment and transcription initiation at the rDNA promoter [Citation36].
Heat shock factors and elements
How stalled Pol I complexes are released to activate R1 transcription also remains unknown. All previously described heat shock genes are transcribed by RNA Pol II [Citation40], with heat shock induction mediated largely by HSF and GAGA factor (GAF) proteins [Citation41]. Multiple HSF and GAF binding sites are typically present in the promoters for these heat shock genes [Citation31,Citation42,Citation43]. However, while we note a single inverse GAGA element in the 28S region at approximately −67 upstream of R1, and a reported weak interaction between GAF and the 28S region at about 200 bp downstream from the R1 insertion site [Citation44], multiple HSF or GAF binding sites are absent in the 28S rDNA immediately upstream of R1 and within the 5ʹ end of R1 itself. There is, however, a palindromic sequence GACTCGTC with the center T located at position +349 within R1 (boxed region in ), lower panel). This sequence is reminiscent of a HSF binding motif (GAANNTTC) [Citation42,Citation43]. Interestingly, the PRO-seq data analysis shows a significant increase in transcript levels upon heat shock beginning at this sequence element (), lower panel, expanded region). Currently we do not know if either the inverted GAGA element at −67 in the 28S region or the palindromic sequence at +349 in R1 play active roles in the heat shock induction of R1 elements.
Despite this uncertainty, HSF and GAF do appear to play a positive role in R1 expression during heat shock; specifically, the PRO-seq data shows a decrease in active Pol I density on R1 elements upon heat shock when either HSF or GAF are depleted by siRNA expression versus controls [Citation32] (Supplementary Data, Fig. S2). This observed decrease suggests active involvement of HSF and the GAF in transcribing R1 elements upon heat shock, perhaps by stabilizing the Pol I complexes released from the stall region upstream of +350.
Duarte et al. [Citation32] reported that while HSF is not necessary or sufficient for the majority of genes activated by heat shock, HSF is required for the release of RNA Pol II stalled on developmental regulatory genes in Drosophila. Thus, HSF could play a similar role in releasing Pol I to transcribe R1 elements upon heat shock, and perhaps in stabilizing Pol I complexes that resume R1 transcription upon heat shock. Future analyses (e.g., ChIP, permanganate foot printing) should determine if the mechanisms controlling Pol I stalling on R1 elements and its subsequent transcription of R1 upon heat shock are related to mechanisms that control Pol II stalling and continued transcription of heat shock and developmental control genes [Citation30].
Finally, our combined work shows that the two retrotransposons, R1 and R2, behave differently in their regulated expressions; heat shock for R1 (this report) and nucleolar stress for R2 [Citation9]. Different stress conditions could potentially alter rDNA chromatin configurations in alternative manners, thus differentially affecting R1 versus R2 expression patterns.
Materials and methods
Heat shock and RT-PCRs
All Drosophila melanogaster stocks were grown at room temperature (22–24°C) on standard fly medium. The w1118 stock was used as wild type (WT). For heat shock treatment of larvae, ~20 well fed third instar WT larvae were placed into an empty fly vial which was placed in a water bath set at 37°C for 1 hr. Total RNA was isolated with TRIzol (Invitrogen) using the manufacturer’s recommendations. Total RNA was also isolated from ~20 well fed non-heat shocked third instar WT larvae kept in a similar empty vial at room temperature for 1 hr. RNA samples were treated with RNase-free DNase I (Promega) for 1 hr at 37°C and then ethanol precipitated. RNA concentrations were determined using NanoDrop, and then equalized in concentration. Equal masses of total RNA were used for first strand cDNA synthesis using M-MuLV reverse transcriptase (RT; New England BioLabs). Conditions for +RT were the same as those for -RT; the initial annealing reaction containing the reverse primer and 2 µg of RNA was split into two equal aliquots. One aliquot was added to the reaction mixture containing RT, and the other aliquot was added to an identical mixture but lacking RT. RNA was digested with DNase-free RNase (Ambion) after first strand cDNA synthesis. Equal volumes of first strand cDNA mixture were subsequently used to perform semi-quantitative PCR (products visualized by ethidium stained gels) and qPCR using gene specific primers (). All semi-quantitative PCRs shown in – used the same reaction conditions except for annealing temperatures which varied depending on the specific primer pairs. The number of cycles was kept constant (25) for all semi-quantitative PCRs which were performed in triplicate; thus there are three lanes for each measured gene product. PCR products were resolved on 1% agarose gels, stained with ethidium bromide, and imaged using a Bio-Rad gel imager.
Table 1. Primers used for RT-PCRs/qRT-PCRs. Primers marked by (*) were used for both RT-PCRs and qRT-PCRs. The primers without (*) were used for semi-quantitative RT-PCR only. The R1 RT-Reverse primer was used for experiments in , and .
For qRT-PCRs, equal volumes of first strand cDNAs were added to New England BioLabs’ Luna universal qPCR master mix. We used a Quantstudio 6 qPCR instrument from Applied Biosystems. All qPCR reactions were carried out for 40 cycles using the same conditions with 60°C as the annealing temperature. qPCR analysis was as described [Citation45]. Statistical significance in expression levels was measured by the Student’s t-test with the degrees of freedom for individual experiments provided in the figure legends.
Oxidative and nucleolar stress treatments
For oxidative stress, well fed third instar larvae were cultured for 1 day on 0.5% agar plates with or without 3% hydrogen peroxide. All plates were supplemented with granular yeast lightly sprinkled on their surfaces. Isolation of total RNA and RT-PCRs were as described above. For nucleolar stress treatment [Citation9], total RNA was isolated from WT larvae, larvae homozygous for P5CDh1f01473, and larvae homozygous for the Nopp140 gene deletion (lab fly stock KO121) [Citation9]. RT-PCRs were performed as described above.
Inhibition of RNA polymerases I and II
To inhibit RNA Pol I, S2 cells were grown to confluency in 25 cm2 culture flasks using Schneider’s cell culture medium (Gibco). Cells were incubated at room temperature for 6 hrs with or without 0.08 μg/mL of Actinomycin D (Sigma, A9415) [Citation18,Citation19]. Cells were then heat shocked for 1 hr by suspending the culture flask in a 37°C water bath. Untreated control cells were given neither heat shock nor Actinomycin D treatment. RNA isolation and RT-PCRs were performed as described above.
To inhibit RNA Pol II, cells in separate flasks were either treated with 15 μg/mL of α-amanitin (Sigma, A2263) for 24 hrs or left untreated. Both treated and untreated cells were heat shocked for 1 hr. Untreated control cells did not receive either treatment. RNA isolation and subsequent RT-PCRs were as described above using gene specific primers ().
Analysis of PRO-seq data
The Drosophila whole genome precision run-on sequencing (PRO-seq) data set generated by Duarte et al. [Citation32] and available at NCBI – Gene expression omnibus (GEO) (accession GSE77607) was compiled from experiments on S2 cells with and without heat shock. The raw reads were uploaded to the Galaxy server [Citation46] by File Transfer Protocol (FTP) along with indexed custom FASTA files of both R1 and one entire Drosophila rDNA unit containing R1 and R2. Bowtie2 [Citation47] with default parameters was used to generate binary versions of Sequence Alignment Map (SAM) files. These binary files are commonly known as Binary version of SAM (BAM) files. However, to be able to visualize the BAM files using Integrative Genomics Viewer version 2 (IGV2) [Citation48], we converted them to the Tiled Data File (TDF) format using IGV-tools. We visualized them using IGV2 [Citation48] after scaling the Y axes equally.
Supplemental Material
Download Zip (187.2 KB)Acknowledgments
We thank Craig Hart, Maheshi Dassanayake, and Wesley Frey for their assistance with PRO-seq data analysis.
Disclosure statement
No potential conflict of interest was reported by the authors.
Supplemental data
Supplemental data for this article can be accessed on the publisher’s website.
Additional information
Funding
References
- Long EO, Dawid IB. Alternative pathways in the processing of ribosomal RNA precursor in Drosophila melanogaster. J Mol Biol. 1980;138(4):873–878. PMID:6774101
- Turowski TW, Tollervey D. Cotranscriptional events in eukaryotic ribosome synthesis. WIREs RNA. 2015;6(1):129–139. PMID:25176256
- Perez-Gonzalez CE, Eickbush TH. Rates of R1 and R2 retrotransposition and elimination from the rDNA locus of Drosophila melanogaster. Genetics. 2002;162(2):799–811. PMID:12399390
- Eickbush TH. R2 and related site-specific non-long terminal repeat retrotransposons. mobile DNA II. Washington (DC): American Society of Microbiology; 2002. DOI:10.1128/9781555817954.ch34.
- Stage DE, Eickbush TH. Origin of nascent lineages and the mechanisms used to prime second-strand DNA synthesis in the R1 and R2 retrotransposons of Drosophila. Genome Biol. 2009;10:R49.
- Long EO, Dawid IB. Expression of ribosomal DNA insertions in Drosophila melanogaster. Cell. 1979;18(4):1185–1196. PMID:117903
- Ye J, Eickbush TH. Chromatin structure and transcription of the R1- and R2-inserted rRNA genes of Drosophila melanogaster. Mol Cell Biol. 2006;26(23):8781–8790. PMID: 17000772
- Eickbush DG, Eickbush TH. R2 retrotransposons encode a self-cleaving ribozyme for processing from an rRNA cotranscript. Mol Cell Biol. 2010;30(13):3142–3150. PMID:20421411
- He F, James A, Raje H, et al. Deletion of Drosophila Nopp140 induces subcellular ribosomopathies. Chromosoma. 2015;124(2):191–208. PMID:25384888
- Chen H, Zheng X, Xiao D, et al. Age-associated de-repression of retrotransposons in the Drosophila fat body, its potential cause and consequence. Aging Cell. 2016;15(3):542–552. PMID:27072046
- Lavie L, Maldener E, Brouha B, et al. The human L1 promoter: variable transcription initiation sites and a major impact of upstream flanking sequence on promoter activity. Genome Res. 2004;14(11):2253–2260. PMID:15520289
- Cavrak VV, Lettner N, Jamge S, et al. How a retrotransposon exploits the plant’s heat stress response for its activation. PLoS Genet. 2014;10(1):e1004115. PMID:24497839
- Ikeda K, Nakayashiki H, Takagi M, et al. Heat shock, copper sulfate and oxidative stress activate the retrotransposon MAGGY resident in the plant pathogenic fungus Magnaporthe grisea. Mol Genet Genomics. 2001;266(2):318–325. PMID:11683275
- Strand DJ, McDonald JF. Copia is transcriptionally responsive to environmental stress. Nucleic Acids Res. 1985;13(12):4401–4410. PMID:2409535
- Gilmour DS, Lis JT. In vivo interactions of RNA polymerase II with genes of Drosophila melanogaster. Mol Cell Biol. 1985;5(8):2009–2018. PMID:3018544
- Svensson MJ, Larsson J. Thioredoxin-2 affects lifespan and oxidative stress in Drosophila. Hereditas. 2007;144(1):25–32. PMID:17567437
- He F, DiMario PJ. Drosophila delta-1-pyrroline-5-carboxylate dehydrogenase (P5CDh) is required for proline breakdown and mitochondrial integrity - Establishing a fly model for human type II hyperprolinemia. Mitochondrion. 2011;11:397–404. PMID:21168532
- Perry RP, Kelley DE. Inhibition of RNA synthesis by actinomycin D: characteristic dose-response of different RNA species. J Cell Physiol. 1970;76(2):127–139. PMID: 55000970
- Chen HK, Pai CY, Huang JY, et al. Human Nopp140, which interacts with RNA polymerase I: implications for rRNA gene transcription and nucleolar structural organization. Mol Cell Biol. 1999;19(12):8536–8546. PMID 10567578
- Shcherbik N, Wang M, Lapik YR, et al. Polyadenylation and degradation of incomplete RNA polymerase I transcripts in mammalian cells. EMBO Rep. 2010;11(2):106–111. PMID:20062005
- Allmang C, Mitchell P, Petfalski E, et al. Degradation of ribosomal RNA precursors by the exosome. Nucleic Acids Res. 2000;28(8):1684–1691. PMID:10734186
- Mizrokhi LJ, Georgieva SG, Ilyin YV. Jockey, a mobile Drosophila element similar to mammalian LINEs, is transcribed from the internal promoter by RNA polymerase II. Cell. 1988;54(5):685–691. PMID:2842063
- Heras SR, Thomas MC, García-Canadas M, et al. L1Tc non-LTR retrotransposons from Trypanosoma cruzi contain a functional viral-like self-cleaving 2A sequence in frame with the active proteins they encode. Cell Mol Life Sci. 2006;63(12):1449–1460. PMID:16767356
- Ostertag EM, Kazazian HH Jr. Biology of mammalian L1 retrotransposons. Annu Rev Genet. 2001;35:501–538. PMID:11700292
- Dawid IB, Botchan P. Sequences homologous to ribosomal insertions occur in the Drosophila genome outside the nucleolus organizer. Proc Natl Acad Sci USA. 1977;74:4233–4237. PMID:412186
- Kidd SJ, Glover DM. A DNA segment from D. melanogaster which contains five tandemly repeated units homologous to the major rDNA insertion. Cell. 1980;19:103–119. PMID:6244098
- Roiha H, Miller JR, Woods LC, et al. Arrangements and rearrangements of sequences flanking the two types of rDNA insertion in D. melanogaster. Nature. 1981;290:749–753. PMID:6783966
- Browne MJ, Read CA, Roiha H, et al. Site specific insertion of a type I rDNA element into a unique sequence in the Drosophila melanogaster genome. Nucleic Acids Res. 1984;12:9111–9122. PMID:6096818
- Glover DM, Hogness DS. A novel arrangement of the 18S and 28S sequences in a repeating unit of Drosophila melanogaster rDNA. Cell. 1977;10:167–176. PMID:402220
- Hendrix DA, Hong J-W, Zeitlinger J, et al. Promoter elements associated with RNA Pol II stalling in the Drosophila embryo. Proc Natl Acad Sci. 2008;105(22):7762–7767. PMID:18505835
- Akerfelt M, Morimoto RI, Sistonen L. Heat shock factors: integrators of cell stress, development and lifespan. Nat Rev Mol Cell Biol. 2010;11(8):545–555. PMID:20628411
- Duarte FM, Fuda NJ, Mahat DB, et al. Transcription factors GAF and HSF act at distinct regulatory steps to modulate stress-induced gene activation. Genes Dev. 2016;30(15):1731–1746. PMID:27492368
- Mahat DB, Kwak H, Booth GT, et al. Base-pair-resolution genome-wide mapping of active RNA polymerases using precision nuclear run-on (PRO-seq). Nat Protoc. 2016;11(8):1455–1476. PMID:27442863
- Bouche G, Raynal F, Amalric F, et al. Unusual processing of nucleolar RNA synthesized during a heat shock in CHO cells. Mol Biol Rep. 1981;7:253–258. PMID:7290092
- Ghoshal K, Jacob ST. Heat shock selectively inhibits ribosomal RNA gene transcription and down-regulates E1BF/Ku in mouse lymphosarcoma cells. Biochem J. 1996;317:689–695. PMID:8760351
- Zhao Z, Dammert MA, Hoppe S, et al. Heat shock represses rRNA synthesis by inactivation of TIF-IA and lncRNA-dependent changes in nucleosome positioning. Nucleic Acids Res. 2016;44(17):8144–8152. PMID:27257073
- Ellgaard EG, Clever U. RNA metabolism during puff induction in Drosophila melanogaster. Chromosoma. 1971;36(1):60–78. PMID:5003534
- Lengyel JA, Ransom LJ, Graham ML, et al. Transcription and metabolism of RNA from the Drosophila melanogaster heat shock puff site 93D. Chromosoma. 1980;80(3):237–252. PMID:6160021
- Bell J, Neilson L, Pelligrini M. Effect of heat shock on ribosomal synthesis in Drosophila melanogaster. Mol Cell Biol. 1988;8(1):91–95. PMID:3122028
- Bonner JJ, Kerby RL. RNA polymerase II transcribes all of the heat shock induced genes of Drosophila melanogaster. Chromosoma. 1982;85(1):93–108. PMID:6807638
- Mahat DB, Salamanca HH, Duarte FM, et al. Mammalian heat shock response and mechanisms underlying its genome-wide transcriptional regulation. Mol Cell. 2016;62(1):63–78. PMID:27052732
- Perisic O, Xiao H, Lis JT. Stable binding of Drosophila heat shock factor to head-to-head and tail-to-tail repeats of a conserved 5 bp recognition unit. Cell. 1989;59(5):797–806. PMID:2590940
- Amin J, Ananthan J, Voellmy R. Key features of heat shock regulatory elements. Mol Cell Biol. 1988;8(9):3761–3769. PMID:3146692
- O’Brien T, Wilkins RC, Giardina C, et al. Distribution of GAGA protein on Drosophila genes in vivo. Genes Dev. 1995;9(9):1098–1110. PMID:7744251
- Winer J, Jung CK, Shackel I, et al. Development and validation of real-time quantitative reverse transcriptase-polymerase chain reaction for monitoring gene expression in cardiac myocytes in vitro. Anal Biochem. 1999;270(1):41–49. PMID:10328763
- Afgan E, Baker D, van den Beek M, et al. The galaxy platform for accessible, reproducible and collaborative biomedical analyses: 2016 update. Nucleic Acids Res. 2016;44(W1):W3–W10. PMID:27137889
- Langmead B, Salzberg SL. Fast gapped-read alignment with Bowtie 2. Nat Methods. 2012;9(4):357–359. PMID:22388286
- Robinson JT, Thorvaldsdottir H, Winckler W, et al. Integrative genomics viewer. Nat Biotechnol. 2011;29(1):24–26. PMID:21221095