
 ?Mathematical formulae have been encoded as MathML and are displayed in this HTML version using MathJax in order to improve their display. Uncheck the box to turn MathJax off. This feature requires Javascript. Click on a formula to zoom.
Abstract
The aim of this study was to determine the effect of eugenol on the integrity of the cell wall of Candida albicans. Minimum inhibitory concentration (MIC), minimum fungicidal concentration (MFC) and percentage inhibition of diameter growth (PIDG) of eugenol on C. albicans (ATCC 14053) were determined. The effect of eugenol on the growth profile was also evaluated. The release of cellular material and changes in cell permeability, including ultrastructural alterations to the morphology, were assessed using scanning electron microscopy, and surface disruption to the cell wall structure of C. albicans by atomic force microscopy. The MIC and MFC values of eugenol were found to be 1.0% v/v, while the PIDG was dose dependent. Eugenol influenced cell growth and was fungicidal towards C. albicans. Eugenol was also found to encourage cell leakage, causing the release of cellular material, and to increase cell permeability. The ultrastructure and cell surface morphology were also altered by the presence of eugenol. Thus, eugenol was found to disrupt the cell wall of C. albicans.
Introduction
Approximately 150–200 species are recognized in the genus Candida. Being an invasive opportunistic microorganism, Candida albicans is able to transform from a harmless commensal to a pathogen. This opportunistic fungus possesses many putative virulence traits that contribute to its survival and persistence within the host cell (Calderone & Fonzi Citation2001). Candida albicans accounts for 75% of fungal infections in humans. About 40% of healthy adults carry this species in the oral cavity (Jenkinson & Douglas Citation2002). Oral Candida species can lead to oral candidiasis and denture stomatitis (Kamagata-Kiyoura & Abe Citation2005; Liu et al. Citation2012). Oral candidiasis, commonly known as oral thrush, appears as creamy white or yellowish, crusty, curd-like patches with cracks in the corners of the mouth, lips, tongue, palate and buccal cheeks. Denture stomatitis is infection of the oral mucosa caused by fungus in areas covered by the denture. These oral diseases arise as a consequence of the invasive growth of mainly C. albicans, although other non-Candida albicans Candida species may also contribute to the pathogenesis of these diseases.
In general, the major component of the C. albicans cell wall is approximately 90% (w/w) carbohydrate, with 3–6% (w/w) proteins and 2% (w/w) lipids. Therefore, the cell wall of C. albicans is basically constituted of polysaccharides and proteinaceous materials in the ratio of 9:1. The cell wall is composed of a phospholipid bilayer, beta-glucans (both 1,3- and 1,6-linked), mannoproteins and a small quantity of chitin (Douglas Citation1987). The cell wall of C. albicans has attracted attention because of its involvement in adhesion, colonization, antigenic components and secreted products. Therefore, these compounds and the enzymes involved in their synthesis and degradation are potential targets for new antifungal agents.
For decades, plants have been known to contain many beneficial bioactive phytochemicals, making them important natural sources of remedies for various diseases. The analysis of bioactive compounds can provide valuable insights into the medicinal benefits of plants. Eugenol, a phenylpropene compound extracted from cloves, is widely used and has several pharmacological activities. It is naturally present as a clear to pale yellow oily liquid. In Malaysia, clove is locally known as bunga cengkih, which is popularly used in aromatherapy products and as a flavour enhancer in many dishes. Eugenol has been proven effective in combating several pathogens such as Salmonella typhi, Proteus mirabilis (Devi et al. Citation2010, Citation2013), Escherichia coli, Staphylococcus aureus, Pseudomonas aeruginosa (Walsh et al. Citation2003) and Listeria monocytogenes (Filgueiras & Vanetti Citation2006). It is also traditionally used as an instant remedy for toothache.
This study was carried out with the aim of determining the effects of eugenol on the integrity of the cell wall of C. albicans. This involved the evaluation of the antifungal activity of eugenol and determination of the effect of eugenol on the disruption of the cell wall structure of C. albicans.
Methods
Preparation of candidal strain
Candida albicans (ATCC 14053) used in this study was obtained from American Type Culture Collection (Manassas, USA). The lyophilized C. albicans was revived in yeast extract peptone dextrose (YEPD) broth (BD DifcoTM, New Jersey, USA) and incubated at 37°C for 24 h.
Preparation of standard candidal cell suspension
A standardized suspension of 1 × 10⁶ cells/ml of C. albicans was used throughout the experiment. The standardized suspension was prepared by taking a loopful of freshly grown C. albicans and dispensing it in 5 ml of YEPD broth. The turbidity of the suspension was adjusted and standardized spectrophotometrically at 550 nm to an optical density of 0.144, which is equivalent to 1 × 10⁶ cells/ml or to #0.5 McFarland standard.
Preparation of antifungal agent
Eugenol 99% (v/v) (Sigma-Aldrich, Missouri, USA) was purchased commercially, and stock solution of 30% (v/v) was prepared in absolute ethanol. Working concentrations of eugenol were prepared as 0.5%, 1.0%, 1.5%, 2.0% and 2.5% v/v from the stock solution, through a standard formula calculation of M1V1 = M2V2, where M1 is initial concentration, V1 is initial volume, M2 is final concentration and V2 is final volume.
Susceptibility test and determination of percentage inhibition of diameter growth
Sterile blank Whatman paper discs of 6 mm diameter (Oxoid, Hampshire, UK) were impregnated with eugenol concentrations of 0.5%, 1.0%, 2.0% and 2.5%. Amphotericin B was used as the positive control, while absolute ethanol served as the negative control. The sterile blank discs were impregnated with 30 µl of the various eugenol concentrations, including the positive and negative controls. The discs were air-dried at room temperature prior to placement on the agar surface, which had earlier been seeded by the swabbing method with 1 × 10⁶ cells/ml of C. albicans suspension. The air-dried discs were firmly placed on YEPD agar and incubated at 37°C for 24–48 h. The susceptibility of C. albicans to eugenol was determined by the diameter of the inhibited zone surrounding the discs. The experiment was performed in triplicate and carried out three times to ensure the reproducibility of the results. The diameter of inhibition zones of ethanol was deducted from all inhibition zones obtained for the various eugenol concentrations. This procedure was necessary because ethanol was used as the diluent for all working concentrations, and ethanol itself has the ability to inhibit the growth of C. albicans.
The percentage inhibition of diameter growth (PIDG) was evaluated following the antifungal susceptibility test. The susceptibility of C. albicans to eugenol was compared to amphotericin B as the positive control (Himratul-Aznita et al. Citation2011). PIDG values were determined according to the following equation:
A graph of PIDG values versus concentration of eugenol was then plotted.
Determination of minimum inhibitory concentration and minimum fungicidal concentration
The minimum inhibitory concentration (MIC) was measured by the broth microdilution method in 96-well microtitre plates (Nunc, Roskilde, Denmark) as described by Downes and Ito (Citation2001) and using YEPD broth. First, 100 µl of YEPD broth was dispensed into a microtitre plate, labelled well 1 (W1) to W10. Then, 100 μl of eugenol with 30% v/v concentration was added to W1. Two-fold serial dilution was carried out from W1 to W8. Amphotericin B (positive control) was added to W9 and ethanol (negative control) to W10. The plate was slowly agitated to mix the contents. The plate was incubated overnight at 37°C. The lowest concentration that inhibited fungal growth was considered as the MIC value. All determinations were performed in triplicate and carried out three times to ensure the reproducibility of the results.
The minimum fungicidal concentration (MFC) was determined by subculturing each well component that did not show visible indicator changes on fresh YEPD agar plates (Espinel-Ingrof et al. Citation2002). In brief, 50 µl of the suspension at the MIC value and the next two concentrations that did not indicate any turbidity were subcultured on to YEPD agar. The plates were incubated at 37°C for 18–24 h. The concentration at which no growth was observed was determined as the MFC. All determinations were performed in triplicate and carried out three times to ensure the reproducibility of the results.
Determination of growth profile of Candida albicans
A total of 1 × 10⁶ cells/ml of candidal suspension in YEPD broth was incubated in a shaking water bath at 37°C. Candidal growth was measured at 1 h intervals over a period of 18 h by measuring the turbidity at an optical density of 550 nm using a spectrophotometer (Shimadzu UV-160A; Shimadzu, Kyoto, Japan). The experiment was stopped once the stationary phase had been achieved. The growth of C. albicans was also determined based on the viable cell counts (colony-forming units, CFU). The cell suspension was serially diluted in phosphate-buffered saline (PBS) (Bio Basic, Markham, Canada), plated on to YEPD agar plates and incubated overnight at 37°C. To ensure reproducibility, the protocol was carried out in triplicate and repeated three times (Hafiz et al. Citation2012). The cell counts (CFU/ml) were determined and a graph of log10 CFU/ml versus incubation time was plotted. The results were interpreted as the mean of CFU/ml and standard deviation (SD).
Determination of growth-inhibitory response to eugenol
The rate of killing of C. albicans upon treatment with eugenol was assessed at eugenol concentrations of 0.5%, 1.0% and 2.0% v/v, while amphotericin B and ethanol were used as the positive and negative controls, respectively, in the experiment (Mitić-Ćulafić et al. Citation2005; Himratul-Aznita et al. Citation2011). One millilitre of each eugenol concentration was added to a candidal suspension of 1 × 10⁶ cells/ml in YEPD broth. The cultures were incubated in a water bath at 37°C with horizontal shaking. The cell growth was measured every 1 h over a period of 18 h. The suspension was then serially diluted before being spread evenly on YEPD agar and incubated overnight at 37°C. The visible cell counts (CFU/ml) were also determined. CFU/ml of cell growth was calculated, all data were recorded and a growth curve of log10 CFU/ml versus incubation time was plotted. The results were interpreted as the mean of CFU/ml and SD.
Release of cellular materials
The release of cellular materials from C. albicans cells treated with eugenol was assessed on aliquots of 1 × 10⁶ cells/ml candidal suspension. The measurement of the release of ultraviolet (UV)-absorbing cellular materials gives an index of cell lysis. The cellular material released can be assessed by two mean variables, i.e. concentration-dependent and time-course lysis. The procedures used to assess both variables were carried out at an absorbance wavelength of 260 nm, as suggested by Bennis et al. (Citation2004).
Effect of eugenol concentration on cell lysis
Cells were harvested by centrifugation at 400 × g for 15 min. The pellet was washed twice, then resuspended in PBS (pH 7.4), and was considered as the control of the experiment. To determine the influence of different concentrations of eugenol on the release of cellular materials, the cells were suspended for 2 h in PBS containing various concentrations of eugenol, i.e. 0.5%, 1.0% and 2.0% v/v.
Effect of time-course on cell lysis
In an experiment to determine the release of cellular materials due to time-course lysis, the cells were suspended in PBS containing 8% v/v of eugenol (8 × MIC) and treated for different lengths of time (0, 10, 20, 30, 40, 60 and 90 min).
Following both experiments, the cells were centrifuged at 12,000 × g for 2 min. Then, the absorbance of the supernatant was determined using a UV-spectrophometer at 260 nm.
Changes in cell permeability
The alteration in cell permeability was detected using a crystal violet assay (Devi et al. Citation2010). Cell suspensions of 1 × 10⁶ cells/ml C. albicans were prepared in YEPD broth. Cells were harvested by centrifugation at 4500 × g for 5 min at 4°C. The cells were then washed twice and resuspended in PBS (pH 7.4). Eugenol at concentrations of 0.5%, 1.0% and 2.0% v/v, and controls of amphotericin B and absolute ethanol, were added to the respective cell suspension tubes. Untreated cells, which acted as the experimental control, were also prepared as described above but without the addition of eugenol. Following incubation at 37°C for 30 min, the cells were harvested by centrifugation at 9300 × g for 5 min. The cells were then resuspended in PBS containing 10 µg/ml of crystal violet, and incubated for 10 min at 37°C. Finally, they were recentrifuged at 13400 × g for 15 min. The absorbances of the supernatant were measured using a spectrophotometer at an optical density of 550 nm (OD550). The percentage of crystal violet uptake of all samples was calculated using the following formula:
A graph of crystal violet uptake was then plotted for each sample treated at different eugenol concentrations.
Changes in ultrastructural features
To confirm the mode of action of eugenol on C. albicans, scanning electron microscopy (SEM) (Phillips, Tokyo, Japan) analysis was performed (Benli et al. Citation2008). An overnight broth culture of 1 × 10⁶ cells/ml C. albicans was prepared in YEPD broth. The cells were treated with eugenol concentrations of 0.5%, 1.0% and 2.0% v/v, and controls of amphotericin B and ethanol, for 3 h at 37°C before being harvested by centrifugation at 9300 × g for 25 min. Each pellet was then washed with PBS (pH 7.4). Following that, the pellet was fixed with 4% glutaraldehyde (Sigma-Aldrich, Missouri, USA) in phosphate buffer followed by fixing with 1.0% osmium tetraoxide (OsO4) (Merck, Darmstadt, Germany). The fixed cell pellet was then dehydrated in ascending ethanol concentrations of 30, 50, 70, 80, 90, 96 and 100% v/v for 15 min for each step. The cells were dried by critical point drying for about 1 h, mounted on to specimen stubs using double-sided carbon tape and coated with carbon before being examined under a scanning electron microscope (S-3000 H; Hitachi, Tokyo, Japan). The SEM observations were made at an accelerating voltage of 20 kV and a working distance of 10 mm. A control sample without eugenol treatment was also prepared and examined as described above.
Changes in cell surface morphology
The changes in cell morphology induced by eugenol were examined using atomic force microscopy (AFM) (Ambios Technology, California, USA) (Braga & Ricci Citation1998; Devi et al. Citation2010). An overnight culture of 1 × 10⁶ cells/ml of C. albicans was prepared in YEPD broth. The cultures were then treated with eugenol concentrations of 0.5%, 1.0% and 2.0% v/v for 6 h. The cells were harvested by centrifugation at 4500 × g for 5 min at 4°C and washed twice in PBS (pH 7.4). After that, the cells were fixed in PBS containing 2.5% glutaraldehyde for 2.5 h at 4°C. Fixed cells were washed and resuspended in PBS. Two microlitres of cell suspension was placed on a clean glass slide and examined under an atomic force microscope. Candida albicans without eugenol treatment was taken as the control in this analysis. All images were taken in contact mode using a microscope with a silicon nitride cantilever and a scanner with a maximum scanning range of 5 µm.
Statistical analysis
All data obtained were expressed as the mean ± SD from three determinations performed in triplicate (n = 9) and statistically analysed using SPSS software (version 17.0). Further statistical analysis using one-way analysis of variance and post-hoc Tukey's test was also performed for several tests.
Results
Determination of antifungal responses (MIC, MFC and PIDG)
Candida albicans showed sensitivity to all concentrations of eugenol used, with the appearance of inhibition zones after overnight incubation. The MIC and MFC of eugenol on C. albicans were determined as 1.0% v/v.
In this study, results obtained for the inhibition zones were incorporated into the formula for PIDG. These results are reflected in , which shows that the PIDG values of eugenol concentrations of 0.5%, 1.0%, 1.5% and 2.0% v/v were negative in reference to the PIDG of the positive control. In contrast, at 2.5% v/v, the concentration of eugenol was shown to have a positive value, indicating that at this concentration the antifungal activity was stronger than the positive control in preventing the growth of C. albicans.
Figure 1. Graph of percentage inhibition of diameter growth (PIDG) values versus concentration of eugenol on Candida albicans. All data are the means obtained from three sets of triplicate tests (n = 9).
Normal growth curve of Candida albicans
The normal growth curve of C. albicans cultured under untreated growth conditions is shown in . Under normal growth conditions, the lag phase of C. albicans was extended for about 2 h before the cells entered the log phase, and it was observed that the growth curve of untreated Candida exhibited a gradual increase in the log phase. The stationary phase of untreated C. albicans started after an incubation period of approximately 12 h, indicating no active cell division.
Figure 2. Graph of growth curve presented as log10 CFU/ml versus incubation time for Candida albicans treated with different concentrations of eugenol. Data are the mean ± SD of three determinations performed in triplicate (n = 9). AmB = amphotericin B.
Eugenol-treated growth inhibition of Candida albicans
The growth profile pattern of eugenol-treated C. albicans was altered and showed deviations from the untreated cells (). For the first 2 h of incubation, about 56.4% of the cells with sub-MIC eugenol treatment (0.5% v/v) survived. This population comprised almost half of the untreated cell populations. At 1.0% v/v eugenol treatment, the cell population was reduced by 58.3%. The strongest growth-inhibitory response was indicated by the greatest cell depletion, which was observed with 2.0% v/v eugenol treatment, where 87.4% of cells were reduced in the first 2 h incubation period. Both 1.0% and 2.0% v/v eugenol concentrations were able to completely kill all candidal cells at 12 h. Based on the growth pattern, the action of 0.5%, 1.0% and 2.0% v/v eugenol on C. albicans indicates a fungicidal effect.
Release of cellular material
The measurement of the release of UV-absorbing cellular materials provides an index of cell lysis. This measurement suggests that eugenol damages the cell wall structure of C. albicans and causes subsequent leakage of intracellular materials.
Effect of eugenol concentration on cell lysis
In an attempt to explain the cause of cell mortality, cells of C. albicans were lysed with a range of eugenol concentrations and evaluated by measuring the release of UV-absorbing substances at 260 nm. shows an increase in the release of cellular contents relative to the concentration of eugenol used. In addition, the results show that the release of UV-absorbing cellular material was accompanied by total cellular mortality when C. albicans was exposed to 8% v/v eugenol.
Table 1. Cellular material contents released at 260 nm after 2 h incubation with different eugenol concentrations.
Effect of time-course on cell lysis
To determine the median lethal time (LT50), where 50% of the C. albicans population was killed, the release of UV-absorbing cellular materials was measured at different time intervals at OD260. The percentage of cell lysis index was recorded periodically following exposure to eugenol. It was found that the shorter the time needed to kill 50% of the C. albicans population, the stronger the fungicidal potential of eugenol. These three different concentrations of eugenol exhibited a time-dependent effect, as shown in . With reference to , the LT50 of 2.0% eugenol is lower than that of 1.0% eugenol, from which it may be concluded that the time taken to kill the C. albicans cells may decrease as the concentration of eugenol increases.
Figure 3. Graph of cell lysis of Candida albicans treated with different concentrations of eugenol. Data are the mean ± SD of three determinations performed in triplicate (n = 9). LT50 = median lethal time.
Table 2. Median lethal time (LT50) following treatment with various concentrations of eugenol.
Changes in cell permeability of Candida albicans
The uptake of crystal violet by C. albicans in the absence of eugenol was used as the baseline reading. The percentage of crystal violet uptake reflects the cell membrane permeability of C. albicans. Results of the changes in cell permeability are shown in . The addition of 0.5% v/v eugenol caused C. albicans to increase the crystal violet uptake to about 2.6% compared with the untreated cells. Similarly, treatment with 1.0% and 2.0% v/v eugenol also resulted in increases in crystal violet uptake, of 6.29% and 14.56%, respectively. Treatment with 2.0% v/v eugenol indicated a similar effect on the cell permeability of C. albicans caused by the commercial antifungal amphotericin B. Statistical analysis showed that there were significant differences between these concentrations. These observations indicate that eugenol has the ability to increase the cell permeability of C. albicans. This experiment showed that the integrity of the cell wall structure was affected by eugenol. The higher intake of the crystal violet dye indicated greater damage to the cells.
Figure 4. Percentage of crystal violet uptake of Candida albicans. Data are the mean ± SD of three determinations performed in triplicate (n = 9). AmB = amphotericin B.
Changes in ultrastructural features
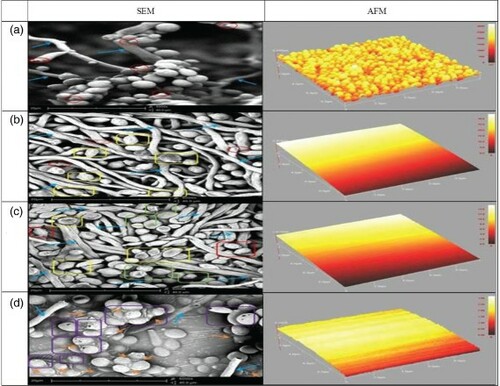
Changes in the ultrastructural features of C. albicans were observed using SEM. shows SEM images taken at 6000 × magnification, with scale bars of 50 µm. In the untreated cells, colonies were observed to be firm, with a round to oval shape and a well-developed structure. Most of the cells were also found to be in an active dividing state, with the presence of buds and bud scars. However, some physical and morphological alterations were observed in the cells of C. albicans treated with different concentrations of eugenol, as demonstrated in . Treatment with 0.5% v/v eugenol showed cells to have fewer buds and bud scars, indicating reduced cell division activity. Besides, a few hyphae and some cells were observed to be flaccid. Cells that were treated with 1.0% eugenol displayed irregular shapes along with frizzy outlines. Most hyphae and cells were observed to be flat and flaccid. Treatment with 2.0% v/v eugenol resulted in cells having pores on the cell surface. In addition, cells were surrounded by an extracellular matrix.
Figure 5. Scanning electron microscopy (SEM) at 6000 × magnification and atomic force microscopy (AFM) observations of (a) untreated Candida albicans, (b) C. albicans treated with 0.5% eugenol, (c) C. albicans treated with 1.0% eugenol, and (d) C. albicans treated with 2.0% eugenol. Buds and bud scars are indicated by (![]()
Alteration in cell surface morphology of Candida albicans
AFM was carried out to visualize the effect of eugenol on the cell surface morphology of C. albicans and to reveal the real roughness of the cell surface. The three-dimensional (3D) AFM images of untreated C. albicans show clusters of cells with smooth surface morphology, similar to the observations with SEM (). Since AFM is capable of providing a precise 3D map of the cell surface in the x, y and z dimensions on a submicrometre scale, the Z axis (Z height) value can be used to describe the effect of eugenol on C. albicans quantitatively. Significant variations in the Z height of untreated and treated eugenol cells are evident from the 3D images in . The Z heights of untreated C. albicans, and of C. albicans treated with eugenol concentrations of 0.5%, 1.0% and 2.0% v/v, were found to be 3.200 × 10³ nm, 3.420 nm, 1.572 nm and 0.318 × 10⁻¹ nm, respectively. The Z values of cells upon treatment with the various concentrations of eugenol were found to decrease as the concentrations of eugenol increased, indicating that the surface of cells had become thinner compared to the untreated C. albicans. This is in agreement with the SEM observation where the cells appeared flat and flaccid, with a lower proliferation rate, after being treated with eugenol with increasing concentrations. AFM analysis showed that eugenol can affect the surface roughness of C. albicans. Candida albicans treated with eugenol showed higher surface roughness in comparison to the untreated cells. The root mean square roughness (Rq) values for the untreated cells and the 0.5%, 1.0% and 2.0% v/v eugenol-treated cells were 3.212 × 10³ Å, 8.057 Å, 3.991 Å and 0.488 Å, respectively. Significant variations in the average roughness or deviation of the candidal cells were also found. The average roughness (Ra) for the untreated cells and the 0.5%, 1.0% and 2.0% v/v eugenol-treated cells were 1.698 × 10³ nm, 1.931 nm, 0.815 × 10⁻² nm and 0.720 × 10⁻² nm, respectively. The smaller value of the surface characteristic indicated a smooth surface topography. These results confirm the cell damage due to the treatment applied.
Discussion
This study showed that eugenol exhibited antifungal activity towards C. albicans with various degrees of inhibition. This finding is in agreement with the findings reported elsewhere that eugenol, a medicinal plant extract, exhibits antimicrobial activity towards several strains of pathogenic microorganisms (Devi et al. Citation2010). The MIC is the lowest concentration that inhibits the visible growth of a microorganism after an overnight incubation, while the MFC is the minimum concentration required to kill fungi (Espinel-Ingrof et al. Citation2002). Cell growth following an incubation period was observed by the appearance of a turbid suspension.
The MIC and MFC of eugenol towards C. albicans were both 1.0% v/v. The MIC and MFC values obtained in the study explain that eugenol acts as a fungicidal agent against C. albicans. Exposure of C. albicans to increasing eugenol concentrations resulted in drastic reductions in fungal growth. The results of this study showed that eugenol exhibited antifungal properties towards C. albicans and was concentration dependent, which is in agreement with a study by Himratul-Aznita et al. (Citation2011). In the present study, amphotericin B was chosen as the positive control as it has been commonly used as an antifungal in various in vitro assays against Candida species (Sandoval-Denis et al. Citation2014). Moreover, most Candida species have been found to be sensitive to amphotericin B (Zaoutis et al. Citation2005).
The growth-inhibitory response of C. albicans to eugenol was evaluated using a microdilution broth kinetic system, which was based on continuous monitoring of changes in the optical density of cell growth over time (Meletiadis et al. Citation2001). The values plotted were based on the spectrophotometric assay and colony-forming units (CFU). The cells were counted at 2 h intervals. Under normal growth conditions, the growth curves of the untreated C. albicans exhibited distinct log and stationary phases. This finding is in agreement with the observation by Pang et al. (Citation2011), who reported that the profile pattern of untreated C. albicans had a gradual increase in the log phase. However, with the presence of eugenol during growth, C. albicans showed deviation of the growth curves from the normal growth pattern. The presence of eugenol probably caused a decrease in the germination and elongation rates of C. albicans. The response of the cells in the growth curves indicates that eugenol has successfully suppressed the growth of cells and prevented the cells from proliferating actively. The cells were found to be unable to grow normally, indicating that eugenol had a fungicidal effect on C. albicans.
Further evaluation was carried out to ascertain the effect of eugenol against the cell wall component of C. albicans. The released cellular material was assessed by two mean variables, namely concentration-dependent and time-course lysis. This study showed that the release of cellular content increased relative to the concentration of eugenol used. Furthermore, this release was accompanied by total cellular mortality after the incubation period. Cellular material content from this assay is suggested to provide evidence of the cell damage caused by chemical and physical agents. The cytoplasmic membrane has also been recognized as a target for the action of eugenol (Oyedemi et al. Citation2009). Hence, it is possible that the presence of eugenol causes damage to the cell wall of C. albicans.
A complete loss of viability was observed with prolonged exposure to eugenol, indicating that the antifungal activity of eugenol is time dependent. The exposure time for C. albicans to be completely lysed in the presence of eugenol could elucidate the fungicidal mechanism of the antifungal due to cell damage. Eugenol demonstrates a capability to disintegrate the cell wall and further decrease its permeability, which subsequently causes cell death. Simultaneously, the release of cellular materials detected at 260 nm could lead to the conclusion that mortality is accompanied by cell lysis, as confirmed by Bennis et al. (Citation2004).
To elucidate the mechanism of action of eugenol, the ability of eugenol to damage the cell wall of C. albicans was further evaluated. Eugenol was found to disturb the cell wall integrity by increasing cell fluidity and permeability. This significant effect was obvious when the cells of C. albicans were treated with eugenol. The uptake of crystal violet by C. albicans was 7.19% in the absence of eugenol, but increased gradually with the addition of various eugenol concentrations, i.e. an increment of another 2.8% for cells treated with 0.5% eugenol, 6.3% for cells treated with 1.0% eugenol and 14.6% for cells treated with 2.0% eugenol compared with untreated C. albicans cells. It is difficult for crystal violet to penetrate the cell wall unless the cellular structure of the candidal cell is defective; therefore, this finding suggests that the candidal cell wall was ruptured by the presence of eugenol. It has also been reported that ergosterol, which forms part of the fungal cell, is the target site for antifungal agents to bind within the cell. The binding causes depolarization of the fungal cell and creates polar pores. This allows proteins and cations (monovalent and divalent protons) to leave the cell easily, and eventually causes a decrease in cell permeability which could lead directly to cell death (Devi et al. Citation2010). Eugenol is also capable of denaturing proteins and reacting towards the phospholipid bilayer of cell walls, thus altering their permeability. The antifungal activity of eugenol on C. albicans was further studied for its impact on the ultrastructure using SEM and AFM. The SEM images of untreated C. albicans showed a well-defined shape with normal smooth surfaces. This finding suggests that the untreated cells had attained their optimum size, with well-developed structures. The treated Candida cells were seen to be flat and flaccid, probably as a result of the change in hydroscopic turgor pressure inside the cells. This observation is in agreement with the study by Bergsson et al. (Citation2001). In addition, the cells were found to be smaller than the untreated cells. Moreover, greater damage from disruption of the cell wall was observed when higher concentrations of eugenol were used to treat C. albicans. Eugenol may have bound to the cell surface and penetrated the target sites, most probably the phospholipid bilayer of the cytoplasmic membrane. Therefore, the presence of eugenol may lead to the loss of structural integrity of the cell wall (Billerbeck et al. Citation2001).
The AFM image of the untreated cell surface of C. albicans showed clusters of cells, in agreement with the SEM observation. When the root mean square roughness (Rq) values and average roughness (Ra) values were compared, it was found that the untreated cells exhibited higher surface roughness compared to the eugenol-treated cells. This finding verifies that eugenol treatment has the ability to reduce the cell surface roughness (Tyagi & Malik Citation2010). In the present study, the impact of eugenol on the cell surface was illustrated by 3D images and verified by the Z height. It is suggested that the surface of treated cells was disturbed and ruptured by the presence of eugenol, as the Z height was higher in the non-exposed treatment cells than in treated cells. Decreased Z height and surface roughness (Rq and Ra) could indicate the reduction of the cell population. Thus, eugenol could be a potent antifungal agent, causing irreparable damage to the cells of C. albicans.
Disclosure statement
No potential conflict of interest was reported by the authors.
Additional information
Funding
Related Research Data
References
- Benli M, Yigit N, Geven F, Guney K, Bingol U. 2008. Antimicrobial activity of endemic Crataegus tanacetifolia (Lam.) Pers and observation of the inhibition effect on bacterial cells. Cell Biochem Funct. 26:844–851. doi: https://doi.org/10.1002/cbf.1515
- Bennis S, Chami F, Chami N, Bouchikhi T, Remmal A. 2004. Surface alteration of Saccharomyces cerevisiae induced by thymol and eugenol. Lett Appl Microbiol. 38:454–458. doi: https://doi.org/10.1111/j.1472-765X.2004.01511.x
- Bergsson G, Arnfinnsson J, Steingrimsson O, Thormar H. 2001. In vitro killing of Candida albicans by fatty acids and monoglycerides. Antimicrob Agents Ch. 45:3209–3212. doi: https://doi.org/10.1128/AAC.45.11.3209-3212.2001
- Billerbeck VG, De Roques CG, Besserie JM, Fonvieille JL, Dargent R. 2001. Effects of Cymbopogon nardusi (L.) W. Watson essential oil on the growth and morphogenesis of Aspergillus niger. Can J Microbiol. 47:9–17. doi: https://doi.org/10.1139/cjm-47-1-9
- Braga PC, Ricci D. 1998. Atomic force microscopy: application to investigation of Escherichia coli morphology before and after exposure to cefodizime. Antimicrob Agents Ch. 42:18–22.
- Calderone RA, Fonzi WA. 2001. Virulence factors of Candida albicans. Trends Microbiol. 9:327–335. doi: https://doi.org/10.1016/S0966-842X(01)02094-7
- Devi KP, Nisha SA, Sakthivel R, Pandian SK. 2010. Eugenol (an essential oil of clove) acts as an antibacterial agent against Salmonella typhi by disrupting the cellular membrane. J Ethnopharmacol. 130:107–115. doi: https://doi.org/10.1016/j.jep.2010.04.025
- Devi KP, Sakthivel R, Nisha SA, Suganthy N, Pandian SK. 2013. Eugenol alters the integrity of cell membrane and acts against the nosocomial pathogen Proteus mirabilis. Arch Pharm Res. 36:282–92. doi:https://doi.org/10.1007/s12272-013-0028-3
- Douglas LJ. 1987. Adhesion of Candida species to epithelial surfaces. Cr Rev Microbiol. 15:27–43. doi: https://doi.org/10.3109/10408418709104446
- Downes FP, Ito K. 2001. Compendium of methods for the microbiological examination of foods. 4th ed. Washington, DC: American Public Health Association Press.
- Espinel-Ingroff A, Forthergill A, Peter J, Rinaldi MG, Walsh T, Testing J. 2002. Conditions for determination of minimum fungicidal concentrations of new and established antifungal agents for Aspergillus spp.: NCCLS Collabrative Study. J Clin Microbiol. 40:3204–3208. doi: https://doi.org/10.1128/JCM.40.9.3204-3208.2002
- Filgueiras CT, Vanetti MCD. 2006. Effect of eugenol on growth and Listeriolysin O production by Listeria monocytogenes. Braz Arch Biol Technol. 49:405–409. doi: https://doi.org/10.1590/S1516-89132006000400008
- Hafiz A, Fathilah AR, Yusoff MM, Himratul-Aznita WH. 2012. Effect of phenotypic switching on the biological properties and susceptibility to chlorhexidine in Candida krusei ATCC14243. FEMS Yeast Res. 12:351–358. doi: https://doi.org/10.1111/j.1567-1364.2011.00786.x
- Himratul-Aznita WH, Mohd-Al-Faisal N, Fathilah AR. 2011. Determination of the percentage inhibition of diameter growth (PIDG) of Piper betle crude aqueous extract against oral Candida species. J Med Plants Res. 5:878–884.
- Jenkinson HF, Douglas LJ. 2002. Interactions between Candida species and bacteria in mixed infections. In Brogden KA, Guthmiller JM, editors. Polymicrobial diseases. Washington, DC: ASM Press; http://www.ncbi.nlm.nih.gov/books/NBK2486/http://www.ncbi.nlm.nih.gov/books/NBK2486/.
- Kamagata-Kiyoura Y, Abe S. 2005. Recent studies on oral candidiasis using a murine model. J Oral Biosci. 47:60–64. doi: https://doi.org/10.1016/S1349-0079(05)80009-X
- Liu X, Zheng X, Fang W, Zhang Y. 2012. Screening of food additives and plant extracts against Candida albicans in vitro for prevention of denture stomatitis. Procedia Environ Sci. 12:1361–1366. doi: https://doi.org/10.1016/j.proenv.2012.01.435
- Meletiadis J, Meis JFGM, Mouton JW, Verweij PE. 2001. Analysis of growth characteristics of filamentous fungi in different nutrient media. J Clin Microbiol. 39:478–484. doi: https://doi.org/10.1128/JCM.39.2.478-484.2001
- Mitić-Ćulafić D, Vuković-Gačić B, Knežević-Vukčević J, Stanković S, Simić D. 2005. Comparative study on the antibacterial activity of volatiles from sage (Salvia officinalis L.). Arch Biol Sci. 57:173–178. doi: https://doi.org/10.2298/ABS0503173M
- Oyedemi SO, Bradley G, Afolayan AJ. 2009. Ethnobotanical survey of medicinal plants used for the management of diabetes mellitus in the Nkonkobe municipality of South Africa. J Med Plants Res. 3:1040–1044.
- Pang SYM, Tristram S, Brown S. 2011. Inhibition of the growth of pathogenic Candida spp. by salicylhydroxamic acid. Int J Biol Life Sci. 7:1–7.
- Sandoval-Denis M, Pastor FJ, Capilla J, Sutton Da, Fothergill AW, Guarro J. 2014. In vitro pharmacodynamics and in vivo efficacy of fluconazole, amphotericin B and caspofungin in a murine infection by Candida lusitaniae. Int J Antimicrob Agents. 43:161–4. doi: https://doi.org/10.1016/j.ijantimicag.2013.10.024
- Tyagi AK, Malik A. 2010. In situ SEM, TEM and AFM studies of the antimicrobial activity of lemon grass oil in liquid and vapour phase against. Candida Albicans Micron. 41:797–805. doi: https://doi.org/10.1016/j.micron.2010.05.007
- Walsh SE, Maillard JY, Russell AD, Catrenich CE, Charbonneau DL, Bartolo RG. 2003. Activity and mechanisms of action of selected biocidal agents on Gram-positive and -negative bacteria. J Appl Microbiol. 94:240–247. doi: https://doi.org/10.1046/j.1365-2672.2003.01825.x
- Zaoutis TE, Foraker E, McGowan KL, Mortensen J, Campos J, Walsh TJ, Klein JD. 2005. Antifungal susceptibility of Candida spp. isolated from pediatric patients: a survey of 4 children's hospitals. Diagn MicrInfec Dis. 52:295–298. doi: https://doi.org/10.1016/j.diagmicrobio.2005.03.002