
ABSTRACT
Bioindicators are living organisms such as plants, planktons, animals, and microbes, which are utilized to screen the health of the natural ecosystem in the environment. They are used for assessing environmental health and biogeographic changes taking place in the environment. Each organic entity inside a biological system provides an indication regarding the health of its surroundings such as plankton responding rapidly to changes taking place in the surrounding environment and serving as an important biomarker for assessing the quality of water as well as an indicator of water pollution. Even the health of aquatic flora is best reflected by plankton, which acts as an early warning signal. In this review we have tried to explain the concept behind Bioindicators and plankton, with particular emphasis on their potential to be used as Bioindicators for water quality assessment and outcomes relating to this.
Introduction to Bioindicators
Naturally occurring Bioindicators are used to assess the health of the environment and are also an important tool for detecting changes in the environment, either positive or negative, and their subsequent effects on human society. There are a certain factors which govern the presence of Bioindicators in environment such as transmission of light, water, temperature, and suspended solids. Through the application of Bioindicators we can predict the natural state of a certain region or the level/degree of contamination (Khatri & Tyagi Citation2015). The advantages associated with using Bioindicators are as follows: (Figure )
Biological impacts can be determined.
To monitor synergetic and antagonistic impacts of various pollutants on a creature.
Early stage diagnosis as well as harmful effects of toxins to plants, as well as human beings, can be monitored.
Can be easily counted, due to their prevalence.
Economically viable alternative when compared with other specialized measuring systems.
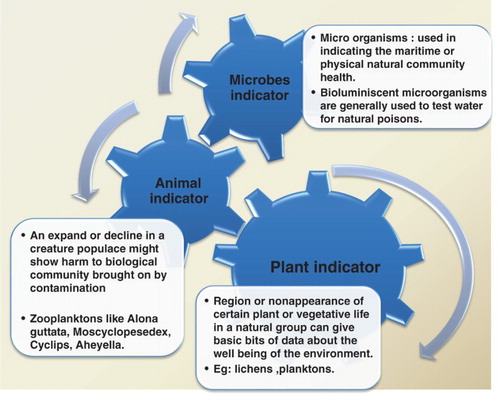
Figure 1. Types of Bioindicator.
Utilization of Bioindicators
The expression ‘Bioindicator’ is used as an aggregate term referring to all sources of biotic and abiotic reactions to ecological changes. Instead of simply working as gauges of natural change, taxa are utilized to show the impacts of natural surrounding changes, or environmental change. They are used to detect changes in natural surroundings as well as to indicate negative or positive impacts. They can also detect changes in the environment due to the presence of pollutants which can affect the biodiversity of the environment, as well as species present in it (Walsh Citation1978; Peterson Citation1986; Gerhardt Citation2002; Holt & Miller Citation2010). The condition of the environment is effectively monitored by the use of Bioindicator species due to their resistance to ecological variability. Hasselbach et al. utilized the moss i.e. Hylocomium splendens as a natural indicator of heavy metals in the remote tundra environment of northwestern Alaska. Here, the ore of mineral is mined from Red Dog Mine, the world’s largest creator of zinc (Zn), and is carried to a singular street (∼75 km long) to storage spaces on the Chukchi Sea. Hasselbach and her partners inspected whether this overland transport was influencing the encompassing physical biota. The contents of heavy metals inside the moss tissue were analyzed at different distances from the street. The concentrations of metals in moss tissue were most prominently adjacent to the haul street and reduced with distance, therefore supporting the theory that overland transport was in fact modifying the encompassing environment. In this study, lichens were utilized as biomonitors by utilizing the quantitative estimation of metal concentrations inside individual lichen (Walsh Citation1978; Peterson Citation1986; Holt & Miller Citation2010; Thakur et al. Citation2013).
Natural, biological, and biodiversity markers can be found in various organisms occupying different types of environments. Lichens (a symbiosis among Cyano bacteria, algae, and/or fungi) and Bryophytes (liverworts) are frequently used to monitor air contamination. Both, Lichens and Bryophytes are powerful Bioindicators of air quality on the grounds that they have no roots, no fingernail skin, and acquire all their supplements from immediate introduction to the climate. Their high surface region to volume ratio further supports the theory of their use as a bioindicator, or supports their ability to capture contaminates from the air (Holt & Miller Citation2010). Cynophyta, a type of phytoplankton, is one particularly powerful bioindicator which is known to indicate rapid eutrophication of water bodies such as reservoirs, lakes, etc. via the creation of bloom formations (Walsh Citation1978; Thakur et al. Citation2013). The various types of bioindicator and their applications are as follows:
Types of bioindicators
Bioindicators are presently utilized and promoted by various organizations (the World Conservation Union, International Union for Conservation of Nature), as a means to handle biomonitoring and evaluate human effects (Figures and ).
Figure 2. Sub-types of Bioindicators.
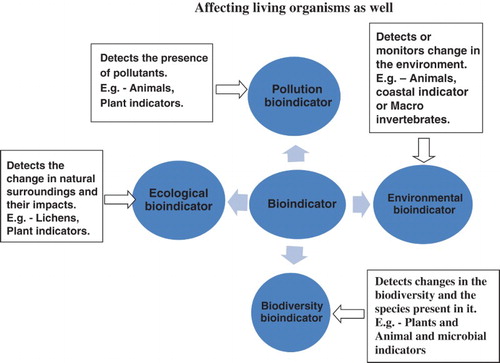
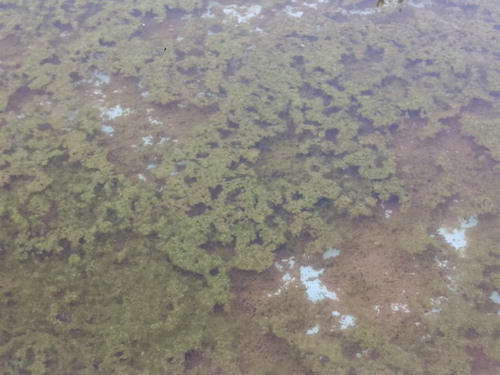
Figure 3. Algal bloom in stagnant water.
Plant indicators
Plants are used as very sensitive tools for prediction and recognition of environmental stresses. In recent time, due to industrialization and urbanization the problem of contamination of water and water pollution has intensified (Batiuk et al. Citation1992; Joanna Citation2006). Marine plants provide valuable information to predict the status of oceanic environment, as they are immobile and rapidly obtain equilibrium with their natural surrounding (Plafkin et al. Citation1989; Klemm Citation1990; McDonald et al. Citation1990; Kennish Citation1992; Mitchell & Stapp Citation1992; Phillips & Rainbow Citation1993; De Lange Citation1994; Jain et al. Citation2010).The presence or absence of some specific plants or other vegetation provides ample information about environmental health. Lichens generally found on the trunks of trees and rocks are composed of algae and fungi both. They react to ecological changes in forests, including changes in the structure of the forest, air quality, and climate. Environmental stress can be indicated by the disappearance of lichen in forests, as caused by changes such as increases in the level of sulfur dioxide (SO2), pollutants of sulfur and nitrogen (N2) (Walsh Citation1978; Peterson Citation1986; Gerhardt Citation2002; Holt & Miller Citation2010; Khatri & Tyagi Citation2015). Wolffia globosa is an important tool for showing cadmium sensitivity and also used for indicating cadmium contamination. Changes in the diversity of species of phytoplankton, including Euglena clastica, Phacus tortus, and Trachelon anas, indicate the pollution of marine ecosystems (Plafkin et al. Citation1989; Mitchell & Stapp Citation1992; Phillips & Rainbow Citation1993; Jain et al. Citation2010).
Animal indicators
Variations in the populations of animals may indicate harmful changes caused due to pollution into the ecosystem. Changes in the population density may indicate negative impacts to the ecosystem. Changes in populations may be a result of the relationship between populations and food sources; if food resources become scarce and cannot provide for the population demand reduction of said population will follow (Plafkin et al. Citation1989; Phillips & Rainbow Citation1993; Jain et al. Citation2010). Animal indicators also help in detecting the amount of toxins present in the tissues of animals (Joanna Citation2006; Khatri & Tyagi Citation2015). Frogs are also Bioindicators of quality of environment and changes in environment. Frogs are basically influenced by changes that take place in their freshwater and terrestrial habitats. This makes them important Bioindicators of ecological quality and change. Zooplanktons like Alona guttata, Mesocyclops edax, Cyclops, Aheyella are zone-based indicators of pollution (Underwood & Shapiro Citation1999; Hans et al. Citation2003; Jha & Barat Citation2003; Ramchandra et al. Citation2006; Pradhan et al. Citation2008; Zannatul & Muktadir Citation2009; Jain et al. Citation2010; Nkwoji et al. Citation2010; Hosmani Citation2014).
Invertebrates can also be Bioindicators; aquatic invertebrates tend to be bottom feeders (also known as Benthos or macro invertebrates), living near the bottom of water bodies. These types of Bioindicators may be particularly powerful indicators of watershed health as they are not difficult to distinguish in a lab, frequently live for more than one year, have restricted mobility, and are integrators of ecological condition (Plafkin et al. Citation1989; Khatri & Tyagi Citation2015).
Microbial indicators
Microorganisms are often used as health indicators of aquatic and terrestrial ecosystems. Due to their abundance, they are easy to test and readily available. Some microorganisms when exposed to cadmium and benzene contaminants develops new proteins known as stress proteins which can be used as early warning signs (Khatri & Tyagi Citation2015). Microorganisms are an important part of oceanic biomass and are responsible for the majority of productivity and nutrient cycle in a marine ecosystem. Microorganisms have a rapid rate of growth, and react to even low levels of contaminants and other physicochemical and biological changes. From a research perspective they give important signs of environmental change (Underwood & Shapiro Citation1999; Gerhardt Citation2002; Hans et al. Citation2003; Jha & Barat Citation2003; Markert et al. Citation2003; Ramchandra et al. Citation2006; Pradhan et al. Citation2008; Zannatul & Muktadir Citation2009; Nkwoji et al. Citation2010; Hosmani Citation2014). Microbial indicators can be used in a variety of ways to detect environmental pollutants in water including the use of bioluminescent bacteria. The presence of toxins in waters can be easily monitored either by changes in the digestion system of microbes which is hindered or disturbed by the presence of toxins which may result in changes in the amount of light emitted by the bacteria (Arora Citation1966; Grizzle Citation1984; Butterworth et al. Citation2001; Uttah et al. Citation2008). In comparison to other available traditional tests, these tests are very quick to monitor; however, their limitation is they can only indicate the changes in the organisms due to presence of toxins (Malik & Bharti Citation2012; Khatri & Tyagi Citation2015). One such example is the bacterium Vogesella indigofera which reacts to heavy metals quantitatively. Under the influence no metal pollution, this bacterium produces blue pigmentation which is an important marker of morphological change that has taken place which can be effectively observed visually. Alternatively, under the vicinity of hexavalent chromium, the production of pigment is blocked. This pigment production can be attributed due to the relationship between concentration of chromium and the generation of blue pigmentation by the bacterium (Arora Citation1966; Grizzle Citation1984; Paoletti Citation1999; Oberholster et al. Citation2009; Jain et al. Citation2010; Aslam et al. Citation2012; Malik & Bharti Citation2012).
Biomonitoring
Bio-organisms are basically used to define the characteristics of a biosphere. These organisms are known as Bioindicators or biomonitors, both of which may vary considerably (Purdy Citation1926; Mohapatra & Mohanty Citation1992; Gaston Citation2000; Lilian Citation2009; Offem et al. Citation2011). When studying the environment the quality of changes taking place can be determined by Bioindicators while biomonitors are used to get quantitative information on the quality of the environment biological monitoring also incorporating data regarding past aggravations and the impacts of various variables (Noss Citation1990; Gaston Citation2000; Chakrabortty & Paratkar Citation2006).
Monitoring can be done for various biological processes or systems with the objective of observing the temporal and spatial changes in health status, assessing the impacts of specific environment or anthropogenic stressors and assessing the viability of anthropogenic measures (e.g. reclamation, remediation, and reintroduction) (Lund Citation1969; Cairns et al. Citation1993; Niemi et al. Citation1997; Burger & Gochfeld Citation2001; Mahadev & Hosmani Citation2004; Pandey & Verma Citation2004; Hosmani Citation2013). The species diversity is used as a prime aspect in biological monitoring, which is considered to be a valuable parameter in determining the health of the environment (Marques Citation2001; Joanna Citation2006). Biomonitoring is one of the essential components for assessing the quality of water and has become an integral element of conducting studies on water pollution (Vitousek et al. Citation1997; Butterworth et al. Citation2001). Biomonitors are freely available all around the world. They fundamentally mirror the natural impact over creatures and can be used and understood with minimum preparation and training (Reynolds Citation1984; Burger Citation1993; Green Citation1993; Siddiqui & Chandrasekhar Citation1996; Chorus & Bertram Citation1999; Carignan & Villard Citation2001; Nájera et al. Citation2002; Kumari et al. Citation2007; Fadila et al. Citation2009). Despite the fact that all natural species can be considered biomonitors to some degree, the above focal points applies well to planktons and similar species type, when water pollution is considered (Singh et al. Citation2013).
Planktons
In many water bodies, such as, seas, lakes, streams, and swamps, significant biological production is carried out by plankton. Planktons are composed of organisms with chlorophyll (i.e. phytoplankton and animals such as zooplanktons). These planktons consist of communities that float along currents and tides, yet they fuse and cycle important quantities of energy that is then passed on to higher trophic levels (Walsh Citation1978).
Indian lentic ecosystems were researched for planktons amid the mid-twentieth century. These studies demonstrated that the predominant planktons and their regularity are exceptionally variable in diverse water bodies relying upon their supplement status, age, morphometry, and other location variables. Hence, they are also used as indicators of the trophic state of lakes (Thakur et al. Citation2013). Planktons react rapidly to ecological changes and are viewed as excellent indicators of water quality and trophic conditions due to their short time and rapid rate of reproduction. Under natural conditions, the occurrence of planktonic organisms is identified with the resistance range in relation to abiotic ecological components (Temperature, Oxygen fixation, and pH) as well as the biotic connections among organisms. The changes that occur within the communities of planktons provide the platform to determine the trophic state of water bodies (Pradhan et al. Citation2008) (Figure ).
Figure 4. Flow chart of planktons indicating pollution (lake condition).
Planktons as an indicator of water pollution
Since planktons are profoundly sensitive to natural change they are best markers of water quality and particularly lake conditions. One of the reasons planktons are being considered in lakes is to monitor the water quality of the lake when there are high centralizations of phosphorus and nitrogen; these centralizations may be indicated by certain planktons reproducing at an increased rate. This is evidence of poor water quality that may influence other organisms living in the water body. In addition to being a health indicator, planktons are also the fundamental sustenance for many larger organisms in the lake. Thus the plankton is key to the marine organisms, as both an indicator of water quality and as the main food source for many fish (Thakur et al. Citation2013).
Plankton also plays an important role in biological deterioration organic matter; but if plankton populations are too large this creates other problems in managing the water body. Fish at this critical stage of ecological process play an important role by grazing the planktons. The two roles played by fish are very crucial as they help in maintaining the proper balance of planktons in the pond and convert the nutrient available in wastewater into a form which is consumable by humans. Additionally, certain planktons such as cyanobacteria produce toxins which are harmful for fish growth. Thus planktons can be termed as useful or harmful, with respect to wastewater fed production of fishes (Pradhan et al. Citation2008) (Tables and ).
Table 1. Types of phytoplankton and its indications.
Table 2. Types of zooplanktons and its indications.
Phytoplankton
Phytoplanktons, also known as microalgae, are similar to terrestrial plants in that they contain chlorophyll and require daylight to live and develop. Most are light and swim in the upper portion of the sea, where light infiltrates the water. Development and photosynthesis are closely related, each one being a function of usage of light and food supplements. Algae are quite sensitive to contamination, and this may be reflected in their population levels and/or rates or photosynthesis Affects development of population or photosynthesis, for the most part, algae are as sensitive to contaminations as other species. When there is change in the diversity of phytoplankton species, it may indicate pollution of the marine ecosystem (Walsh Citation1978; Hosmani Citation2014).
Evidences pertaining to phytoplankton
Phytoplanktons have been used for successful observation of water contamination and are a useful indicator of water quality. (Fjerdingstad Citation1964; Williams Citation1964; Kingsbury & Sze Citation1972; Staker et al. Citation1974). In 1975, Dugdale depicted the relationship of the growth rate of an algal population, photosynthesis, and nutrient concentration in the water body. Contaminations can influence the connection between rate of growth and each of these variables. For example, if there is an industrial effluent which is colored or contains suspended solids light may be filtered or absorbed causing a reduction in rate of growth. Macisaacand and Dugdale in 1976 showed that a decrease of light leads to decrease in rate of uptake of ammonia and nitrate in marine phytoplankton (Walsh Citation1978).
Overnell et al. demonstrated that light prompted oxygen evolution from the freshwater species Chlamydomonas reinhardtii was sensitive to cadmium, methyl mercury, and lead. Moore et al. discovered that organo-chlorine compounds decrease use of bicarbonate by estuarine phytoplankton. Whitacre et al. also produced significant research on the effect of numerous chlorinated hydrocarbons on fixation of carbon by phytoplankton (Walsh Citation1978). Phytoplanktons are also an important source of pollutant transfer from water to upper tropic levels and even to humans. Algae are unable to decompose the pesticides and are thus a link of transfer to herbivores when fed upon. Substances gathering and intake plays an important role in pollution dynamics of phytoplankton. If light is obstructed, it hampers the intake of ammonia and nitrate by aquatic phytoplankton as indicated by Mac Isaac and Dugdale, especially when the industrial colored or solid suspended waste accumulates on the water surface which results in reduction of growth rate, filtrations, and absorption of light (Walsh Citation1978).
Zooplanktons
Zooplanktons are microscopic animals living near to the surface of the water body. They are poor swimmers, instead relying on tides and currents as a transport mechanism. They feed upon phytoplanktons, bacterioplanktons, or detritus (i.e. marine snow). Zooplanktons constitute a vital food source for fish. They also play an important role as Bioindicators and help to evaluate the level of water pollution. In freshwater communities, along with fish, they are the main food supplement to many other marine species (Walsh Citation1978). They are assumed to be a vital part in indicating water quality, eutrophication, and production of a freshwater body. In order to determine the status of a freshwater body it is necessary to measure seasonal variations and presence of zooplanktons (Zannatul & Muktadir Citation2009). Differing varieties of species, biomass diversity and wealth of zooplankton groups can be utilized to determine the strength of a biological system. The potential of zooplankton as a bioindicator species is high on the grounds that their development and conveyance are subject to some abiotic (e.g. temperature, saltiness, stratification, and pollutants) and biotic parameters (e.g. limitation of food, predation, and competition) (Ramchandra et al. Citation2006).
Evidences pertaining to zooplanktons
Mechanical fermentation brought on a reduction in the quantity of species and changes in species strength, both of which were influenced as pH decreased from 7.0 to 3.8. Jha and Barat completed research on Lake Mirik, in Darjeeling, Himalayas, on zooplankton. This lake was polluted due to toxins let into the lake from outer sources resulting in a decreased pH in the lake and an increased acidity level (Jha and Barat Citation2003). This was confirmed by the investigation of other physiochemical parameters and planktons. In this condition, cladocerans (Bosmina, Moina, and Daphnia) and copepods (Phyllodiaptomus and cylops the most extensive copepods) were found. This examination presumed that the lake cannot be utilized as a deficit for the supply of drinking water and these organisms served as a bioindicator to focus on the wellbeing of this oceanic body. As indicated by Siddiqi and Chandrasekhar, trichotria tetrat is could be utilized as contamination indicators as they were seen in the lake which was rich in phosphorus and other heavy metal particle. This species was obtained in the past in sewage-contaminated tanks (Zannatul & Muktadir Citation2009). Phosphorous and metal particle as well as high aggregate alkanity, hardness, and high conductivity (130 ms m−1) of the lake water were restricting components for the development of zooplankton (Ramchandra et al. Citation2006).
Zooplankton may be present in an extensive variety of ecological conditions. Yet disintegrated oxygen, temperature, salinity, pH, and other physicochemical parameters are restricting elements. The vicinity of three types of Brachionussp indicates that the lake is being eutrophicated and is naturally contaminated (Zannatul & Muktadir Citation2009). There is variation in the population of copepods, seasonally in various water bodies present in different parts of India; the seasonal studies of zooplanktons showed that the zooplanktons’ density was highest in the rainy season, while it reduced in summers due to high temperatures. Copepods form the dominant group of all the zooplanktons, followed by Cladocera, rotifer, and Ostrocoda. Ultimately, zooplankton has been found to be excellent an Bioindicator to evaluate the contamination of anyoceanic bodies (saltwater) (Zannatul & Muktadir Citation2009).
Conclusion
The many-fold advantages of Bioindicators have outweighed their restrictions. The bioindicator is helpful, objective, straightforward, and reproducible. Bioindicators can be utilized at various scales, from the cell to the environmental level, for assessing the changes taking place in a specific biological community. Planktonic monitors unite biological, physical, chemical factors, and are utilized as an important part for evaluating health status of water bodies. The conclusion can be drawn that bioindication and biomonitoring have become promising methods for studying the impacts of external factors on an ecosystem and its development and for differentiating polluted and unpolluted areas.
Disclosure statement
No potential conflict of interest was reported by the authors.
References
- Arora HC. 1966. Rotifer as indicators of trophic nature of environments. J Hydrobiologia. 27(1–2):146–159. doi: 10.1007/BF00161493
- Aslam M, Verma DK, Dhakerya R, Rais S, Alam M, Ansari FA. 2012. Bioindicator: a comparative study on uptake and accumulation of heavy metals in some plant′s leaves of M.G. Road, Agra City, India. Res J Environ Earth Sci. 4(12):1060–1070.
- Batiuk RA, Orth RJ, Moore KA, Dennison WC, Stevenson JC, Staver LW, Carter V, Rybicki NB, Hickman RE, Kollar S, Bieber S, Heasly P. 1992. Chesapeake Bay submerged aquatic vegetation habitat requirements and restoration targets: a technical synthesis. Annapolis (MD): Chesapeake Bay Program. Vol. 83/92; p. 166–169.
- Burger J. 1993. Metals in avian feathers: bioindicators of environmental pollution. Rev Environ Toxicol. 5:203–311.
- Burger J, Gochfeld M. 2001. On developing bioindicators for human and ecological health. Environ Monit Assess. 66:23–46. doi: 10.1023/A:1026476030728
- Butterworth FM, Gunatilaka A, Gonsebatt ME. 2001. Biomonitors and biomarkers as indicators of environmental change, volume 2. Boston (MA): Springer Science & Business Media.
- Cairns J, McCormick PV, Niederlehner BR. 1993. A proposed framework for developing indicators of ecosystem health. Hydrobiologia. 263:1–44. doi: 10.1007/BF00006084
- Carignan V, Villard MA. 2001. Selecting indicator species to monitor ecological integrity: a review. Environ Monit Assess. 78:45–61. doi: 10.1023/A:1016136723584
- Chakrabortty S, Paratkar GT. 2006. Biomonitoring of trace element air pollution using mosses. Aerosol Air Qual Res. 6:247–258.
- Chorus I, Bertram J. 1999. Toxic cyanobacteria in water. London: World Health Organization Publication, E and FN Spon.
- Fadila K, Houria D, Rachid R, Mohammed D. 2009. Reda cellular response of a pollution bioindicator model (ramalinafarinacea) following treatment with fertilizer (NPKs). American-Eurasian J Toxicol Sci. 1(2):69–73.
- Fjerdingstad E. 1964. Pollution of streams estimated by benthal phytomicro-organisms, I. Seprobic system based on communities of organisms and ecological factors. Int Rev Ges Hydrobiol. 49:63–131. doi: 10.1002/iroh.19640490103
- Gaston KJ. 2000. Biodiversity: higher taxon richness. Prog Phys Geogr. 24:117–127. doi: 10.1177/030913330002400108
- Gerhardt A. 2002. Bioindicator species and their use in biomonitoring. Environmental monitoring I. Encyclopedia of life support systems. UNESCO ed. Oxford (UK): Eolss Publisher.
- Green J. 1993. Diversity and dominance in planktonic rotifers. Hydrobiologia. 255(256):345–352. doi: 10.1007/BF00025859
- Grizzle RE. 1984. Pollution indicator species of macro benthos in a coastal lagoon. Mar Ecol Prog Ser. 18:191–200. doi: 10.3354/meps018191
- Hans W, Dyble PJ, Moisander PH, Noble RT, Piehler MF, Pinckney JL, Steppe TF, Twomey L, Valdes LM. 2003. Microbial indicators of aquatic ecosystem change: current applications to eutrophication studies. FEMS Microbiol Ecol. 46:233–246. doi: 10.1016/S0168-6496(03)00200-9
- Holt EA, Miller SW. 2010. Bioindicators: using organisms to measure environmental impacts. Nature. 3(10):8–13.
- Hosmani SP. 2013. Freshwater algae as indicators of water quality. Univers J Environ Res Technol. 3(4):473–482.
- Hosmani S. 2014. Freshwater plankton ecology: a review. J Res Manage Technol. 3:1–10. doi: 10.1016/j.jmrt.2014.02.001
- Jain A, Singh BN, Singh SP, Singh HB, Singh S. 2010. Exploring biodiversity as bioindicators for water pollution. National Conference on Biodiversity, Development and Poverty Alleviation; 2010 May 22, Uttar Pradesh. Lucknow (India): Uttar Pradesh State Biodiversity Board.
- Jha P, Barat S. 2003. Hydrobiological study of Lake Mirik in Darjeeling, Himalayas. J Environ Biol. 24:339–344.
- Joanna B. 2006. Bioindicators: types, development, and use in ecological assessment and research. Environ Bioind. 1:22–39. doi: 10.1080/15555270590966483
- Kennish MJ. 1992. Ecology of estuaries: anthropogenic effects. Boca Raton (FL): CRC Press; p. 494.
- Kingsbury JM, Sze P. 1972. Distribution of phytoplankton in a polluted saline lake. Onondaga Lake, New York. J Phycol. 8:25–37.
- Klemm DJ. 1990. Macro invertebrate field and laboratory methods for evaluating the biological integrity of surface waters. Cincinnati (OH): EPA.
- Khatri N, Tyagi S. 2015. Influences of natural and anthropogenic factors on surface and groundwater quality in rural and urban areas. Front Life Sci. 8(1):23–39. doi: 10.1080/21553769.2014.933716
- Kumari P, Dhadse S, Chaudhari PR, Wate SR. 2007. Bioindicators of pollution in lentic water bodies of Nagpur city. J Environ Sci Eng. 49(4):317–324.
- De Lange E. 1994. Manual for simple water quality analysis. Amsterdam: International Water Tribunal (IWT) Foundation.
- Lilian B. 2009. A new tool for water quality assessment – algae as bioindicators. California’s surface water ambient monitoring program.
- Lund JWG. 1969. Phytoplankton in eutrophication: causes, consequences, correctives. Natl Acad Sci. 661:306–330.
- Mahadev J, Hosmani SP. 2004. Community structure of cyanobacteria in two polluted lakes of Mysore city. Nat Env Pollut Technol. 3(4):523–526.
- Malik DS, Bharti U. 2012. Status of plankton diversity and biological productivity of Sahastradhara stream at Uttarakhand, India. J Appl Natural Sci. 4(1):96–103.
- Markert BA, Breure AM, Zechmeister HG. 2003. Chapter 1 definitions, strategies and principles for bioindication/biomonitoring of the environment. Trace Metals Other Contam Environ. 6:3–39. doi: 10.1016/S0927-5215(03)80131-5
- Marques JC. 2001. Diversity, biodiversity, conservation, and sustainability. Sci World J. 1:534–543. doi: 10.1100/tsw.2001.101
- McDonald B, Borden W, Lathrop J. 1990. Citizen stream monitoring, a manual for Illinois. Springfield (IL): Illinois Department of Energy and Natural Resources.
- Mitchell MK, Stapp WB. 1992. Field manual for water quality monitoring, an environmental education program for schools. Ann Arbor (MI): Green.
- Mohapatra PK, Mohanty RC. 1992. Determination of water quality of the water bodies using algal bioassay method. Phykos. 31:77–84.
- Nájera JM, González MI, Rossi MR, Méndez VH. 2002. New method to assess air pollution using lichens as bioindicators. Rev Biol Trop. 50(1):321–325.
- Niemi GJ, Hanowski JM, Lima AR, Nicholls T, Weiland N. 1997. A critical analysis on the use of indicator species in management. J Wildlife Manage. 61:1240–1252. doi: 10.2307/3802123
- Nkwoji JA, Igbo JK, Adeleye AO, Obienu JA, Tony-Obiagwu MJ. 2010. Implications of bioindicators in ecological health: study of a coastal lagoon, Lagos, Nigeria. Agric Biol J Noth Am. 1(4):683–689.
- Noss RF. 1990. Indicators for monitoring biodiversity: a hierarchical approach. Conserv Biol. 4:355–364. doi: 10.1111/j.1523-1739.1990.tb00309.x
- Oberholster PJ, Botha A, Ashton PJ. 2009. The influence of a toxic cyanobacterial bloom and water hydrology on algal populations and macroinvertebrate abundance in the upper littoral zone of Lake Krugersdrift, South Africa. Ecotoxicology. 18(1):34–46. doi: 10.1007/s10646-008-0254-5
- Offem BO, Ayotunde EO, UjongIkpi G, Ada FB, NchaOchang S. 2011. Plankton-based assessment of the trophic state of three tropical lakes. J Environ Protect. 2:304–315.
- Pandey J, Verma A. 2004. The influence of catchment on chemical and biological characteristics of two freshwater tropical lakes of Southern Rajasthan. J Environ Biol. 25:81–87.
- Paoletti MG. 1999. Using bioindicators based on biodiversity to assess landscape sustainability. Agric Ecosyst Environ. 74:1–18. doi: 10.1016/S0167-8809(99)00027-4
- Peterson WT. 1986. The effects of seasonal variations in stratification on plankton dynamics in Long Island Sound. In: Bowman MJ, Yentsch CM, Peterson WT, editors. Tidal mixing and plankton dynamics. Berlin: Springer-Verlag. Vol. 17 Lecture Notes in Coastal and Estuarine Studies; p. 225–319. doi:10.1007/978-1-4612-4966-5_11.
- Phillips DJH, Rainbow PS. 1993. Biomonitoring of trace aquatic contaminants. New York (NY): Elsevier Applied Science.
- Plafkin JL, Barbour MT, Porter KD, Gross SK, Hughes RM. 1989. Rapid assessment protocols for use in streams and rivers: benthic macroinvertebrates and fish. Washington (DC): EPA. Rosenberg DM, Resh VH, editors. Freshwater biomonitoring and benthic macroinvertebrates. New York (NY): Chapman &Hall.
- Pradhan A, Bhaumik P, Das S, Mishra M, Khanam S, Hoque BA, Mukherjee I, Thakur AR, Chaudhuri SR. 2008. Phytoplankton diversity as indicator of water quality for fish cultivation. Am J Environ Sci. 4(4):406–411. doi: 10.3844/ajessp.2008.406.411
- Purdy WC. 1926. The biology of rivers in relation to pollution. J Am Water Works Assoc. 16(1):45–54.
- Ramchandra TV, Rishiram R, Karthik B. 2006. Zooplanktons as bioindicators: hydro biological investigation in selected Bangalore lakes. Technical report 115.
- Reynolds CS. 1984. The ecology of freshwater plankton. Cambridge: Cambridge University Press; p. 384.
- Siddiqui SZ, Chandrasekhar SVA. 1996. New distribution record of trichotriatetractis (rotatoria/trichotridae) and daphnia lumholtzi (brachiopoda/cladocera/daphnidae) from Kolleru lake andhra Pradesh with notes on indicator value. J Bom Nat Hist Soc. 93:309–310.
- Singh UB, Ahluwalia AS, Sharma C, Jindal R, Thakur RK. 2013. Planktonic indicators: a promising tool for monitoring water quality (early-warning signals). Eco Environ Cons. 19(3):793–800.
- Staker RD, Hoshaw RW, Everett LG. 1974. Phytoplankton distribution and water quality indices for lake mead (Colorado River). J Phycol. 10:323–331.
- Thakur RK, Jindal R, Singh UB, Ahluwalia AS. 2013. Plankton diversity and water quality assessment of three freshwater lakes of Mandi (Himachal Pradesh, India) with special reference to planktonic indicators. Environ Monit Assess. 185(10):8355–8373. doi: 10.1007/s10661-013-3178-3
- Underwood DLA, Shapiro AM. 1999. Evidence for division of labor in the social caterpillar Eucheira socialis (Lepidoptera: Pieridae). Behav Ecol Sociobiol. 46(4):228–236. doi: 10.1007/s002650050614
- Uttah EC, Uttah C, Akpan PA, Ikpeme EM, Ogbeche J, Usip JO. 2008. Bio-survey of plankton as indicators of water quality for recreational activities in Calabar River, Nigeria. J Appl Sci Environ Manage. 12(2):35–42.
- Vitousek PM, Mooney HA, Lubchenko J, Mellilo JM. 1997. Human domination of earth’s ecosystem. Science. 277:494–499. doi: 10.1126/science.277.5325.494
- Walsh GE. 1978. Toxic effects of pollutants on plankton. In: Butler GC, editor. Principles of ecotoxicology. New York (NY): Wiley. Chapter 12; p. 257–274.
- Williams LG. 1964. Possible relationships between planktondiation species numbers and water quality estimates. Ecology. 45:809–823. doi: 10.2307/1934927
- Zannatul F, Muktadir AKM. 2009. A review: potentiality of zooplankton as bioindicator. Am J Appl Sci. 6(10):1815–1819. doi: 10.3844/ajassp.2009.1815.1819