
ABSTRACT
Next-generation sequencing (NGS) technology has led to an unrivaled explosion in the amount of genomic data and this escalation has collaterally raised the challenges of sharing, archiving, integrating and analyzing these data. The scale and efficiency of NGS have posed a challenge for analysis of these vast genomic data, gene interactions, annotations and expression studies. However, this limitation of NGS can be safely overcome by tools and algorithms using big data framework. Based on this framework, here we have reviewed the current state of knowledge of big data algorithms for NGS to reveal hidden patterns in sequencing, analysis and annotation, and so on. The APACHE-based Hadoop framework gives an on-interest and adaptable environment for substantial scale data analysis. It has several components for partitioning of large-scale data onto clusters of commodity hardware, in a fault-tolerant manner. Packages like MapReduce, Cloudburst, Crossbow, Myrna, Eoulsan, DistMap, Seal and Contrail perform various NGS applications, such as adapter trimming, quality checking, read mapping, de novo assembly, quantification, expression analysis, variant analysis, and annotation. This review paper deals with the current applications of the Hadoop technology with their usage and limitations in perspective of NGS.
Introduction
The genome sequencing has been the zone of interest for the researchers since past few years, although the majority of predictions to date have relied on the older concepts and sequencing hypothesis. The potential advances in sequencing and mapping have undergone a key movement far from the old conventional strategies to recently discovered advanced brisk and dependable innovations. These methods have led to certain scientific leads, which have almost changed the face of sequencing strategies with increased investment of high-throughput sequencing projects. The Human Genome Project (HGP), initiated in the United States by the National Institutes of Health and the Department of Energy in 1990, is till date the world’s largest collaborative biological project which extended for 13 years (NIH Citation2004). The major goal of the HGP was to determine the sequence of the chemical base pairs of DNA, and to identify and map all the genes of the human genome (Thamizhvanan et al. Citation2012). The project holds its advantage because the information extracted from the human genome has vast applications in the field of health, phylogenetic evolution, DNA forensic, agriculture, molecular medicines, microbial genome, risk assessment, pharmaceutical and food science industries.
The project has opened new path for the research interest in the versatile area of human genomics. Assembly and refinement of the highest-quality genome for any organism provide a snapshot of genetic variations underlying in it, like single-nucleotide polymorphisms (SNPs), copy number variants (CNVs), segmental duplications and low-copy repeats. These architectural rearrangements or so-called variations are responsible for several disorders and diseases. Knowledge about these complexities could aid in finding genomic instability and susceptibility to rearrangements, in the field of health and medicines (Gonzaga-Jauregui et al. Citation2012). SNPs/CNVs can act as genetic markers for a wide range of human diseases and other traits. These variations are inherited from parents to the offspring as depicted in the genealogy model, or they can arise in lineages of successive copies of DNA sequences studied under a phylogeny model. Controversies over human evolution are still an unresolved mystery, which is being solved to some extent with the advent of HGP and genetic sequencing of other species, strengthening the evolutionary relationships with other mammals (John et al. Citation2011). It has brought decade’s worth of research together to provide an overwhelming argument for the evolution of the human race. Phylogeny-based study identifies and explains the descendents of rare and complex markers including endogenous retroviruses, genome-modifying transposable elements, gene-disabling mutations, segmental duplications and mutated genes. Phylogeny dutifully explains the existence of many features important for the study of human biology; additionally, knowledge about related genes in another species will also be easier to interpret (Paul et al. Citation2008). The phylogeny study of an organism identifies the unique DNA sequences which are less precise at the species level. With the progress in DNA sequencing technologies (namely whole genome sequencing (WGS), target sequencing, variant calling, etc.), direct comparison of very large DNA segment has become a feasible practice. This feasibility may further allow individual’s identification and solve forensic problems by scanning DNA regions (DNA fingerprinting) that vary from person to person and the data can further be used to create DNA profile of that individual (Mousumi et al. Citation2005). The HGP has not only benefitted mankind but also has their direct or indirect influence on agricultural and microbial genome. Identification and genetic studies of the microorganisms packed with genetic resource for improving crop production and yield could enable the use of their healthy genes in the production of healthier crops. The benefit will help to grow/raise superior and disease-resistant varieties of plants and livestock, which will be able to feed the exploding population, bringing down the cost of living (Amanda et al. Citation2012).
The agricultural research community has been quick to benefit itself from the findings of HGP. An understanding of the structure, function and regulation of genes in economically important species is being studied under different national research programs. These programs in cooperation with other international genome mapping programs are achieving maximum effectiveness and popularity (Velikkakam et al. Citation2013). An excellent example of the ongoing program is the identification of gene sequence, coding for Protein C, which is needed for proper blood coagulation and treatment of blood disorders (Esmon Citation2000). Scientists have inserted the protein into the animals of family Suidae. This experiment has led to the production of Protein C in their mammary gland secretion of Swine, which has reduced the requirement of human blood donor for production of the protein. This would avert the potential contamination of human medications with human serum viruses as well as reduce the production costs, because small number of lactating sows could now easily meet the medical demand for protein C (Watson Citation1990).
Thorough understandings of the complete genome and pharmacology by the act of decoding and mapping has triggered the research process in the field of science and genetics, facilitating the minute perceptive and vital information about genetic diseases and traits. Cure of diseases like Alzheimer’s, diabetes and cancer by attacking the genetic roots of the cause can aid in its complete eradication. The understanding of genetic effects on diseases will lead to invention of new drug to treat different individuals (Roderic et al. Citation2006). Emerging is the new era of molecular medicine, completely relying on the famous quote ‘prevention is better than cure’. Looking to the most fundamental cause of disease, earlier detection of genetic predispositions of diseases and control systems for drugs and invention of ‘custom drugs’ have improved the diagnosis rate. Diagnosis of disease is one side of a coin; flipping the other side shows that the understanding of the human genome will also have an efficacious impact on the ability to assess risks posed to individuals by exposure to toxic agents. Every individual based on their genetic makeup responds differently to these toxic agents; some people are more susceptible and others more resistant to these agents. This information will help to perform in-depth risk assessment caused by radiation exposure, mutagenic chemicals and cancer-causing toxic agents (David et al. Citation2012).
Day by day, the overloading of omics information (genomics, transcriptomics, epigenomics and other omics data from cells, tissues and organisms) has led to the sudden increase in the size of the data (Costa Citation2012). Therefore, the present agenda and priorities lie in the application of the analytics to handle these volatile data. The useful information needs to be extracted and modeled to make relevant interpretation for better benefits of humanity.
Introduction to next-generation sequencing
Current research is being flooded with newer and faster methods of sequencing techniques replacing the older sequencing methods (Morozova and Marra Citation2008). Increasing cost-effectiveness of 2nd and 3rd generation systems, namely Illumina, Roche-454, ABI-SOLID, Helicos, Nanopore and so on, has enabled larger genomes to be sequenced with several X coverage in a single run. Multiple platforms of next-generation sequencing (NGS) with varied features have clear advantages for specific application such as identification of genes, exomes, variants, transcripts and small RNAs. (Raz et al. Citation2011; Corney Citation2013).
In principle, the concept behind NGS technology is similar to Capillary Electrophoresis (CE) (Meldrum et al. Citation2011) as in both the methods, signals are emitted from fragment while being re-synthesized from a DNA template strand. The NGS method relies on coupling of the DNA synthesis, which does not limit itself to a single or limited DNA fragments; it extends this process across millions of reactions in a massively parallel fashion. Hundreds of gigabases of data, that is, large stretches of DNA base pairs can be sequenced in a single run (Mocellin Citation2007). Sequencing involves series of steps: fractionation and sizing, template preparation, amplification, signaling and imaging (Metzker Citation2010). NGS provides voluminous data related to specific area of interest for large number of species, Homo sapiens, Mus musculus, Drosophila, Arabidopsis, S. cerevisiae, E. coli, and so on. For example, each of the 3 billion bases in the human reference genome including all 22,000 coding genes as well as small number of individual genes is being repeatedly sequenced with accuracy and hence increasing the information (Bentley Citation2004).
Comparison between NGS platforms
Bioinformatics has established a symbiotic relationship between two branches of science: computer science and biological science, making the best use of expensive raw data and is spreading its application with an aim to mold this information in a meaningful form.
The first step of sequencing was achieved by Frederic Sanger almost 25 years ago using traditional approaches. These earlier efforts of sequencing were painstaking, time consuming and labor intensive, which later became more easy, fast and accurate with the advent of NGS technology. Moreover, NGS has improved the quality of the sequencing methods by ensuring better alternatives considering length of the read, cost, speed, throughput, coverage, accuracy, easiness in handling of samples and preparation of library (Franca et al. Citation2002). Several NGS platforms have been developed in recent past years to cater to specific sequencing requirements. Before sequencing DNA or RNA, amplification is done producing huge amount of reads with repetitive region. Sequenced reads are smaller overlapping fragments, which need to be sequenced multiple times. NGS techniques generate multiple repeats in one run, as well as each run requires less money as compared to the older trivial techniques of sequencing like Sanger sequencing and others. A larger number of repeats gives more accurate and reliable output in the form of sequenced dataset with greater coverage. This process hides the discrepancy and artifacts associated with individual reads generated from the sequencer. Sanger sequencing has advantage over NGS in producing longer sequence reads, but the newer generation machines can too give longer reads by parallelly constructing it from many contiguous short reads. The biggest shift has been the development of parallel analysis, which enhances the speed of the platforms (Tanja and Salzberg Citation2011). Inventions of ultra-fast processors and memory handlers have also helped to characterize genome with its homologue identification. Current Sanger CE systems can sequence 1 mb of genome at a cost of ∼$2400 and this cost decreases to $0.07 if one uses an Illumina HiSeq 2000 system (Gregory et al. Citation2012).
Roche 454
454 is the first NGS platform launched in the market in the year 2005, founded by Jonathan Rothberg originally as 454 Corporation, a subsidiary of CuraGen Corporation (Totty Citation2005). The 454 Sequencing serves a wide applications including de novo sequencing, metagenomics, target sequencing, RNA-sequencing and so on. The sequencing is based on a large-scale parallel pyrosequencing system, which gives an output of ∼400–600 megabases of DNA per 10-h run. The basic principal step is to ligate the adapter with the sheared DNA fragments followed by fixing it to small DNA-capture beads immersed in water–oil emulsion. Each amplified copies of DNA-bound bead are placed into a ∼29 µm well made up of fiber optic plate along with enzymes (DNA polymerase, ATP sulfurylase and luciferase), and is then placed in the GS FLX System for sequencing. GS FLX Titanium series of Genome Sequencer FLX instrument is a modified version of older platform, which can sequence 400–600 million bps per run with 400–500 bp read lengths. 454 Life Sciences introduced the GS Junior System in late 2009 as a bench-top version of the Genome Sequencer FLX System to smoothen and speed up sequencing runs (Jarvie and Harkins Citation2008).
SOLiD
SOLiD, an NGS platform, was developed in the year 2006 by Life Technologies and was later purchased by Applied Biosystems. Unlike Roche 454 (sequencing by synthesis), ‘sequencing by oligonucleotide ligation’ is the basic principle adopted by SOLiD. A sample library preparation of sheared DNA fragments to be sequenced is amplified and fixed on the surface of each magnetic bead. Each copies of DNA-bound bead are poured in microreactors containing all the necessary reagents for PCR and lately transferred to a glass slide (Matthias et al. Citation2008). Furthermore, the setup is transferred to the sequencer, generating yield of 60 gigabases of usable DNA data per run offering 99.94% accuracy. The Applied Biosystems offers a broad range of services apart from SOLiD platforms; the other key services provided are, Real-time PCR, Digital PCR, Flow Cytometry, Gene Expression, Genotyping & Genomic Profiling, Sanger Sequencing and Human Identification Laser Capture Microdissect (Fei Citation2013).
Illumina
Illumina platform by Solexa came into existence in 1998 for analyzing genetic variations and biological functions. It gives products and services that are meant to perform sequencing, alignment, to find gene expression, variant identification, genotyping and lot more (MacArthur Citation2009). It has built clinical services laboratories, for offering WGS services to physicians and genetic counselors. Recent features introduced in the sequencer are securely transferring, storing and analyzing the data by means of established BaseSpace genomics computing environment. Third-party tools and applications can be included in Illumina, accessing a rich ecosystem, for data analysis. Illumina has conquered the NGS world, sequencing 1 terabase output per run, increasing reads number from millions to billions. Experiments that once required complex workflows now use simple push-button sequencing (Generation et al. Citation2010; Van Neste et al. Citation2015).
Helicos
Helicos is a life science initiative, which mainly perform genetic analysis for the research in drug discovery and diagnosis using imaging of individual DNA molecule by ‘The Helicos Genetic Analysis System’ platform (Pushkarev et al. Citation2009). Helicos BioSciences have provided the first single-molecule sequencing platform, HeliScope to the NGS world. HeliScope sequences an output of 1 Gb per day run. Single-molecule sequencing has been developed to circumvent the PCR problems of bias and artifacts. The technology has a broad range of applications and the sequence generated can be used to perform ChIP-sequencing, methyl-sequencing, RNA-sequencing, small RNA-sequencing and so on. (Patrice Citation2008).
Each NGS platform is unique in the way sequencing is accomplished; a comparison between these NGS platform is given in Table :
Table 1. Popular high-throughput NGS platforms, currently available in the market and the comparison between different characteristic features (sequencing chemistry, read lengths/throughput, run-time, template preparation and applications).
Sequence generation
The processing and analysis of NGS dataset follow a well-defined pipeline. Before jumping into the analysis part, readers must get acquainted with the process of sequence generation, which involves complicated steps. An overview of the sequencing methodologies of the individual platform having unique aspects has been discussed below:
Isolation of sample
Isolation of superior quality, intact, concentrated and contamination-free genetic material such as nucleic acids from different sources is the first step toward achieving meaningful association of genetic variants with phenotypic observations. Experimental studies have shown that available commercial kits, like Nucleospin Blood L and XL kits, are highly recommended for the extraction of the DNA needed for NGS applications. Superior quality DNA (without contaminating substances) having high molecular weight with an A260/280 ratio between 1.8 and 2.0 is needed for library preparation for NGS. Spectrophotometer, qubit measurement, real-time PCR amplifications and gel electrophoresis techniques are required for assessing purity of extracted DNA (Head et al. Citation2014). Researchers need précised tools and techniques to extract sample from different inputs and material types. Phenol–chloroform, silica and magnetic beads-based extraction procedures are examined to ascertain their relative effectiveness for extracting DNA from samples. Androniki Psifidi’s experimental approach showed that modified silica-based commercial kits (Modified Blood, Modified Tissue and Modified Dx kits) and in-house-developed magnetic beads-based protocols are most appropriate for extracting high quality and quantity of DNA suitable for NGS analysis with equal efficiency, purity and integrity irrespective of the sample type or method of quantification (Androniki et al. Citation2015). Isolation is followed by variety of steps to check quality of nucleic acids for purity, size distribution, integrity and concentration. The Promega Maxwell® DNA purification kits are designed for automated workflows. ReliaPrep®, Wizard® are used for manual processing of samples. Extracting higher DNA quantities by visiting farms, collecting individual blood samples and so on can be tedious job; therefore, bank should be archived for future reference to reduce labor and cost. (Turan et al. Citation2012). Independent of the type of platform used, success of the NGS method depends on the usage of high-quality starting DNA sample quantitated accurately.
Fractionation and sizing
Precise control over the size distribution of the nucleic materials which has to be sequenced is essentially required for the successful interpretation of NGS data. The available kits which are specifically designed for structural variant detection, de novo assembly (WGS), small and micro RNA (miRNA) protocols and the automated nucleic acid fractionation, completely eliminates the use of agarose gel excision in NGS workflows (Sol-Church et al. Citation2009). Biotron Healthcare has designed an instrument, Pippin – a preparative electrophoresis platform, which can be used to excise DNA from agarose slab gels. Pippin not only saves labor cost and manpower, but also higher quality DNA is produced with better quantity. The functioning of the instrument uses pre-cast and disposable gel cassettes, which accumulate differently sized DNA in buffer according to software-input size ranges. The adapters ligated with the sheared fragment are removed carefully with the help of standard pipettes. Pippin prep facilitates the construction of smaller sized fragments used for various applications such as paired-end sequencing, ChIP-seq, and preparing templates for emulsion PCR, whereas BluePipp facilitates the collection of larger fractions (Head et al. Citation2014). Caliper Life Sciences has developed a bench-top commercialized instrument LabChip XT to simplify and improve nucleic acid fractionation by utilizing microfluidics to achieve electrophoretic separations. The methodology overcomes the trivial approaches’ size variability achieved by agarose-based gel isolation, which ultimately reduces sequencing efficiency and manual excision, resulting in low precision and low sizing accuracy.
Library preparation
In the NGS workflow, preparation of high-quality library of nucleic acids relies on a coordinated series of standard molecular biology reactions (Thomas et al. Citation2012). The NGS biological samples (DNA or cDNA) are fragmented using acoustic waves. Adapters are ligated at the end of each fragment (Grada and Weinbrecht Citation2013). The constructed libraries are clonally amplified to enrich ditagged fragments; thereafter, the sequences are attached inside the surface of the flow cell channels. Few instruments use emulsion PCR to amplify single library fragments onto microbeads, whereas some of them utilize bridge amplification to form template clusters on a flow cell (Quail et al. Citation2012). Some important considerations before library preparation are the amount of raw materials used for NGS library preparation procedure, as well as the specific type of NGS application for which the analysis has to be done. Library preparations involve the risk of a biased approach resulting from genomes with high or low GC content. These can be avoided by addressing the situations through careful selection of polymerases for PCR amplification, thermocycling, conditions and buffers. Accurate quantification of the input genomic DNA ensures consistent and reproducible results from library preparation. In addition to the quantity, quality of the library must also be validated. The 2100 Bioanalyzer (Agilent) electrophoresis instrument can be used to measure the quantity of library. Numerous commercialized kits for preparing sequencing libraries (eg Illumina’s Nextera prep) from DNA for varying quantities are available in the market. The best way to get a desired output is to use large quantity of starting material to incorporate less amplification and enhance library complexity. NGS library construction using RNA to discover complex and global transcriptional events is a bit different from the DNA library preparation, since the construction mostly depends on the research interest of the scientist. The RNA study involves both coding and non-coding section; therefore, the library should capture the entire transcriptome (Nextera Explain Citation2013).
The denatured libraries flown over the flow cell undergo a process known as ‘bridge amplification’ or ‘clonal amplification’. Platforms like Roche 454, SOLiD use emulsion PCR; in contrast, Solexa uses bridge PCR for the amplification process. The amplification creates clonal clusters of single-stranded DNA molecules (Brown Citation2012). The strands are attached to their corresponding adapter sequences onto the flow cells. dNTPs (A, T, G, C) and DNA polymerase enzyme are added to the lane to elongate DNA strands which is followed by denaturation step of the newly formed cloned DNA strands. The step is repeated multiple times until dense clusters of dsDNA are generated in each lane of the flow cell. The reverse strands of the pair are then cleaved and washed away. After Bridge amplification, PCR is done on the flow cell to detect each nucleotide base (Richar et al. Citation2009).
Sequencing and imaging
A sequencing primer is fixed to the adapter; DNA polymerase then binds to the primer and one by one, base labeled with a specific fluorescent color (which acts as a terminator to the new DNA strand) is added to the flow cell. Once a labeled base is added to the lane, until and unless splicing occurs, no other bases can be added further. Base pairs are incorporated into the growing strand, lasers are passed over the flow cell to activate the fluorescently labeled nucleotide base pairs and images of the reads are recorded across the entire flow cell lane (Shendure and Ji Citation2008). For example, if a red fluorescent light goes off, it confirms the presence of nucleotide A, if a blue light goes off, then it is marked to be nucleotide G, and so forth. The color signal is captured and recorded on the computer. The process continues until millions of clusters have been sequenced and analyzed through ‘base-by-base’ calling reducing the error rate. Millions of reads of approximately 35 base lengths are generated per run by Illumina (Shendure and Ji Citation2008). Each cycle of sequencing in SOLiD platform works differently than the Illumina sequencer. It involves the ligation of a fluorescently labeled universal octamer primer which at a specific position carries fluorescent label. Images are captured in four channels, for every 5th sequenced base pair. Fluorescent labels are then cleaved and washed. Different primers can be used to examine the back and forth bases positioned to the already sequenced base. The platform can simultaneously use two labels involving the examination of the bases twice in a cycle, ultimately increasing the accuracy rate. SOLiD platform generates output of 25–35 bp lengthen reads, yielding 2–4 Gb of DNA sequence data per run (Mardis 2008; Shendure and Ji Citation2008). Illumina MiSeq generates 1.5–2 Gb sequence per run, PacBioRS generates 100 mb sequence per run, Illumina GAIIx generates 30 Gb of data per run and Illumina HiSeq 2000 which is ruling the sequencing market yields 600 Gb sequence per run (Gregory et al. Citation2012).
NGS data analysis
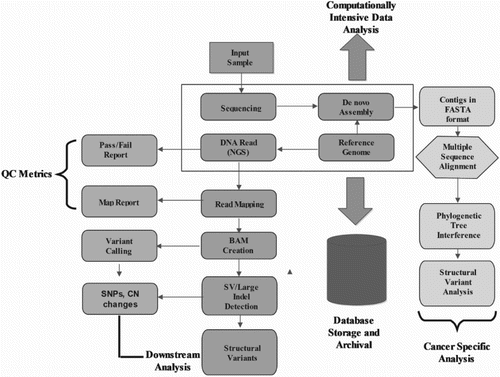
NGS requires revolutionized steps of data management and analytical research. Pipeline includes few analysis steps; firstly, adapter sequences are needed to be trimmed followed by the removal of low-quality reads. The filtered fragments (reads) are aligned to the reference genome, or de novo alignment is done during unavailability of the reference genome (Chou Citation2012; Jason et al. Citation2014). Analysis of the sequences would contribute to the diagnosis of a disease or genetic condition due to variants, differential expression analysis, or due to the alteration in methylated pattern and so on. (Figure ).
Figure 1. Steps for processing raw NGS data to generate the set of structural variants or genotype calls. Pre-processing steps include production of a set of reads in the form of NGS raw data. These reads undergo quality check, where separate quality score is assigned to each base read through base-calling algorithms, which often get recalibrated to measure the true error rates. In continuation, simple heuristic methods are applied to the individual data to improve overall quality scores of the reads. Depending upon the specific requirement, these processed data are further filtered, mapped and analyzed utilizing dozens of existing software packages and tools in the form of well pre-defined pipeline as shown in the figure.
Next-gen high-throughput sequencing is known to be a data-hungry process, which has resulted in several in-house repositories with redundant data. Cutting-edge sequencing is identified with enormous information investigation, as the methodology may require the gathering, transforming and dissection of amazingly expansive volume of organized and unstructured biomedical information originating from an extensive variety of examinations and reviews gathered by various research centers. Recurring advances in sequencing technologies and multi-million genomics readouts have enabled us to investigate the microbial world in magnitudes of higher resolution than was possible a few years ago (Caboche et al. Citation2014). NGS has been employed to better understand genomic events of drug resistance in persistent pathogens, whereas with single-cell genomics and metagenomics, it is now possible to study these microbes individually or in community. Standard analysis of whole genome data obtained through high-throughput sequencing can give us important insights into genomic variations responsible for varying phenotypes, novel genomic regions acquired through Horizontal-gene transfer, identification of previously unknown functional genes, genomic markers and genotypes and so on. (Srivatsan et al. Citation2008).
Thousands of probes were designed for targeted enrichment of exonic and untranslated region (UTR) regions, based on available databases, namely CCDS, RefSeq, Encode/GENCODE and miRBase (Bainbridge et al. Citation2011). Sequence data generated after enrichment are used to analyze the variants which can be used in gene discovery and to understand the molecular mechanisms associated with the process (Strachan and Read Citation1999). Exome sequencing which involves massive parallel sequencing of the functionally important coding regions, or exons, of known genes can also be used in clinical diagnosis, screening and treatment by dissecting phenotypic and genotypic heterogeneity in diseases (Guerreiro et al. Citation2014; Diroma et al. Citation2014; Renkema et al. Citation2014). Transcriptome sequencing is used to find gene expression, to reconstruct the transcripts, to detect SNPs, as well as in alternate splicing detection (Haas et al. Citation2013). Two assembly approaches widely used in sequencing are: (a) Genome dependent assembly and (b) Genome independent assembly. In the first approach of assembling, a reference genome is constructed for newly sequenced organism (Pop Citation2009), whereas for the second approach, sequences are needed to be fragmented and altered. The major drawback of genome assembly is its inability to find alterations of mRNA transcripts, which can be overcome by using short read assembler. The high-throughput sequencing combined with small-RNA-seq analysis helps to identify microRNAs (miRNAs) and its profiling of novel small RNA genes and prediction of their type (Großhans and Friedrich Miescher Ins Citation2010). miRNAs are short (∼22 nucleotides) non-coding RNAs derived from larger hairpin RNA precursors which are omnipresent (Ambros Citation2001). In human, miRNAs binds to the 3′- UTRs of protein-coding transcripts and usually negatively regulates gene expression (MacFarlane and Murphy Citation2010). Small RNA-sequencing libraries generated from total RNA can be used in understanding the role of non-coding RNAs, the post-transcriptional regulation contributing to phenotype, identification of novel biomarkers and capturing the complete range of small RNA and miRNA species (Henk et al. Citation2010).
NGS provides the power to address a broad range of applications in diverse fields of biology, Metagenomics being one of them. Metagenomes are the genetic material recovered directly from environment samples studied for the identification of novel genomes, biochemical pathways, which can potentially unlock the massive uncultured microbial diversity present in the environment to facilitate therapeutic, medical, agricultural and biotechnological research. Ribosomal identification and whole genome surveys have enabled to analyze the relative abundance of microbial species in versatile environmental conditions, like the human gut and mouth, soil, coral reefs, deep sea thermal vents, drinking water and much more (Bashir et al. Citation2014). Metagenomics discover new genes and make functional predictions in unculturable species, perform gene expression analysis and functional annotation within microbial communities, and identify novel pathogens in viral outbreaks by sequencing fragments of amplified RNA from infected individuals (John and Ye Citation2009).
NGS analysis covers versatile sequencing applications such as RNA-seq, ChIP-seq and Methyl-seq experiments. Each sequencing technique is explained below in detail.
RNA-seq
The workflow of RNA-sequencing includes condition-specific significant differential expression (SDE) analysis. The study is not restricted to customary expression analysis only; it also facilitates differential splicing identification. RNA-seq can be utilized in transcriptome variant detection and to distinguish gene fusion events, apart from identifying novel genes and exons. Further downstream analysis such as GO and pathway analysis can be performed on the sets of interesting known and novel genes obtained as a result of the analysis outcome. A standard RNA-seq analysis workflow includes data quality check, mapping, quantification and normalization, differential expression analysis, novel discovery, transcriptome-variant detection, gene fusion identification and pathway analysis (Cole et al. Citation2012). Explaining each step is beyond the scope of this paper, but there are some research papers, which elucidate the specific sections with the help of examples. Few pipeline/packages for RNA-sequencing are MAP-RSeq, PRADA, Galaxy, OmicScript, CLC Genomics, GeneSpring®, R/Bioconductor and so on. MAP-RSeq is a comprehensive simple-to-use application facilitating alignment statistics, quality control statistics, gene counts, exon counts, fusion transcripts and SNVs per sample detection (http://bioinformaticstools.mayo.edu/research/maprseq/http://bioinformaticstools.mayo.edu/research/maprseq/). PRADA (Pipeline for RNA-Sequencing Data Analysis) is a highly scalable software platform that provides many different applications related to RNA-sequencing (http://sourceforge.net/projects/prada/). Galaxy provides a flexible, modular platform involved in executing complete RNA-seq analysis pipeline (https://usegalaxy.org/). OmicSoft also provides a command line tool, Oshell a .NET and MONO application for RNA-seq data analysis (http://www.arrayserver.com/). CLC Genomics Workbench – a commercialized software package is very much involved with sequencing projects (https://www.qiagenbioinformatics.com/products/clc-genomics-workbench/). Bioconductor, an R-based package, supports analysis of high-throughput sequence data of RNA-seq. (http://www.bioconductor.org/help/workflows/rnaseqGene/). Agilent Technologies and Strand Life Sciences have built Gene- Spring® for analysis and interpretation of NGS experiments.
Apart from these workbenches, there are softwares, which can be used to perform each step individually. For quality checking, FastQC (http://www.bioinformatics.babraham.ac.uk/projects/download.html#fastqc), NGSQC (http://www.nipgr.res.in/ngsqctoolkit.html), RNA-SeQC (https://www.broadinstitute.org/cancer/cga/rna-seqc) and RseQC (http://rseqc.sourceforge.net/) are widely used. Erne-Filter (https://sourceforge.net/projects/erne/), FASTX (http://hannonlab.cshl.edu/fastx_toolkit/download.html), htSeqTools (http://bioconductor.org/packages/release/bioc/html/htSeqTools.html), PRINSEQ (https://sourceforge.net/projects/prinseq/), TagCleaner (http://tagcleaner.soft112.com/download.html), Trimmomatic (http://www.usadellab.org/cms/index.php?page=trimmomatic) and so on are a few tools recommended for trimming and adapter removal.
RNA-seq analysis in the next step involves alignment. Bowtie (http://bowtie-bio.sourceforge.net/index.shtml), Burrows-Wheeler Aligner (BWA – http://bio-bwa.sourceforge.net/), Maq (http://maq.sourceforge.net/), Mosaik (http://gkno.me/), NovoAlign (http://www.novocraft.com/products/novoalign/), SEAL (http://biodoop-seal.sourceforge.net/), Stampy (http://www.well.ox.ac.uk/project-stampy) and so on are some short, unspliced aligners. STAR (http://code.google.com/p/rna-star/), Bowtie2 (http://bowtie-bio.sourceforge.net/bowtie2/index.shtml), TopHat (https://ccb.jhu.edu/software/tophat/index.shtml) and so on are examples of spliced/gapped aligners. Normalization, quantitative analysis and differential expression analysis can be done using BaySeq (http://bioconductor.org/packages/release/bioc/html/baySeq.html), Cufflinks/Cuffdiff (http://cole-trapnell-lab.github.io/cufflinks/), DESeq (http://bioconductor.org/packages/release/bioc/html/DESeq.html), EdgeR (https://bioconductor.org/packages/release/bioc/html/edgeR.html), NOISeq (https://www.bioconductor.org/packages/release/bioc/html/NOISeq.html), HTSeq (http://www-huber.embl.de/HTSeq/doc/install.html) and so on.
Artemis, BrowserGenome, Integrative Genomics Viewer (IGV – https://www.broadinstitute.org/igv/download), SeqMonk (http://www.bioinformatics.babraham.ac.uk/projects/seqmonk/), Tablet (http://bioinf.scri.ac.uk/tablet) and so on are popularly used visualization tool. While experimental protocols have been standardized for better results, the analytical component continues to be in a process of improvement, which means that no single pipeline is applicable to all, and every dataset has to be dealt individually. At every step, the selection of tools, workbench and chosen parameters affect the downstream analysis (Lam et al. Citation2014).
Precisely we can say that RNA-seq is a weapon, which reveals and quantifies the expression level of genes by sequencing mRNA or transcripts in the cell (Nagalakshmi et al. Citation2010). Higher vertebrates and even lower eukaryotes display substantial amount of alternative splicing (Kornblihtt et al. Citation2013), increasing the transcriptome diversity across different tissue types or cellular states given a fixed number of genes. Apart from spliced genes, non-coding RNAs also act as a major contributor to the mass of transcriptional content. We have just begun to understand the role of splice isoforms and non-coding RNAs in creating the phenotype and adaptability of complex organisms (Wang et al. Citation2011; Ye et al. Citation2014). Moreover, the huge volume of data generated by NGS platforms introduces unprecedented computational and technological challenges to efficiently analyze and store sequence data and interpret results.
In order to provide researchers with an effective and friendly resource for analyzing RNA-seq data, a cloud computing web application implementing a complete analysis workflow is required. RAP (RNA-seq Analysis Pipeline) (http://bioinformatics.cineca.it/rap/) integrates both state-of-the-art bioinformatics tools for RNA-seq analysis and in-house-developed scripts to offer to the user a comprehensive strategy for data analysis. RAP is able to perform quality checks (adopting FastQC and NGS QC Toolkit), identify and quantify expressed genes and transcripts (with Tophat, Cufflinks and HTSeq), detect alternative splicing events (using SpliceTrap) and chimeric transcripts (with ChimeraScan). This pipeline is also able to identify splicing junctions and constitutive or alternative polyadenylation sites (implementing custom analysis modules) and call for statistically significant differences in genes and transcripts expression, splicing pattern and polyadenylation site usage (using Cuffdiff2 and DESeq) (D’Antonio et al. Citation2015).
ChIP-seq – genome-wide identification of protein–DNA interactions
ChIP-seq is the combination of chromatin immunoprecipitation (ChIP) and NGS, where antibodies are used to select specific protein of interest for enriching associated DNA fragments (Kidder et al. Citation2012). It is used to find the interactions between protein, DNA and RNA linked to several biological processes and disease states (Park Citation2009). This genome-wide technique provides a precise map of binding sites for transcription factors, core transcriptional machinery, nucleosomes and other processes (Elfving et al. Citation2014). The protocols suggest that the bound pair is coprecipitated, purified and then sequenced. ChIP-seq has several advantages over the trivial methods (namely real-time PCR and array-based methods): it captures the targets (DNA) across the entire genome of an organism for specific transcription factors or histone modifications, defines transcription factor binding sites, as well as in combination with other sequencing techniques, the analysis in addition reveals gene regulatory networks. ChIP-seq identifies the binding sites of DNA-associated proteins and can be used to map global binding sites for a given protein. The sequencing technique is used to investigate the epigenome, and the method is better than the array-based approaches since pre-designed probes are not required. ChIP-seq requires massive short reads to construct a counting assay that provide evocative data. Advances in NGS technology have allowed projects like the Encyclopedia of DNA Elements (ENCODE) and modENCODE to generate large number of ChIP-seq datasets (Stephen et al. Citation2012). Microarray analysis has given birth to ChIP-seq technique, but ChIP-seq completely requires new set of analysis tools. The first step in ChIP-seq analysis is to align short trimmed sequence reads to a reference genome. The second step is to find peaks of different base pairs using peak-calling algorithms to determine nucleotide resolution of transcription factor-binding site and motif analysis. To further analyze the data, differential binding or motif analyses are common end points of ChIP-seq workflows. Control generation is an important parameter for ChIP-seq experiments. There are two methods that are often used to produce control DNA samples in ChIP-seq studies. DNA isolated from cells that have been cross-linked and sonicated under the same conditions as the immunoprecipitated DNA (‘Input’ DNA); and a IgG ‘mock’ ChIP reaction is performed using a control antibody that reacts with an irrelevant, non-nuclear antigen (‘IgG’ control) (Euskirchen et al. Citation2007). The millions of reads generated in each experiment are mapped to the reference genome. The most commonly used tools for ChIP-seq alignment are MAQ, MyriAlign (http://savannah.nongnu.org/projects/myrialign) and Bowtie allowing small number of mismatches. The proceeding step of true peak finding is the detection of a site where multiple reads have mapped and piled up. A good understanding of ChIP fragment size helps in locating the specific nucleotide-resolved binding sites. There are several algorithms developed to call peaks from ChIP-seq datasets. FindPeak program, an in-built tool of HOMER workbench, performs all of the peak calling and transcript identification analysis. The basic idea is to identify regions in the genome where we find more sequencing reads than we would expect to see by chance (http://homer.salk.edu/homer/ngs/peaks.html). Similarly, MACS – Model-based Analysis for ChIP-seq allows a more sensitive and robust prediction of peaks using dynamic Poisson distribution. It models the length of the sequenced ChIP fragments to improve the spatial resolution of predicted binding sites (http://liulab.dfci.harvard.edu/MACS/).
PeakRanger (Feng et al. Citation2011), a Hadoop-based tool, is provided with spatial accuracy in terms of identifying the precise location of binding events. The tool is efficient in all respects, considering specificity and sensitivity running on a single processor system, easily handling MapReduce parallel environment offered by cloud computing. The provided algorithms securely help to handle sites such as transcriptional factor binding sites or histone modification marks. After sequencing, mapping and peak finding, visualization of ChIP-sequencing dataset is required for visual inspection of the differential binding site. The DiffBind package (http://bioconductor.org/packages/release/bioc/html/DiffBind.html) allows identification of genomic loci that are differentially bound between two conditions. Genes and other annotated elements located in the identified enriched regions of the genome are the basis of the results obtained from ChIP-seq experiments. Another application of ChIP-seq is motif detection for protein binding in the genome. The best algorithm adopted for its discovery is Multiple EM for Motif Elicitation (MEME) (http://meme-suite.org/). Characterization of genomic regions based on the content of histone modification is another useful application of ChIP-seq dataset analysis. Standardized laboratory methods available kits (such as EMD Millipore’s Magna ChIP-seq chromatin IP) and next-generation library construction kit (such as StrandNGS) make it possible to perform ChIP-seq analysis and construct NGS library (http://www.strand-ngs.com/).
Methyl-seq
Methyl-seq is a target enrichment analysis to focus on the regions where methylation has impact on gene regulation. Initiating from understanding the role of methylation, it can be inferred that DNA methylation is an epigenetic modification event that alters the functioning of genes by adding a methyl group to the strand of nucleic acid at CpG islands, CHH and CHG regions of the genome. The event during the DNA replication is a stable gene-silencing mechanism. Significantly, the methylation of the nucleotide base Cytosine (C) alters the gene expression and histone modification. The methylation activity of the Cytosine can be observed using the bisulfite conversion of DNA. A method like Whole genome bisulfite sequencing (WGBS) of NGS converts unmethylated Cytosine (C*) to Uracil (U) in the library preparation step. After the PCR method, these altered bases (C*→U) are identified as Thymine (T) in the sequenced dataset. The amount of read counts at particular position gives a clue of occurrence of methylated Cytosines. Generic workflow for methyl-seq is similar to the steps involved in workflow of NGS experiments. Bismark (http://www.bioinformatics.babraham.ac.uk/projects/bismark/) alignment tool is preferred over popular tool Bowtie. Quality metrics is designed for pre- and post-aligned data. Methylated Cytosines are identified for specific loci, which further help in recognizing differentially methylated Cytosines across experimental conditions. Target regions are looked for low, moderate and high methylation density at the region of interest. By the help of visualization tools and interactive genome browser, differentially methylated C’s can be viewed. Histogram plots identify the proportion of methylated and unmethylated C’s. The BaseSpace® app developed or optimized by Illumina or any third-party app providers is a cloud-based genomics hub for NGS data management and analysis. BaseSpace® app MethylSeq analyzes DNA reads generated using Methylation kit. MethylSeq uses Bismark to map methylated reads to the genome and performs methylation calls. The coverage of these extended reads can be used to estimate the methylation level of the region (Akalin et al. Citation2012; Van Neste et al. Citation2015).
NGS & big data
The NGS which tends to produce raw data of size as large as 1TB per sample often poses difficulty for the information mining and reasonable interpretation. The word’s current sequencing limit is evaluated to be 13 quadrillion DNA bases per year. The high volume of biological data generated through NGS across the world in research laboratories are instances of Big Data, which is often described with five buzzwords: ‘Variety, Velocity, Volume, Veracity and Value’ of data (Shivakumar Citation2013). This has resulted in the urgent need for new databases that can store large volumes of disparate data types. Even though the Big Data framework promises a scalable approach for analysis of such complex data, the need for custom tools for processing and analysis of complex NGS data is currently a nascent area of research. For example, to store 1000 human genomes, the net measure of space needed is roughly three terabytes; however, the storage of raw sequences needs considerably more space. Furthermore, retrieving and transferring these voluminous data, which is composed of several thousand genomes (as in the ICGC), propel the use of various sequence compression techniques (Schatz et al. Citation2010). There exist several tools to manifest this issue of shrinking the huge NGS raw data to miniaturized profile by utilizing the subtle patterns present in the noisy data. The cumbersome task of handling these large data on the cloud and further fusing the disparate datasets has been carried out through a series of software tools and packages based on big data framework on commodity hardware. ‘Cloud computing’ is a variety of internet-based computing services, which portray the cloud-based software as the one which is not actually operated on the user’s desktop but is indirectly computed in a large datacenter outside the organization, and the user simply sees the output flashing on his/her screen.
Recently, the NIH-financed 1000 Genomes Projects have resulted in 200 terabytes of crude sequencing information, which were submitted to the GenBank during the initial six months of operation, which is twice the extent that had been stored into all the GenBank during the last 30 years (Madhavan Citation2012). Moreover, the recent big data analytics, which are meant to handle large-scale data through hardware association, have been proved to act as a boon for NGS data analysis (O’Driscoll et al. Citation2013).
Big data & Hadoop utilities
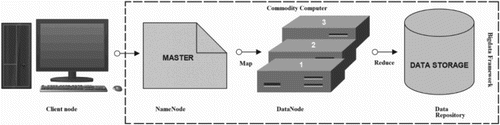
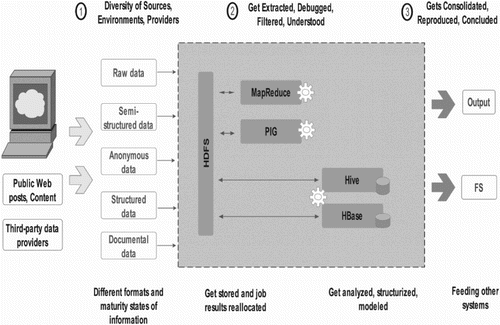
The concept of data warehouse became ineffective, as the amount of data generated by data-intensive methods like NGS has reached out the final hardware capacity, and hence, tends to produce a repository, which cannot be queried for further insights. To overcome this challenge, Doug Cutting made Apache-based Hadoop and developed a long ways past the capacity of customary frameworks to handle enormous data volume. Hadoop has been proved to be an effective solution for storing, handling and investigating many terabytes, and even petabytes of data, through arena of reliable, scalable, distributed computing software tools (Doug Citation2012). The principle of dividing large datasets into smaller blocks distributing across clusters of commodity computers by Hadoop programming libraries has provided simple programming models (Figure ). Furthermore, the library keeps a check on any kind of failures at the application layer, hence ensuring the quality-based services on low-end hardware. Hadoop framework made it possible for a large number of machines to scale up their processing through chain of multiple local computation and storage units. The beauty of scalability has made Hadoop an influencing application in NGS studies for distributing the data, processing information and extracting patterns from big size genomic data sample.
Figure 2. Data files are partitioned into large chunks and are replicated on multiple nodes.
Apache Hadoop relies on cheap hardware to store and process huge amounts of data. It enables distributed parallel processing of a huge amount of data across inexpensive, industry-standard servers that can store and process these data, and can scale without limits. One can tackle the bigness of big data by using Hadoop distributed file system (HDFS) to form and mine flexible data repositories in a non-redundant manner. Hadoop cluster can accommodate anywhere from tens to thousands of nodes in spite of its centralized data repository-based approach. Hadoop’s distributed computing architecture, which is cost-effective in all respects, emphasizes unique set of characteristics for processing data and storing it securely through:
Distributed computing – by applying parallel computation on available data, secured job environment is created free from any phishing. The framework is efficient in a way that it distributes its data across different nodes and utilizes the parallelism of the CPU cores. This feature makes Hadoop a scalable storage platform distributing large dataset among inexpensive servers.
Fragmented data – input is fragmented into multiple copies and shared across multiple servers to avoid redundancy. Hadoop operation is not interrupted by addition or removal of the cluster. The fragmented files are in the form of blocks stored in a set on different nodes. These block-sets are shuffled among each node, which helps to deal with large volume of unstructured data.
Access to data – big data checks access at different levels providing high security to the users offering access control at the schema level. Data and data processing tools are often on the same server; this setup results in fast processing of the data. Data are distributed to different nodes; therefore, each copy of data is available on all the nodes. This redundancy provides resilient to failure.
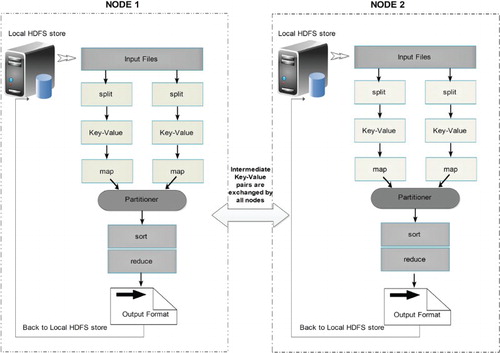
Node-to-node communication – Hadoop uses remote procedure call (RPC) over transmission control protocol (TCP/IP) for communication. This is the protocol by which Hadoop framework supports encryption/or secured communication between different nodes. The data shuffling has been explained with the help of Figure .
Figure 3. HDFS model is designed of two clusters, NameNode and DataNode, for processing large volume of data. These clusters are java-based applications, which run on a GNU/Linux operating systems only. Highly portable Java language facilitates nodes to run on various machines and this architecture affords high scalability in a number of deployed DataNodes. The complete functioning of the framework is explained in steps 1–6: Step 1 – MapReduce input files are loaded by Clients on the processing cluster of HDFS. Step 2 – The client posts job to processed files, the Mapper splits the file into key-value pairs and after the completion of the step, the involved nodes exchange the intermediate key-value pairs with other nodes. Step 3 – The split files are forwarded to Reducers (independent of knowledge of which Mapper it belongs to). Partitioners do this job more efficiently deciding the path of the intermediate key-value pairs. Step 4 – User-defined functions synthesize each key-value pair into a new object ‘Reduce-task’. Intermediate key-value pairs are sorted by Hadoop and then the job is shifted to Reducer. Step 5 – Reducer reduce() function receives key-value pairs, the value associated with the specific key are returned in an undefined order by the iterator. Step 6 – Results are regrouped and stored in outer files and governed by OutputFormat. The output files written by the Reducers are then left in HDFS for client’s use. Hence, the MapReduce application can introduce a high degree of parallelism and fault tolerance for the application running on it.
Hadoop distributed file system
The HDFS is a distributed file system based on Google Distributed File Systems (GFS) primarily designed to run on series of commodity hardware. However, HDFS provides significant fault-tolerance capacity due to replication of fragmented data block on low-cost distributed hardware. Moreover, HDFS provides high-throughput access to the application data, making it the first choice for large-scale data analysis. An HDFS cluster comprises a single master server, termed as NameNode. NameNode facilitates file-management as well as provides its client power to access these files (Figure ). In addition to the master server, HDFS is provided with additional DataNodes, usually one per node in the cluster. DataNodes facilitates the job by solving storage issues associated with these nodes on which the job is being processed by creating a filesystem namespace and allowing user’s data to be stored in these files. The stored file is split into several blocks and stored in a set of DataNodes. Different operations like opening and closing of files as well as renaming of the file and directories in the file system namespace are done by the NameNode, whereas the DataNodes serves client’s request to read and write these files. The DataNodes also follows NameNode’s instructions to execute block operations such as creation, deletion and replication of these files.
In the heart of Hadoop-based framework, there exists the MapReduce algorithm, which efficiently manages the ‘map’, that is, splitting of high-volume dataset into several smaller blocks and ‘reduce’, that is, merging the processed blocks for retrieval of complete information.
MapReduce algorithm
MapReduce is a popular open-source programming model having Apache Hadoop-based framework designed for processing large datasets in parallel fashion. This is achieved by splitting the task into sets of independent jobs across different number of machines. Functionally, the framework transforms the input data elements into the output data elements.
The programs perform two tasks: mapping and reduction using two different processing functions (map and reduce). Mapper() function transforms all the input data elements into output data elements, whereas Reducer() function receives these input files, merges the files and returns a single output. In MapReduce framework, the mapper() and reducer() functions receive the value in the form of pairs (Key–value). The Mapper presents all the similar values associated with the key to a single reducer. The sets of intermediate key/value pairs, as shown in Figure , are also exchanged between different nodes, the process being known as ‘shuffling’. The job is distributed on the different machines processing different sets of keys (associated with values). The reducer writes the output in the output file, which is left in the HDFS for the user’s inspection. For a better understanding of the Input and Output file types of a MapReduce task, an equation is given below:
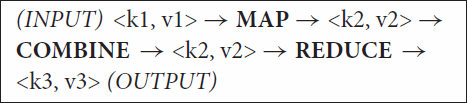
The model partitions the job in a parallel fashion and distributes it to the clusters. The partitioning minimizes the handling error as well as ensures proper execution of the task with least redundancy. An example of MapReduce is given below to understand its job more clearly:
Consider a sample data of five files. Each file is further split into two columns – (i) a key and (ii) a value, in terms of MapReduce algorithm that represents non-coding RNAs and the number of reads per run, respectively.
From the above data, one needs to find the maximum number of reads for each non-coding RNA. It must be noticed that the key may get repeated several times in a file. The MapReduce framework is designed in such a way that one task is broken into five map tasks. Each mapper gets associated with a file, surveys the data and returns the maximum reads for each non-coding RNAs. For example, the result obtained from one mapper task for the particular data given above would somewhat appear like this:
(miRNA, 20) (piRNA, 08) (lncRNA, 12) (snoRNA, 05) (snRNA, 06)
Let us, for assumption, portray that the other four mapper tasks (working on the other four files not shown here) produced the following intermediate results:
(miRNA, 18) (piRNA, 10) (lncRNA, 12) (snoRNA, 08) (snRNA, 06) (piRNA, 02) (lncRNA, 10) (miRNA, 15) (piRNA, 03) (miRNA, 19) (snoRNA, 07) (snRNA, 05) (miRNA, 22) (lncRNA, 11)
After the mapper has completed it tasks, all the five output streams are reportedly forwarded to reduce task. The final output obtained has a single value for each non-coding RNA, appearing as follows:
(miRNA, 22) (lncRNA, 12) (piRNA, 10) (snoRNA, 08) (snRNA, 06)
Thus, mapping of non-coding RNAs with varied read counts appears more efficient and less painstaking than would have been if the task was assigned to a single machine in a serial fashion.
Various other wrappers associated with Hadoop like PIG, Hive and HBase facilitate the scripting, job processing and querying jobs on the NGS data as shown in Figure . These wrappers provide a better control over the MapReduce code and also aid in the source code development. The highly used module PIG is the solution to Big Data which concentrates on exploiting data parallelism, but the patterns followed in the parallelism are highly restricted (White Citation2010).
Figure 4. MapReduce data flow diagram illustrating the processing of complicated job and its components.
An NGS tool based on the MapReduce framework, Eoulsan modulates HTS data analysis and also allows users to easily set up a cloud computing cluster, which automatically directs the users to analyze several data samples (Jourdren et al. Citation2012). One utility named CloudBLAST (Matsunaga et al. Citation2008), which uses a MapReduce version of the commonly used bioinformatics application, NCBI BLAST, offers a speedup of sequence searching as the number of available processors is increased, delivering speedups of 57 against 52.4 of MPI version, when 64 processors on 2 sites are used. Similarly, Biodoop provides suits for parallel bioinformatics applications providing Hadoop versions of BLAST and GSEA. Hadoop MapReduce-based approaches have become increasingly popular due to their scalability in processing large sequencing datasets. To reduce the complexity, SeqPig has been created, which offers a collection of library and tools to manipulate, analyze query-sequencing datasets in a scalable and simple manner. SeqPig scripts use Hadoop-based distributed scripting engine Apache Pig, which automatically parallelizes and distributes data processing tasks (Schumacher et al. Citation2014).
Tools & packages (traditional versus cloud computing services)
There exist several tools to perform task parallelism, pipelining and data parallelism without hampering the topology of analysis pipelines. This proceeding section of the review explains the workflow of NGS analysis with the help of softwares/packages designed specifically to perform assigned function. Tools and the job description provided in the upcoming sections will help the readers to understand the basic steps of NGS analysis, starting from data download to annotation part. The review explains the dependencies and working of different softwares; the pipelines and packages have also been covered that are designed on cloud computing clusters using MapReduce framework (Gaggero et al. Citation2008). The advantages and disadvantages of the software have also been roofed under the same section so that the users can find appropriate reason for selecting a specific tool for their research work. In this section, some basic cloud computing terminologies and outline have been introduced. The advantages and disadvantages to cloud computing will come as complementary gift along with the suites and packages.
Modern high-throughput sequencers generate several gigabytes of data every run, which makes it difficult to archive these raw data after completion of experiment. High-throughput sequence data of various categories of functional genomic database is submitted to Gene Expression Omnibus (GEO) database of NCBI. Data archived in GEO have fixed provisions and standards, such as, detailed description of the experimental samples, protocol selected for the case study, related manuscripts and sequence in the form of reads, which must be provided at the time of data submission. Sequence data are submitted in two formats – GEOarchive spreadsheet format and SOFT format. There are three components (Metadata spreadsheet, Processed data files and Raw data files) required by the GEOarchive format before submission. Metadata spreadsheet includes the descriptive part of the information provided for the depositories associated with the study sample. The final processed data more confined toward the conclusion section of the related manuscript are given in the processed data files. Quantitative data related to genes, transcripts, exons, miRNAs, lncRNAs, piRNAs and so on are generated and stored in two formats: raw read counts and normalized raw counts generated through softwares used for differential expression analysis. Submitted raw format can be in BED, WIG, GFF, GTF file formats. Mapped reads (in SAM/BAM/BED format) are the alignment files, which are semi-processed data; submission of these files are restricted and should be uploaded with only specific datasets consisting of peak, tpm/rpkm/fpkm counts. Raw data are the most important file in GEO submissions consisting of information which is meant to be stored in sequence read archive (SRA) database. Raw data files are original files excluding the processing details bearing reads and related quality scores in .sra format, .fasta format and .fastq format. SRA is a centralized repository similar to GenBank, maintained by NCBI in 2007. The archive mostly dwells with human genomic sequences, occupying ∼65% of the total repository space. The NGS world is not restricted to single repository database; another database, European nucleotide archive (ENA), provides free and unrestricted access to the fragmented sequences. ENA works in collaboration with SRA, the Trace Archive and EMBL-bank, and is maintained by European Bioinformatics Institute (EBI), International Nucleotide Sequence Database Collaboration (INSDC), DNA Data Bank of Japan (DDBJ) and GenBank. Data stored in ENA can be manually curated or can be downloaded using REST URL. Individual file can be downloaded in formats like XML, HTML, FASTA and FASTQ. Data generated in house as well as downloaded from archives need to filter bad and/or unusable data, which may severely affect downstream analysis. Quality check and assessment is an integral first step for any analysis of high-throughput sequencing data (Yuichi et al. Citation2012).
File format conversion
Data deposited to SRA database are compressed and archived in a special format with an extension of ‘*.sra’. These files need to be converted into FASTQ files before proceeding with any analysis. The SRAtoolkit (http://www.ncbi.nlm.nih.gov/sra) is a suite of programs that has been developed to work with ‘*.sra’ files. The ‘fastq-dump’ program in the SRAtoolkit can convert a ‘*.sra’ file into ‘*.fastq’ files (Dominissini et al. Citation2013). Samtools (http://samtools.sourceforge.net/) also supports file conversion. Similarly, BioDoop (https://sourceforge.net/projects/biodoop/) is another Hadoop-based suite which is designed for handling FASTA files, for converting sequences to different formats, and so on (Leo et al. Citation2009). Seal (http://biodoop-seal.sourceforge.net/) is a suite of distributed applications which run on the Hadoop framework well suited for processing large datasets. Seal currently supports the following Hadoop-based tools: Bcl2Qseq which extract reads in qseq format, Demux separates these files generated as an output from the Illumina run directory produced by multiplexed Illumina run and PairReadsQSeq converts qseq (or FASTQ) file to prq format to be processed by the alignment program, Seqal. The prq file format places entire pairs of read (mate pairs) on a single line in one record. The prq file format holds details of sequence id, the raw sequence and its associated quality values encoded in ASCII characters. PairReadsQseq (PRQ) standardizes base quality scores to Sanger-style Phred+33 encoding. It also converts unknown bases (‘.’ in QSeq file) to ‘N’. The main purpose of PRQ is to place both read and mate data in the same data record.
Quality check, filtering/trimming criteria
The raw data contain bad-quality as well as good-quality reads; therefore, as first step in the pre-processing workflow, the quality of the read is checked. Sequencing errors complicate the analysis, may leave gaps in assembly and in addition may create ambiguous paths or improperly connect remote regions of the genome. FASTQC is the standard tool for checking the quality of data generated on the platform. FASTQC takes FASTQ files as input data downloaded from repository databases. FASTQC consists of 12 modules in the left menu each checking a specific aspect of the quality of the data. Different parameters on the basis of which the read can be considered good or bad are basic statistics, per-base sequence quality, per-title sequence quality, per-sequence quality scores, per-base sequence content, per-sequence GC content, per-base N content, sequence length distribution, sequence duplication levels, overrepresented sequences, adapter contents and k mer content which can be used depending on the user’s choice. Other tools, for example, SolexaQA package (http://solexaqa.sourceforge.net/), PRINSEQ (https://sourceforge.net/projects/prinseq/) and FASTX-Toolkit differ both in convenience and in capability. For example, SolexaQA package comes in three command-line components that need to be run successfully to perform both quality check and trimming, while PRINSEQ is available as either a command-line program or via web-interface. FASTX-toolkit has a drawback that it can only process one FASTQ variant and requires further processing step to link paired reads. On other hand, PRINSEQ is used for pre-processing but is not efficient for large datasets in terms of runtime and memory usage. It also fails to remove unwanted, low-quality reads and requires an additional step to pair the trimmed reads for downstream applications. Apart from the aforementioned demerits, these tools do not incorporate advantage of multiprocessor in their functioning. Keeping these limitations in mind, these tools can become severely time-consuming and can fail to handle large datasets. The advent of fast sequencing techniques demands more efficient and adaptable software solutions.
In order to address some limitations listed above, efficient, parallelized, widely used scalable tool SEAL (Pireddu et al. Citation2011) was developed which assesses quality of NGS data along with short read pair mapping and removal of duplicate reads. The tool has several advantages above other quality-checking tools. It computes mappings consistent with the output of BWA and is capable of processing large set of data of approximately 19 GB reads per hour. The reads generated from the fragmented DNA need to be post-processed for further analysis. PairReadsQSeq can filter read pairs that fail to meet certain quality criteria like the sample having less known bases and those which failed to meet the sequencing machine’s quality check. Reads output from the sequencing machine often contain bases that could not be sequenced. The threshold value of PairReadsQSeq has been set in such a way that the known pair only gets selected which has more than 30 bases in number. The values of failed and passed reads are stored in QSeq files (0: failed check; 1: passed check), and in FASTQ files, the Y/N filtered flag stores the sorted filtered and discarded output. Orione is a part of an ongoing project which integrates Galaxy with Hadoop-based tools to provide scalable computing. Orione complements the flexible Galaxy workflow environment, allowing users to consistently access set of NGS data analysis tools and conduct reproducible data-intensive computational analysis from quality control to microbial gene annotation (Gianmauro et al. Citation2014).
Mapping/alignment
The alignment of the large number of short sequence reads produced by NGS platform is a challenge. These short sequenced fragments, also known as ‘reads’, are aligned against a previously constructed genome, known as ‘reference’ genome. Their positions within the reference sequence must be determined. This process is known as aligning/mapping the read to the reference genome. There are two versions of mapping – ‘Short-read aligners’ and ‘Spliced-read aligners’. In the former version of the mapping problem, reads must be aligned without allowing large gaps in the alignment and in latter alignments, they are allowed to have large gaps corresponding to introns. New software packages are being designed to meet the computational challenges of alignment (Jing et al. Citation2014).
Mapping of short sequence fragments to the genome is a complicated process. Aligning the reads from various NGS experiments can engage large space central processing unit (CPU) hours by using simple conventional tools like BLAST or BLAT. Maq and Bowtie are short-read aligners, which are categorized as fast aligners using ‘indexing’ strategy to speed up the process. Maq uses ‘space seed indexing’ mapping algorithms, whereas Bowtie uses ‘Burrow–Wheeler transform’-based indexing algorithm. Unlike Maq’s alignment algorithm, Bowtie’s is substantially more complicated, and also the alignment speed is more than 30-fold faster (Heng and Durbin Citation2010).
Spliced mapping tool requires more specialized algorithms to align sequences (cDNA from processed mRNA) back to genomic DNA. Reads that are contained entirely within exons and those sampled from exon–exon junctions follow a different mapping strategy. To align cDNA reads from RNA-seq experiments, packages such as ERANGE make the best of exonic and intronic position within known genes (Ali et al. Citation2008). Another splice-aware aligner, TopHat, uses Bowtie to identify exons instead of relying on annotations. The current solutions for short read-mapping all have limitations. Mapping programs like Maq and Bowtie offer very limited support for aligning reads with insertions or deletions (indels). Some reads mappers, such as SHRiMP, support ABI’s ‘color space’ sequence representation, but most of them do not. Machine learning methods are prone to overtraining and if trained on incorrect annotations, they show low performance. The spliced alignment program suffers from these same problems and adds a few of their own (Stephen et al. Citation2009).
In the world of NGS, there are few Hadoop-based frameworks available such as CloudBurst and CrossBow that leverage Hadoop to perform ‘read mapping’. Myrna and Eoulson do the same but also extend the workflow to quantify gene expression and to identify differentially expressed genes based on the sequences. Seqal, an application that works on sequence, has been developed by SEAL. Seal, in combination with BWA, detects and removes duplicate reads. Seal harnesses the Hadoop MapReduce framework to efficiently distribute input and output files across cluster nodes and to guarantee algorithms’ reliability by resisting node failures and transient events such as peaks in cluster load. Seqal implements MapReduce, which runs on the Hadoop framework.
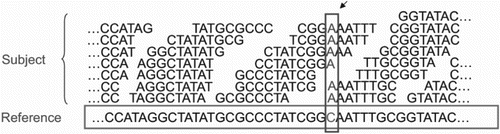
Although these tools are highly effective in their domains, there still exists a large development gap between sequencing output and analysis results. When the reference genome of an organism is available, reference-guided assembly is the most preferred choice. Softwares and platforms like CloudBurst (Schatz Citation2009), DistMap (Pandey and Schlötterer Citation2013), Eoulsan (Jourdren et al. Citation2012), Galaxy (Pireddu et al. Citation2014) generate reference assembly before proceeding toward specific analysis. Quake package is used to correct substitution-sequencing errors in experiments with deep coverage. The errors can be located by determining the positions of erroneous and genuine k-mer. Quality values of the reads indicate the frequency and quality of nucleotide error rates. The tool has higher efficiency and accuracy, which avoid mis-corrections and false result interpretations (Kelley et al. Citation2010). CloudBurst is a new open-source form of Hadoop implementation of MapReduce algorithm to parallelize execution of read-mapping using multiple compute nodes. Hadoop-based techniques are developed for mapping NGS data to the human genome and other organism’s reference genomes. It is based on the simple alignment program RMAP, and results show the best alignment with any number of mismatches or differences (Figure ) (Taylor Citation2010). Cloudera is also highly referred for genome mapping and alignment of sequences with the reference genome (Schatz Citation2009; Mantha et al. Citation2012).
Figure 5. MapReduce, for short read mapping. Many subject reads are aligned with the reference using multiple compute nodes and detects variation. In this figure, nucleotide shown in the box depicts the variants.
DistMap is another mapping pipeline based on HDFS. It is an easy-to-use, efficient and scalable tool to map reads. The tool has an advantage over other mapping tools that it supports nine different short read mapping tools. The input reads provided to the framework must be in the FASTQ format; in contrast, the output generated is in the SAM/BAM format. The most accepted quality of the tool is that it supports both paired-end and single-end data (Pandey and Schlötterer Citation2013). Galaxy, an open-source, web-based platform, is used to manipulate biomedical data interactively. Galaxy provides an environment for smoothly carrying out NGS analysis such as quality checking, mapping, peak-calling, variant analysis and RNA-sequencing. It converts FASTQ file format into FASTA format, removes artifacts, clip and trim adapter sequences, maps short reads against reference sequences, detects significant SNPs in case–control data, visualizes genomic data with the Hilbert curve, identifies ChIP-enriched regions and does many more functions. Apart from the facility offered by the Galaxy, the major drawback suffered using the tool is that that every input and output is a file, inhibiting processing of data as a stream. For big data processing, this creates delays and large datasets need periodical filtering (https://usegalaxy.org/).
Eoulsan, based on MapReduce algorithm dedicated for NGS data analysis, distributes the job into clusters making maximum number of softwares available for processing and analysis of these data. Eoulsan performs RNA-seq analysis and also supports paired- end reads processing (http://transcriptome.ens.fr/eoulsan/). FX runs on local Hadoop clusters and is useful for the analysis of RNA-seq data and de novo transcriptome assembly annotations. The major advantage of the framework is that it offers a transcriptome-based reference primarily for mapping short RNA-seq reads, an approach which minimizes the alignment error of reads originating from splicing junctions (http://fx.gmi.ac.kr) (Hong et al. Citation2012). The comparison between mapping tools and environment supporting these tools Crossbow, SEAL, Eoulson, FX, DistMap, and Galaxy is given in Table .
Table 2. Comparison of different features between packages – Crossbow, Seal, Eoulsan, FX, Distmap and Galaxy specifically used for distributed mapping.
Refining the alignment output – The SAM output file contains alignment information of all reads to the reference in a standard format. Since this file is relatively big in size, converting it to its binary counterpart BAM helps in saving space and it also happens to be the input format for further refinement tools like SAMtools (Trapnell and Salzberg Citation2010). Hadoop-BAM is a command line-based tool similar to SAMtools. This tool manipulates files in common bioinformatics format using the Hadoop MapReduce framework with the Picard SAM JDK. The file formats currently supported are SAM, BAM, FASTA, FASTQ, QSEQ, VCF and BCF (Niemenmaa et al. Citation2012).
In addition, there are the projects that attempt to build a Hadoop infrastructure for NGS. These include Seal, which provides ‘map-reducification’ for a number of common NGS operations; Hadoop-BAM, which process BAM files based on Hadoop architecture, a common sequence alignment format; and SeqPig which allows common genomic sequence formats to be used in a high-level programming environment for MapReduce.
Assembly
NGS assemblers are organized into three categories based on graphs (overlap graph, K-mer graph and greedy graph). The first category, Overlap/Layout/Consensus (OLC) method, is based on overlap graph; the second category de Brujin Graph (DBG) uses K-mer graph and the third category includes both OLC and DBG method which rely on greedy graph algorithms (Xianwen et al. Citation2012). There are different number of tools developed based on the type of graph being implemented to construct genome assembly. SSAKE and SHARCGS are short-read assembler designed for unpair, uniform length short reads (Juliane et al. Citation2007; Warren et al. Citation2007). Newbler software distributed by 454 Life Sciences is based on Celera assembler and Euler software developed for Sanger reads, 454 GS20 reads and Illumina/Solexa reads is a de Brujin graphs assembler (Alexander Citation2014). Velvet is the frequently used DBG assembler that targets de novo assembly of Solexa reads and SOLiD reads. Velvet is very convenient to use, it simplifies the graph by converting non-intersecting paths to single nodes. It is prone to error since it lacks an error-avoidance read filter, but it is still is the most preferred assembler because it makes use of heuristics approach that successfully reduces the graph’s complexity (Zerbino and Birney Citation2008). The AbySS assembler exploits paired-end reads to merge contigs without building scaffolds. SOAP implements large-genome that merges OLC and DBG techniques for assembling NGS reads (Jared et al. Citation2009).
Reads output of future sequencers will challenge assembly software in many ways. Memory requirements will preclude most of the assemblers from assembling very large-sized genomes, repetitive sequences and less homogeneous samples. Moreover, the NGS technology, which produces huge amount of fragmented genome reads, will require large amount of memories to assemble the complete genome efficiently. Simultaneously, assembly developers will be challenged to extract more useful information from each sequence and produce higher yield. The quest for more powerful assembly software will force the developers to implement de novo assembly algorithms for analyzing significantly altered genomes. Transcriptome assembly is a more complex and computationally challenging field because alternative splicing produces many isoforms that require traversing a multi-path graph. The JigsaeSeq method uses Illumina platform for profiling the full-spectrum of multiple gene-variant libraries via computational assembly of short reads. Contrail does Hadoop-based de Brujin graph-based assembly. These essentially implement MapReduce algorithm to the existing assemblers. Contrails is a much more efficient tool that offers opportunity for research groups to access random access-memory-rich computers to perform assembly on commodity clusters. These clusters with high-end multicore processors will aid to store the voluminous data structure of the assembly algorithm. CloudBrush is a distributed genome assembler based on string graphs and MapReduce framework, and includes a novel edge-adjustment algorithm to detect structural defects by examining the neighboring reads of a specific read for sequencing errors and adjusting the edges of the string graph. CloudBrush has two important measures – precision and recall rates – to address the issues of faithfully aligned contigs to target genomes.
Visualization of sequenced reads
Visualizing read alignments is the most effective way to validate candidate structural variants (SVs) with the existing dataset. The application also enables the visualization and analysis of mapped sequence data including locating chromosomes, exons, introns and so on. Reports containing data and genome annotation can also be created. Aiming to provide an integrated solution for both visualization and analysis of deep-sequencing data, along with simple access to public datasets, SeqMonk is a tool used for visualization of mapped reads against an annotated genome. It also helps to compare the mapped reads between two datasets and do the statistical analysis to find the specific region of interest. STAR represents a next-generation data exploration solution to match the requirements of NGS data, enabling both intuitive visualization and dynamic analysis of data. It is a lightweight, high-performance graphical viewer for next-generation sequence assemblies and alignments. Supporting a range of input assembly formats, Tablet provides high-quality visualizations showing data in packed or stacked views, allowing instant access and navigation to any region of interest, and whole contig overviews and data summaries. Tablet is both multi-core aware and memory efficient, allowing it to handle assemblies containing millions of reads, even on a 32-bit desktop machine. IGV is a high-performance viewer that efficiently handles large heterogeneous datasets, while providing a smooth and intuitive user experience at all levels of genome resolution. A key characteristic of IGV is its focus on the integrative nature of genomic studies, with support for both array-based and NGS data, and the integration of clinical and phenotypic data. Although IGV is often used to view genomic data from public sources, its primary emphasis is to support researchers who wish to visualize and explore their own datasets or those from colleagues. To that end, IGV supports flexible loading of local and remote datasets, and is optimized to provide high-performance data visualization and exploration on standard desktop systems (Helga et al. Citation2013).
The alignments can also be viewed using one of the many browsers available based on MapReduce framework. Genome Analysis Toolkit (GATK) (McKenna et al. Citation2010) is a functional programming analysis kit based on MapReduce framework, which provides analysis report with accuracy; it is fast, efficient, with minute flexibility and the output obtained can be efficiently distributed to other users enhancing its effectiveness. GATK has varied functions to play, implementing variant calls such as SNPs and SNVs. GATK programming framework has already been incorporated into large-scale sequencing projects like the 1000 Genomes Project and The Cancer Genome Atlas Project (Aaron et al. Citation2010).
NGS data analysis
NGS has a wide range of applications; WGS and targeted resequencing are two key DNA sequencing methods. WGS, the most comprehensive method for analyzing the genome, can aid in identifying inherited disorders, characterizing the mutations that drive cancer progression, and in tracking disease outbreaks. It can be used to detect small variants (SNPs, MNPs, InDels) and large structural variants (insertions, deletions, inversions and translocations). Variants can be further annotated with SNP database to identify the effect on transcripts of non-synonymous coding SNPs (Rong et al. Citation2010). GO and pathway analysis can be additionally done on the set of affected genes. In count, copy number variations can be detected using condition-specific datasets. Finding genes that are differentially expressed between conditions is an integral part of understanding the molecular basis of phenotypic variation. In the past decades, DNA microarrays have been used extensively to quantify the abundance of mRNA corresponding to different genes, and more recently, high-throughput sequencing of cDNA (RNA-seq) has emerged as a powerful competitor. As the cost of sequencing decreases, it is conceivable that the use of RNA-seq for differential expression analysis has increased rapidly. To exploit the possibilities and address the challenges posed by this relatively new type of data, a number of software packages have been developed, especially for differential expression analysis of RNA-seq data (Charlotte and Delorenzi Citation2013).
Discovering genomic variations
A new statistical method for analyzing the NGS data is at its pace. Finding genomic variations in genome is one of the most common objectives of a resequencing project. Using a standard variant caller, genomic variations like SNPs and INDELS can be obtained from the alignment of the BAM file. The first step in genotype and SNP calling is calculation of quality scores using available tools. The recommended parameter in GATK or SOAPsnp for the QC in variant calling sequences is ‘per-base quality scores’. After the quality check process, alignment is done which requires incorporation of data from all individuals in the sample simultaneously. Likelihood ratio tests or Bayesian procedures are suitable algorithms for SNP calling which estimate the distribution of allele frequencies present in the dataset followed by including other data multiple individuals in a Bayesian framework. Also, the Linkage Disequilibrium-based methods should be used to improve the accuracy of genotype and SNP calls, which have higher significance in establishing a correlation among genes.
SOAPsnp is a member of the Short Oligonucleotide Analysis Package. SOAPsnp aligns the raw sequencing reads on the known reference genome (using SOAPaligner) and assembles consensus sequence for the genome of a newly sequenced individual. The SNPs can further be identified through the comparison with the reference genome. A related arrangement-based recalibration calculation has been actualized in the GATK software package, which consists of a few covariates, for example, machine cycle and dinucleotide context. For all probable non-polymorphic sites, the bases that align to those sites are put into various classifications characterized by the accompanying elements: the raw quality scores, the position of the base in the read, the dinucleotide context and the read group. For every class, the algorithm gauges the empirical quality score by utilizing the quantity of mismatches against the reference genome for different subsets of features. If SNPdb of some species is missing, then one can first identify candidate polymorphic sites and use the remaining sites in the recalibration procedure and can do SNP calling using the recalibrated quality scores (Heng et al. Citation2008). Hydra is another tool which detects structural variation (SV) breakpoints by clustering discordant paired-end alignments whose ‘signatures’ corroborate the same putative breakpoint caused by all classes of SV (Quinlan et al. Citation2010).
Variant identification is followed by the annotation to predict functional significance of related genes and transcripts. The rest can be further compared with the existing databases to recognize novel missense changes. These changes can act as a biomarker for future studies and can be linked with diseases (Karchin Citation2009). To enhance the research process, cloud computing-facilitated MapReduce framework can be leveraged to parallelize existing serial implementations of sequence alignment and genotyping algorithms-based methods. This combination facilitates the rapid and efficient analysis equipped with accuracy to parallelize the computation, which can handle large datasets of DNA sequences. Varscan is a popular tool for finding variations from a reference assembly (Koboldt et al. Citation2012). Similarly, Knome provides minute details of human genome interpretation systems and services (http://www.knome.com/). It can easily report variations in a person’s genome when compared with the standard reference genome, providing annotation from a large collection of reference data. Crossbow is a scalable software pipeline (Figure ) for whole-genome resequencing analysis, which is based on implementation of the MapReduce utility of Apache Hadoop framework (Gurtowski et al. Citation2012). It combines Bowtie, an ultra-fast, memory-efficient short read aligner, and SoapSNP, an accurate genotyper (Langmead et al. Citation2010). It is a scalable, portable and automatic cloud computing tool for identifying SNPs from high-coverage, short-read resequencing data. Hadoop allows Crossbow to distribute read alignment and SNP calling subtasks over a cluster of commodity computers. The output of the pipeline is more accurate and faster than the one achieved in the prior SOAPsnp study considering filtering stringencies. For example, a deep-coverage human resequencing project on a conventional single computer requires 2–3 weeks of time to analyze the dataset. This process can be geared up taking advantage of commodity processors available via cloud computing services of Crossbow that aligns and calls SNPs from the same dataset in <3 h on a 320-core cluster.
Figure 6. A working pipeline of Crossbow used for whole genome resequencing combines Bowtie, for short read aligner, SoapSNP for identifying SNPs from high-coverage, short-read resequencing data. Hadoop allows Crossbow to distribute read alignment and SNP calling subtasks over a cluster of commodity computers.
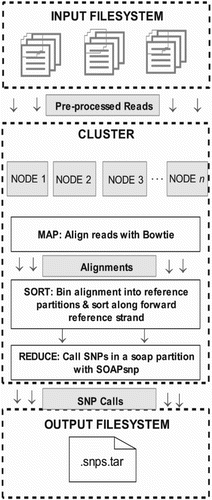
Differential expression analysis
Expression analysis estimation of gene by sequencing technique is currently one the most popular and computationally adequate tasks above other applications. Sequencing the reads of a given sample and rendering it by means of quantification by estimating the abundance of each transcript, post to looking for mapping ambiguities and sequencing errors issues is the center idea lying behind the expression analysis (Ali et al. Citation2008). One of the fundamental approaches especially for gene expression studies involves determining whether there is evidence that counts for a transcript or exon are significantly different across different experimental conditions such as control versus treatment, wild versus mutant and diseased versus non-diseased. Soneson and Delorenzi, in their review article, have given a detailed account of comparative differential expression analysis tools. DESeq, edgeR, NBPSeq, TSPM, baySeq, EBSeq, NOISeq, SAMseq and ShrinkSeq work on count data directly. edgeR examines differential expression of replicated count data using negative binomial distribution algorithms like DESeq tools. edgeR is a Bioconductor software package. HTSeq-count is a tool that preprocesses RNA-Seq data for differential expression analysis by counting the overlap of reads with genes. Most of the tools use an over dispersed Poisson model to account for biological variability; some are dependent on Empirical Bayes methods to moderate the degree of over dispersion across transcripts, involving the reliability of interference. NOISeq creates an empirical distribution of count changes adapted to the available data, from which the probability of differential expression for each feature can be derived. Voom and VST combine limma package for differential expression analysis.
No single method for DE analysis of RNA-seq data is optimal under all circumstances. Therefore, the selection of package depends on the experimental conditions. One must consider large number of replicates (say above 5) to avoid any caution while performing statistical testing. In case of less number of replicates, limma and DESeq methods seem to work fine in terms of the consistency of the detections. NOIseq and Cuffdiff 2 are two softwares which support dataset with less number of replicates (say above 3). However, DESeq and limma are best suited for less homogeneous human data. Thus, it would be important for the users to familiarize themselves with the general relationships between and within each sample group interpreting the results involving lowly expressed genes. The adopted normalization method also has little influence on the outcome of the analysis. The updated versions of several tools and pipelines are being developed; this fact illustrates that the field is still subject to extensive development.
The performance ability of the reported software differs. Most of them are installed with computationally challenging process on different operating systems. In general, R/Bioconductor-based packages (like edgeR) are the easiest to install. To overcome the shortcomings of the packages, the analysis requires large computer clusters. The output of the DE analysis in the form of processed data is of mammoth size; these annotation files need a separate space to be stored. Outsourcing data analysis over cloud computing infrastructure is one alternative. The number of softwares with distributed algorithm is limited; Eoulson, being an open-source framework, is one among them facilitating high-throughput sequencing data. This software has been developed in order to automate the analysis of large numbers of samples at once, simplifying the configuration of the cloud computing infrastructure and working with various already available analysis solutions. Myrna is a widely used cloud computing tool for finding differential gene expression analysis using RNA-seq datasets. It handles large RNA-seq data, runs in the cloud using Amazon Elastic MapReduce on a local Hadoop cluster, or on a single computer, exploiting multiple computers and CPUs (Langmead et al. Citation2010). It is capable of doing short read alignment with the help of Bowtie. The normalization and statistical testing are performed using R/Bioconductor. The Myrna pipeline overdoes the conventional approaches (like ERANGE and Cufflinks) for RNA-seq analysis. ERANGE includes splice junctions based on the uniquely aligned reads, but is statistically not much significant as compared to Cufflinks. Cufflinks is successful in fully assembling the transcriptome. Myrna focuses on the somewhat simpler problem of differential expression analysis between genes, but uses more sophisticated statistical models and integrates the analysis in a computationally efficient pipeline (Figure ).
Figure 7. A working flowchart of NGS data analysis and the uses of various associated tools/pipelines.
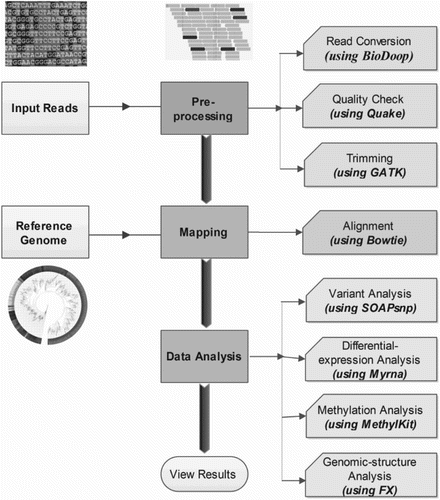
With these existing solutions as shown in Table , cloud-based computing has recently emerged as a best alternative to store large-scale data generated from ongoing data-hungry sequencing projects. Furthermore, to store, transfer, analyze, visualize and generate ‘short’ reports, various pipelines are being developed for facilitating the research work being carried out in different laboratories. To collect data, to store and to analyze it, NCBI, being a leading database, has been relying on use of Big Data as a comprehensive, inexpensive and secure solution. Other than the storage, data transfer from one location to another is also a challenging task, which was recently manifested by the use of BioTorrents. It transfers scientific data and allows open-access sharing of data utilizing peer-to-peer network model. BioTorrents allows files to be transferred rapidly due to the sharing of bandwidth across multiple institutions. The built-in error-checking facility available with BioTorrents ensures a secure transfer with industry standard encryption algorithm, facilitated by breaking up the dataset into smaller pieces, and sharing among computers with full or partial copies of the dataset. To allow faster transfer and decentralization of the data, genomic repositories like GenBank are also using BioTorrents (Langille and Eisen Citation2010).
Table 3. List of tools/applications based on Hadoop-distributed computing framework.
Conclusion
Rapidly dropping sequencing costs and the ability to produce large volumes of data with today’s sequencers make NGS a powerful tool for genomics research. Hadoop-based big data applications are facilitating NGS analytics and allowing users to rapidly interrogate very large datasets in a parallelized-distributed manner. These developments have helped researchers to modify the existing technology with latest framework and raised the opportunities to learn more about the genetics of human disease as well as prediction of one’s own health, sequencing microorganisms, identifying variants, raising stress-/drought-/pest-tolerant plants and so on. HGP, which was launched with the aim to sequence large parts of the genome considering 1,000 humans around the world, has created big consortiums of data with thousands of genomes altogether using trivial sequencing methods. Moreover, the NGS platforms are capable of sequencing millions of reads in parallel, leading to the production of several terabytes of raw signal data, corresponding to several hundreds of gigabytes of sequence data, in one week on a single machine run. The urge for effectively tackling these data has led to an expanded enthusiasm in approaches toward parallelization and dispersed execution of annotation pipelines.
By employing big data technologies, the aim is to develop an improved version of NGS analytics, which could provide filtering, mapping and analysis for very large datasets in a shorter time span. Outlook framed on a technical perspective depicts that no NGS data are error-free; this arise due to differences in the sequencing platforms and the variation in the formats supported by these sequencers. Therefore, the customized software packages and data handling tools for these NGS data need to be accurate apart from being faster. The current series of big data processing tools gives a promisingly accurate and faster capabilities for the analysis of these high-throughput sequencing data to reveal hidden patterns in sequencing, bio molecule interactions, regulatory monitoring and so on. The APACHE-based framework, Hadoop provides an interesting and adaptable environment for substantial scale data analysis on clusters of commodity hardware in a fault-tolerant manner. Packages based on MapReduce framework have leveraged the performance of various NGS quantification and analysis jobs.
As the research area is expanding with high speed, more libraries are moving toward the cloud services; hence, we can say that the technology has entered into the second phase of its life cycle dominating the IT paradigm. Lack of knowledge is the biggest hurdle in adopting cloud services. This article will help its reader to understand what the ‘cloud’ is all about and support them in investigating whether cloud solutions are right for their analysis or not. The advantages of cloud computing-based software are that they can be operated from mobile phones, tablets, laptops by downloading the service apps neglecting the use of sophisticated computers with large memory size supporting specialized complicated softwares. Technology comes with drawbacks, so is the case with cloud computing. The major disadvantages are reliability, security, privacy and compatibility, which are being addressed. We hope our readers will come out with solutions in the process of attaining these goals.
Acknowledgment
We wish to thank Department of Bioinformatics, IIIT-Allahabad for facilitating the computational resource.
Disclosure statement
No potential conflict of interest was reported by the authors.
References
- Aaron M, Hanna M, Banks E, Sivachenko A, Cibulskis K, Kernytsky A, Garimella K. 2010. The genome analysis toolkit: a MapReduce framework for analyzing next-generation DNA sequencing data. Genome Res. 20(9):1297–1303. doi: 10.1101/gr.107524.110
- Akalin A, Kormaksson M, Li S, Garrett-Bakelman FE, Figueroa ME, Melnick A, Mason CE. 2012. Methylkit: a comprehensive R package for the analysis of genome-wide DNA methylation profile. Genome Biol. 13:R87. 10.1186/gb-2012-13-10-r87 doi: 10.1186/gb-2012-13-10-r87
- Alexander NJ. 2014. On the middle ground between open source and commercial software – the case of the Newbler program. Genome Biol. 15(4):113. doi: 10.1186/gb4173
- Ali M, Williams BA, McCue K, Schaeffer L, Wold B. 2008. Mapping and quantifying mammalian transcriptomes by RNA-seq. Nat Methods. 5(7):621–628. doi: 10.1038/nmeth.1226
- Amanda BJ, Bending GD, Chandler D, Hilton S, Mills P. 2012. Meeting the demand for crop production: the challenge of yield decline in crops grown in short rotations. Biol Rev. 87:52–71.
- Ambros V. 2001. microRNAs: tiny regulators with great potential. Cell. 107:823–826. doi: 10.1016/S0092-8674(01)00616-X
- Androniki P, Dovas CI, Bramis G, Lazou T, Russel CL, Arsenos G, Banos G. 2015. Comparison of eleven methods for genomic DNA extraction suitable for large-scale whole-genome genotyping and long-term DNA banking using blood samples. PLoS ONE. 10(1).
- Bainbridge MN, Wang M, Wu Y, Newsham I, Muzny DM, Jefferies JL, Albert TJ, Burgess DL, Gibbs RA, Bainbridge, et al. 2011. Targeted enrichment beyond the consensus coding DNA sequence exome reveals exons with higher variant densities. Genome Biol. 12:R68. doi: 10.1186/gb-2011-12-7-r68
- Bashir Y, Singh SP, Konwar BK. 2014. Metagenomics: an application based perspective. Chinese J Biol. 146030.7.
- Bentley DR. 2004. Genomes for medicine. Nature. 429:440–445. 10.1038/nature02622 doi: 10.1038/nature02622
- Brown SM. 2012. Sequencing-by-synthesis: explaining the illumina sequencing technology. Next Generation Sequencing.
- Caboche S, Audebert C, Hot D. 2014. High-throughput sequencing, a versatile weapon to support genome-based diagnosis in infectious diseases: applications to clinical bacteriology. Pathog. 3(2):258–279. 10.3390/pathogens3020258 doi: 10.3390/pathogens3020258
- Charlotte S, Delorenzi M. 2013. A comparison of methods for differential expression analysis of RNA-seq data. BMC Bioinformatics. 14(1):91. doi: 10.1186/1471-2105-14-91
- Chou H-C. 2012. Local assembly and pre-mRNA splicing analyses by high-throughput sequencing data. Graduate Theses and Dissertations. p. 12819.
- Cole T, Roberts A, Goff L, Pertea G, Kim D, Kelley DR, Pimentel H, Salzberg SL, Rinn JL, Pachter L. 2012. Differential gene and transcript expression analysis of RNA-seq experiments with TopHat and Cufflinks. Nat protoc. 7(3):562–578. doi: 10.1038/nprot.2012.016
- Corney DC. 2013. RNA-seq using next generation sequencing. Mater Methods. 3:203. doi: 10.13070/mm.en.3.203
- Costa FF. 2012. Big data in genomics: challenges and solutions. G.I.T. Laboratory Journal.
- D’Antonio M, De Meo PD, Pallocca M, Picardi E, D’Erchia AM, Calogero RA, Castrignanò T, Pesole G. 2015. RAP: RNA-Seq analysis pipeline, a new cloud-based NGS web application. BMC Genomics. 16(6):S3. doi: 10.1186/1471-2164-16-S6-S3
- David C, Chapman P, Trawley S, Collins L, Van Loon E, Andrews B, Underwood G. 2012. Some hazards are more attractive than others: drivers of varying experience respond differently to different types of hazard. Accident Anal Prev. 45:600–609. doi: 10.1016/j.aap.2011.09.049
- Diroma MA, Calabrese C, Simone D, Santorsola M, Calabrese FM, Gasparre G, Attimonelli M. 2014. Extraction and annotation of human mitochondrial genomes from 1000 genomes whole exome sequencing data. BMC Genomics. 15(Suppl 3):S2. doi:10.1186/1471-2164-15-S3-S2
- Dominissini D, Moshitch-Moshkovitz S, Salmon-Divon M, Amariglio N, Rechavi G. 2013. Transcriptome-wide mapping of N6-methyladenosine by m6A-seq based on immunocapturing and massively parallel sequencing. Nat Protoc. 8:176–189. doi: 10.1038/nprot.2012.148
- Doug H. 2012. Cloudera releases next-generation Hadoop platform. Information Week.
- Elfving N, Razvan V, Bharatula CV, Bjorklund S, Morozov A, Broach J. 2014. A dynamic interplay of nucleosome and Msn2 binding regulates kinetics of gene activation and repression following stress. Nucleic Acids Res. 10.1093/nar/gku176
- Esmon CT. 2000. Regulation of blood coagulation. Biochim Bioph Acta. 1477(1–2):349–360. doi: 10.1016/S0167-4838(99)00266-6
- Euskirchen GM, Rozowsky JS, Wei CL, Wah HL, Zhang ZD, Hartman S, Emanuelsson O. 2007. Mapping of transcription factor binding regions in mammalian cells by ChIP: comparison of array- and sequencing-based technologies. Genome Res. 17(6):898–909. doi: 10.1101/gr.5583007
- Fei Y. 2013. DNA sequencing, Sanger and next-generation sequencing. Singapore: Genome Institute of Singapore.
- Feng X, Grossman R, Stein L. 2011. PeakRanger: a cloud-enabled peak caller for ChIP-seq data. BMC Bioinformatics. 12:139. doi:10.1186/1471-2105-12-139
- Franca LTC, Carrilho E, Tarso B. 2002. A review of DNA sequencing techniques. Q Rev Biophys. 35(2):169–200. doi: 10.1017/S0033583502003797
- Gaggero M, Leo S, Manca S, Santoni F, Schiaratura O, Zanetti G. 2008. Parallelizing bioinformatics applications with MapReduce. Cloud Computing and Its Application. 1–6.
- Generation C. 2010. Illumina sequencing technology. Rochester, NY: Image. Vol. 21; p. 1–5.
- Gianmauro C, Orsini M, Pinna A, Sbardellati A, Soranzo N, Travaglione A, Uva P, Zanetti G, Fotia G. 2014. Orione, a web-based framework for NGS analysis in microbiology. Bioinformatics. 30(13):1928–1929. doi: 10.1093/bioinformatics/btu135
- Gonzaga-Jauregui C, Lupski JR, Gibbs RA. 2012. Human genome sequencing in health and disease. Annu Rev Med. 63(1):35–61. doi: 10.1146/annurev-med-051010-162644
- Grada A, Weinbrecht K. 2013. Next-generation sequencing: methodology and application. J Invest Dermatol. 133:e11. doi:10.1038/jid.2013.248
- Gregory CJ, Lauber CL, Walters WA, Berg-Lyons D, Huntley J, Fierer N, Owens SM. 2012. Ultra-high-throughput microbial community analysis on the Illumina HiSeq and MiSeq platforms. ISME J. 6(8):1621–1624. doi: 10.1038/ismej.2012.8
- Großhans H, Friedrich Miescher Ins. 2010. Regulation of microRNAs, Landes Bioscience Espringer.
- Guerreiro R, Bras J, Hardy J, Singleton A. 2014. Next generation sequencing techniques in neurological diseases: redefining clinical and molecular associations. Hum Mol Genet. doi:10.1093/hmg/ddu203
- Gullapalli RR, Desai KV, Santana-Santos L, Kant JA, Becich MJ. 2012. Next generation sequencing in clinical medicine: challenges and lessons for pathology and biomedical informatics. J Pathol Inform. 3:40. doi:10.4103/2153-3539.103013.
- Gurtowski J, Schatz MC, Langmead B. 2012. Genotyping in the cloud with crossbow. Curr Protoc Bioinformatics. doi:10.1002/0471250953.bi1503s39
- Haas BJ, Papanicolaou A, Yassour M, Grabherr M, Blood PD, Bowden J, Couger MB. 2013. De novo transcript sequence reconstruction from RNA-seq using the trinity platform for reference generation and analysis. Nat Protoc. 8:1494–1512. doi:10.1038/nprot.2013.084
- Head R, Steven R, Komori K, LaMere SA, Whisenant T, Van Nieuwerburgh F, Salomon DR, Ordoukhanian P. 2014. Library construction for next-generation sequencing: overviews and challenges. Biotechniques. 56(2):61–77.
- Helga T, Robinson JT, Mesirov JP. 2013. Integrative Genomics Viewer (IGV): high-performance genomics data visualization and exploration. Bioinform. 14(2):178–192.
- Heng L, Durbin R. 2010. Fast and accurate long-read alignment with Burrows-Wheeler transform. Bioinformatics. 26(5):589–595. doi: 10.1093/bioinformatics/btp698
- Heng L, Ruan J, Durbin R. 2008. Mapping short DNA sequencing reads and calling variants using mapping quality scores. Genome Res. 18(11):1851–1858. doi: 10.1101/gr.078212.108
- Henk BPJ, Ariyurek Y, van Ommen G, den Dunnen JT, ‘t Hoen PAC. 2010. New methods for next generation sequencing based microRNA expression profiling. BMC Genomics. 11:716. doi: 10.1186/1471-2164-11-716
- Hong D, Rhie A, Park S-S, Lee J, Ju YS, Kim S, Yu SB, Bleazard T, Park HS, Rhee H, et al. 2012. FX: an RNA-seq analysis tool on the cloud. Bioinformatics. 28(5):721–733. doi: 10.1093/bioinformatics/bts023
- Huang H, Pril TS. 2013. BlueSNP: R package for highly scalable genome-wide association studies using Hadoop clusters. Bioinformatic. 29(1):135–136. doi: 10.1093/bioinformatics/bts647
- Jared ST, Wong K, Jackman SD, Schein JE, Jones SJM. 2009. Inan?? Birol. ABySS: a parallel assembler for short read sequence data. Genome Res. 19(6):1117–1123. doi: 10.1101/gr.089532.108
- Jarvie T, Harkins T. 2008. Transcriptome sequencing with the genome sequencer FLX system. Nat Methods (September). 5:6–8.
- Jason Li, Maria AD, Isaam S, Stephen QW, Victoria M, David LG, Franco C, Ken D, Georgina LR, Ella RT, et al. 2014. Bioinformatics pipelines for targeted resequencing and whole-exome sequencing of human andmouse genomes: a virtual appliance approach for instant deployment. Plos ONE. doi:doi:10.1371/journal.pone.0095217
- Jing S, Zhu F, Vongsangnak W, Tang Y, Zhang W, Shen B. 2014. Evaluation and comparison of multiple aligners for next-generation sequencing data analysis. BioMed Res Int.
- John DW, Hohenlohe PA, Etter PD, Boone JQ, Catchen JM, Blaxter ML. 2011. Genome-wide genetic marker discovery and genotyping using next-generation sequencing. Nat Rev Genet. 12(7):499–510. doi: 10.1038/nrg3012
- John WC, Ye Y. 2009. Metagenomics: facts and artifacts, and computational challenges. J Comput Sci Tech. 25(1):71–81.
- Jourdren L, Bernard M, Dillies M-A, Le Crom S. 2012. Eoulsan: a cloud computing-based framework facilitating high throughput sequencing analyses. Bioinformatics. 28(11):1542–1543. doi: 10.1093/bioinformatics/bts165
- Juliane DC, Lottaz C, Borodina T, Himmelbauer H. 2007. SHARCGS, a fast and highly accurate short-read assembly algorithm for de novo genomic sequencing. Genome Res. 17(11):1697–1706. doi: 10.1101/gr.6435207
- Karchin R. 2009. Next generation tools for the annotation of human SNPs. Bioinform. 10:35–52.
- Kelley DR, Schatz MC, Salzberg SL. 2010. Quake: quality-aware detection and correction of sequencing errors. Genome Biol. 11:R116. doi:10.1186/gb-2010-11-11-r116
- Kidder BL, Hu G, Zhao K. 2012. ChIP-Seq: technical considerations for obtaining high-quality data. Nat Immunol. 918–922. doi:10.1038/ni.2117
- Koboldt DC, Zhang Q, Larson DE. 2012. VarScan 2: somatic mutation and copy number alteration discovery in cancer by exome sequencing. Genome Res. 22:568–576. doi: 10.1101/gr.129684.111
- Kornblihtt AR, Schor IE, Alló M, Dujardin G, Petrillo E, Muñoz M. 2013. Alternative splicing: a pivotal step between eukaryotic transcription and translation. Nat Rev Mol Cell Bio. 14:153–165. doi:10.1038/nrm3525
- Lam KN, Hall MW, Engel K, Vey G, Cheng J, Neufeld JD, Charles TC. 2014. Evaluation of a pooled strategy for high-throughput sequencing of cosmid clones from metagenomic libraries. PloS ONE. doi:10.1371/journal.pone.0098968
- Langille MGI, Eisen JA. 2010. BioTorrents: a file sharing service for scientific data. Plos ONE. 10.1371/journal.pone.0010071
- Langmead B, Hansen KD, Leek JT. 2010. Cloud-scale RNA-sequencing differential expression analysis with Myrna. Genome Biol. 11(8):R83. doi:10.1186/gb-2010-11-8-r83
- Leo S, Santoni F, Zanetti G. 2009. Biodoop: bioinformatics on Hadoop. Parallel processing workshops, 2009. ICPPW ‘09. International Conference on. doi:10.1109/ICPPW.2009.37
- MacArthur D. 2009. Illumina launches personal genome sequencing service for $48,000. Scienceblogs.com.
- MacFarlane L-A, Murphy PR. 2010. MicroRNA: biogenesis, function and role in cancer. Curr Genomics. 11(7):537–561. doi:10.2174/138920210793175895
- Madhavan S. 2012. It’s not ‘just’ about BIGDATA – how to get to actionable clinical knowledge from BIGDATA. Innovation Center for Biomedical Informatics Georgetown University.
- Mantha PK, Kim N, Lucknw A, Kim J, Jha S. 2012. Understanding mapreduce-based next-generation sequencing alignment on distributed cyberinfrastucture. ECMLS’12, ACM. 978-1-4503-1339-1/12/06.
- Matsunaga A, Tsugawa M, Fortes J. 2008. CloudBLAST: combining MapReduce and virtualization on distributed resources for bioinformatics applications. EScience. 10.1109/eScience.2008.62
- Matthias M, Stenzel U, Hofreiter M. 2008. Parallel tagged sequencing on the 454 platform. Nat protoc. 3(2):267–278. doi: 10.1038/nprot.2007.520
- McKenna A, Hanna M, Banks E, Sivachenko A, Cibulskis K, Kernytsky A, Garimella K, Altshuler D, Gabriel S, Daly M, DePristo MA. 2010. The genome analysis toolkit: a MapReduce framework for analyzing next-generation DNA sequencing data. Genome Res. 20:1297–1303. doi: 10.1101/gr.107524.110
- Meldrum C, Doyle MA, Tothill RW. 2011. Next-generation sequencing for cancer diagnostics: a practical perspective. Clin Biochem Rev. 32(4):177–195.
- Metzker ML. 2010. Sequencing technologies – the next generation. Nat Rev Genet. 11:31–46. doi:10.1038/nrg2626
- Mocellin S. 2007. Microarray technology and cancer gene profiling. Volume 593. ESpringer Science+Business Media, LLC Landes Bioscience/Eurekah.com.
- Morozova O, Marra MA. 2008. Applications of next-generation sequencing technologies in functional genomics. Genomics. 92(5):255–264.
- Mousumi D, Prasad GBKS, Bisen PS. 2005. Molecular diagnostics: promises and possibilities. Springer Netherlands; p. 1–520.
- Nagalakshmi U, Waern K, Snyder M. 2010. RNA-Seq: a method for comprehensive transcriptome analysis. Curr Prot Mol Biol. doi:10.1002/0471142727.mb0411s89
- Nextera Explain. Best Practices. 2013. Nextera DNA sample prep kit. Energy. 5(800):1–22.
- Nguyen T, Shi W, Ruden D. 2011. CloudAligner: a fast and full-featured MapReduce based tool for sequence mapping. BMC Research Notes. 4:171. doi:10.1186/1756-0500-4-171
- Niemenmaa M, Kallio A, Heljanko K. 2012. Hadoop-BAM: directly manipulating next generation sequencing data in the cloud. Bioinformatics. 28(6):876–877. doi: 10.1093/bioinformatics/bts054
- NIH Nes Release publisher, National Institutes of Health. 2004. International human genome sequencing consortium describes finished human genome sequence.
- O’Connor BD, Merriman B, Nelson SF. 2010. SeqWare query engine: storing and searching sequence data in the cloud. BMC Bioinformatics. doi:10.1186/1471-2105-11-S12-S2
- O’Driscoll A, Daugelaiteb J, Sleatorb RD. 2013. ‘Big data’, Hadoop and cloud computing in genomics. J Biomed Inform. 46(5):774–781. doi:10.1016/j.jbi.2013.07.001
- Pandey RV, Schlötterer C. 2013. DistMap: a toolkit for distributed short read mapping on a Hadoop cluster. Plos. doi:10.1371/journal.pone.0072614
- Park PJ. 2009. ChIP-Seq: advantages and challenges of a maturing technology. Nat Rev Genet. 10(10):669–680. doi:10.1038/nrg2641
- Patrice M. 2008. Helicos BIOSCIences. Pharmacogenomics. 9:477–480. doi: 10.2217/14622416.9.4.477
- Paul TD. 2008. Single nucleotide polymorphisms in human disease and evolution: phylogenies and genealogies. Encycl Life Sci. 1–11. doi:doi:10.1002/9780470015902.a0020763.
- Pireddu L, Leo S, Soranzo N. 2014. A Hadoop-galaxy adapter for user-friendly and scalable data-intensive bioinformatics in galaxy. ACM-BCB. doi:10.1145/2649387.264942
- Pireddu L, Leo S, Zanetti G. 2011. SEAL: a distributed short read mapping and duplicate removal tool. Bioinformatics. 27(15):2159–2160. doi: 10.1093/bioinformatics/btr325
- Pop M. 2009. Genome assembly reborn: recent computational challenges. Bioinform. 10(4):354–366. 10.1093/bib/bbp026
- Pushkarev D, Neff N, Quake S. 2009. Single-molecule sequencing of an individual human genome. Nat Biotechnol. doi:10.1038/nbt.1561
- Quail M, Miriam ES, Paul C, Thomas DO, Simon RH, Thomas RC, Anna B, Harold PS, Yong G. 2012. A tale of three next generation sequencing platforms: comparison of Ion torrent, pacific biosciences and illumina MiSeq sequencers. BMC Genomics. 13(1):p.1. doi:doi:10.1186/1471-2164-13-341
- Quinlan A, Clark R, Hall I. 2010. Genome-wide mapping and assembly of structural variant breakpoints in the mouse genome. Genome Res. 20(5):623–635. doi: 10.1101/gr.102970.109
- Raz T, Causey M, Jones DR, Kieu A, Letovsky S, Lipson D, Thayer E, Thompson JF, Milos PM. 2011. RNA-sequencing and quantitation using the helicos genetic analysis system. Methods Mol Biol. 733:37–49. 10.1007/978-1-61779-089-8_3 doi: 10.1007/978-1-61779-089-8_3
- Renkema K, Stokman M, Giles R, Knoers N. 2014. Next-generation sequencing for research and diagnostics in kidney disease. Nat Rev Nephrol. doi:10.1038/nrneph.95
- Richar W, Blainey PC, Fan HC, Quake SR. 2009. Digital PCR provides sensitive and absolute calibration for high throughput sequencing. BMC Genomics. 10:116. doi: 10.1186/1471-2164-10-116
- Roderic G, Flicek P, Abril JF, Reymond A, Lagarde J, Denoeud F, Antonarakis S. 2006. EGASP: the human ENCODE genome annotation assessment project. Genome Biol. 7(1):1–31. doi: 10.1186/gb-2006-7-1-r1
- Rong C, Davydov EV, Sirsota M, Butte AJ. 2010. Non-synonymous and synonymous coding SNPS show similar likelihood and effect size of human disease association. PLoS ONE. 5(10).
- Schatz M, Delcher AL, Salzberga SL. 2010. Assembly of large genomes using second-generation sequencing. Genome Res. 20(9):1165–1173. doi: 10.1101/gr.101360.109
- Schatz MC. 2009. CloudBurst: highly sensitive read mapping with MapReduce. Bioinformatics. 25(11):1363–1369. doi: 10.1093/bioinformatics/btp236
- Schumacher A, Pireddu L, Niemenmaa M, Kallio A, Korpelainen E, Zanetti G, Heljanko K. 2014. SeqPig: simple and scalable scripting for large sequencing data sets in Hadoop. Bioinformatics. 30(1):119–120. doi: 10.1093/bioinformatics/btt601
- Shendure J, Ji H. 2008. Next-generation DNA sequencing. Nat Biotechnol. 26(10):1135–1145. doi: 10.1038/nbt1486
- Shivakumar SK. 2013. Big Data – a big game changer. CSI Communications.
- Sol-Church K, Catalano S, Holbrook J, Stabley D, Conard K. 2009. SR1-S1 HRAS Mutations and 11p allelic imbalance in a rare case of agminated spitz nevus: bridging the gap between bench and bedside through collaborative research. J Biomol Tech. 20(1):31–89.
- Srivatsan A, Han Y, equal contributor, Peng J, Tehranchi A, Gibbs R, Wang J, Chen R. 2008. High-precision, whole-genome sequencing of laboratory strains facilitates genetic studies. PloS Genetics. doi:10.1371/journal.pgen.1000139
- Stephen RM, Lacroute P, Dalca AV, Fiume M, Sidow A, Brudno M. 2009. SHRiMP: accurate mapping of short color-space reads. PLoS Comput Biol. 5(5).
- Stephen GL, Georgi KM, Anshul K, Pouya K, Florencia P, Serafim B, Bradley EB, Peter B, James BB, Philip C, et al. 2012. ChIP-seq guidelines and practices of the ENCODE and modENCODE consortia. Genome. 22(9):1813–1831. doi: 10.1101/gr.136184.111
- Strachan T, Read AP. 1999. Identifying human disease genes. In: Human Molecular Genetics. 2nd ed. Chapter 15.
- Tanja M, Salzberg SL. 2011. FLASH: fast length adjustment of short reads to improve genome assemblies. Bioinformatics. 27(21):2957–2963. doi: 10.1093/bioinformatics/btr507
- Taylor RC. 2010. An overview of the Hadoop/MapReduce/HBase framework and its current applications in bioinformatics. BMC Bioinformatics. 11(Suppl 12):S1. 10.1186/1471-2105-11-S12-S1 doi: 10.1186/1471-2105-11-S12-S1
- Thamizhvanan R, Himabindu KS, Hyndavi N, Roopa LK. 2012. The human genome project. Int J Phar Rev Res. 2(1):31–45.
- Thomas T, Gilbert J, Meyer F. 2012. Metagenomics – a guide from sampling to data analysis. Microb Inform Exper. 2:3. doi:10.1186/2042-5783-2-3
- Totty M. 2005. A better idea. The Wall Street Journal.
- Trapnell C, Salzberg SL. 2010. How to map billions of short reads onto genomes. Nat Biotechnol. 27(5):455–457. doi:10.1038/nbt0509-455
- Turan N, Ghalwash MF, Katari S, Coutifaris C, Obradovic Z, Sapienz C. 2012. DNA methylation differences at growth related genes correlate with birth weight: a molecular signature linked to developmental origins of adult disease? BMC Med Genomics. 5:10. 10.1186/1755-8794-5-10 doi: 10.1186/1755-8794-5-10
- Van Neste C, Gansemans Y, De Coninck D, Van Hoofstat D, Van Criekinge W, Deforce D, Van Nieuwerburgh F. 2015. Forensic massively parallel sequencing data analysis tool: implementation of MyFLq as a standalone web- and Illumina BaseSpace??-application. Forensic Sci Int: Genetics. 15:2–7. doi: 10.1016/j.fsigen.2014.10.006
- Velikkakam JG, Patel V, Nordström KJV, Klasen JR, Salomé PA, Weigel D, Schneeberger K. 2013. User guide for mapping-by-sequencing in arabidopsis. Genome Biol. 14:6–61. doi: 10.1186/gb-2013-14-1-r6
- Wang L, Si Y, Dedow LK, Shao Y, Liu P, Brutnell TP. 2011. A low-cost library construction protocol and data analysis pipeline for illumina-based strand-specific multiplex RNA-Seq. PloS ONE. doi:10.1371/journal.pone.0026426
- Warren LR, Sutton GG, Jones SJM, Holt RA. 2007. Assembling millions of short DNA sequences using SSAKE. Bioinformatics. 23(4):500–501. doi: 10.1093/bioinformatics/btl629
- Watson JD. 1990. The human genome project: past, present, and future. Science. 248:44–49. doi: 10.1126/science.2181665
- White T. 2010. Hadoop: the definitive guide. O’Reilly Media/Yahoo Press.
- Xianwen R, Liu T, Dong J, Sun L, Yang J, Zhu Y, Jin Q. 2012. Evaluating de Bruijn graph assemblers on 454 transcriptomic data. PLoS ONE. 7(12).
- Ye J, Renault VM, Jamet K, Gilson E. 2014. Transcriptional outcome of telomere signalling. Nat Rev Genet. 10,15(7):491–503. doi: 10.1038/nrg3743
- Yuichi K, Shumway M, Leinonen R. 2012. The sequence read archive: explosive growth of sequencing data. Nucleic Acids Res. 40.D1.
- Zerbino R, Birney E. 2008. Velvet: algorithms for de novo short read assembly using de Bruijn graphs. Genome Res. 18(5):821–829. doi: 10.1101/gr.074492.107