
ABSTRACT
The present work aims to evaluate the relation between the antioxidant activities and phenolic compound contents of two tea samples (green and black) mixed with or without sweeteners (sucrose or aspartame). The aqueous extracts were screened for total polyphenol and flavonoids contents. Antioxidant activities of extracts were tested using 2, 2-diphenyl-1-picrylhydrazyl (DPPH) radical method and 2, 2′-azino-bis [ethylbenzthiazoline-6-sulfonic acid] (ABTS) methods using butylated hydroxyl anisole as standard compound. In addition, we identified polyphenols compounds using high performance liquid chromatography (HPLC). The results indicated that the antioxidant activity was higher against ABTS radical more than DPPH radical. Also, there is positive correlation between the antioxidant activity and phenolic compounds content presented in water extracts of tea samples. The results also indicated that addition of table sugar to green tea significantly decreased the antioxidant activity (from 95.8% to 90.6% with 4.0% sucrose). However, the same table sugar in black tea increased the antioxidant activity (from 87.0% to 91.9% with 4.0% sucrose). The analysis using HPLC showed that caffeine was the most predominant individual compounds in green and black tea without and with 1.0% sucrose (6081.8, 8772.1, 6474 and 3755 µg/100g, respectively). However, cinnamic acid showed the lowest content in the same tea samples (0.21, 0.25, 0.19 and 0.18 µg/100g respectively). Pyrogallol, catechol, epicatechin, ellagic, protocatchuic were significantly higher in green tea than in black tea.
Introduction
Tea is the most popular nonalcoholic beverage in the world (Longo et al. Citation2008; Jiang et al. Citation2015). The different types of teas (white, green, oolong and black), which all originate from the leaves of Camellia sinensis, are classified according to the degree of fermentation process; both white and green teas are unfermented. Oolong tea is semi-fermented, while black tea is fully fermented (Chan et al. Citation2011). The basic types of tea have different quality characteristics including appearance, aroma, taste and color. The manufacturing process of tea is designed to permit tea polyphenolic compounds to be oxidized by naturally occurring polyphenol oxidase in the tealeaves. Green tea is produced by inactivating the heat-labile enzyme polyphenol oxidase in fresh leaves by either applying heat or steam which prevent enzymatic oxidation of catechins (Velayutham et al. Citation2008). The health benefits of tea mainly come from its high content of phenolic compounds (Rahim et al. Citation2014; Bae et al. Citation2015; Jin et al. Citation2016). Therefore, tea extract acts as antioxidant, anticancer, cardiovascular disease or in diabetes (Jeska-Skowron et al. Citation2015), among others listed by Pinto (Citation2013). Green tea extract contains several polyphenolic components with antioxidant properties (catechins, epigallocatechin-3-gallate and epicatechin-3-gallate) in addition of amino acids (as glutamine, alanine, asparagines, arginine and serine). The umami taste of green tea is due to theanine, serine, gallic, theagallin and succinic acid (Senanyake Citation2013). The distinctive taste of black tea is due to the combination of several attributes such as bitterness, astringency, sweetness, malty taste, green/grassy taste, caramel-like and hay-like characteristics (Alasalvar et al. Citation2012). Astringent taste in black tea is due to catechins, theaflavins and flavonol glycosides (Scharbert et al. Citation2004). The regular intake of tea is associated with an improved antioxidant status in vivo that may contribute on lowering the risk of coronary heart disease, atherosclerosis, reduced mutagenicity and inflammation (Kris-Etherton & Keen Citation2002; Widlansky et al. Citation2005). Recent experimental studies have recognized that tea exhibits a significant health-protecting activity due to its high polyphenol content (Manzocco et al. Citation1998). Tea polyphenols are the most significant group of tea components and have a wide range of pharmaceutical properties including antioxidative, anticarcinogenic and antiatheriosclerotic (Dufresne & Farnworth Citation2001; Atoui et al. Citation2005).
The antioxidative properties of flavonoids are manifested particularly by their abilities to inhibit free radical generation, scavenge free radicals and chelate transition metal ions, mainly iron and copper, which are catalysts of free radical reactions (Wang et al. Citation2000; Heo et al. Citation2007; Khan & Mykhtar Citation2007). They also prevent free radical generation by increasing the activity of enzymes with antioxidative properties (Spencer et al. Citation2009). Green tea in the form of extract or powder, a natural source of antioxidant, has been successfully used to extend the shelf-life of various food products susceptible to oxidation ‘such as meat, poultry, seafood, soup, sauce, margarines, oils, bakery products, pizza toppings, cereals and snack foods’ (Senanyake Citation2013).
The present work aimed to evaluate the mode of action of phenolic, polyphenolic compounds and sweeteners in addition to its antioxidant activity in commercially available green and black teas using methods based on their reduction properties.
Materials and methods
Chemical reagents
All chemicals and reagents were of analytical grade and obtained from either Sigma-Aldrich or Merck Chemical Co. (Darmstadt, Germany).
Sample collection
Lipton green tea and black tea were collected from traditional market, Giza, Egypt.
Preparation of tea extracts
A known weight of the dried and ground tea samples (1.0 g, n = 16) was extracted three successive times with 200 ml hot water (100°C) in dark place (flask covered with aluminum foil) at room temperature (25°C). The collected extracts were filtered using filter paper, and the filtrate was kept in refrigerator until use (Rossenthaler Citation1930).
The sucrose and aspartame were used as sweetening substance in combination with tea extract at different concentrations as the following: tea samples numbered from 1 to 5 are green tea samples (green tea only, green tea + sucrose 0.5%, green tea + sucrose 1.0%, green tea + sucrose 2.0%, green tea + sucrose 4.0%); while samples numbered from 6 to10 are black tea (black tea only, black tea + sucrose 0.5%, black tea + sucrose 1.0%, black tea + sucrose 2.0%, black tea + sucrose 4.0%); tea samples numbered from 11 to 13 are green tea mix with 0.1%, 0.2% and 0.4% aspartame, respectively, while, tea samples numbered from 14 to 16 are black tea mix with 0.1%, 0.2% and 0.4% aspartame, respectively pH range between 4.65 to 4.78.
Determination of total phenolic content
Phenolic compounds were determined using the method described by Singleton et al. (Citation1999). Briefly, 1 ml of extract was mixed with 1 ml of Folin Ciocalteu reagent. After 3 min, 1 ml of saturated sodium carbonate solution (20%) was added to the mixture and adjusted to 10 ml with distilled H2O. The reaction mixture was kept in the dark for 1 h with intermittent shaking. The absorbance was measured at 725 nm using a spectrophotometer (Jenway, UV/Visible 1613). Phenolic contents were calculated based on the standard curve of gallic acid used as standard.
Total flavonoids
A known weight of each tea extract was placed in 10 ml volumetric flask. Then, 4 ml distilled water and 3 ml AlCl3 (1:10, w/v) were added. After 6 min, 2 ml NaOH (1 M) was added and the total volume was adjusted to 10 ml with distilled water. The solution was mixed well and the absorbance was measured spectrophotometrically against a blank at 510 nm (Zhuang et al. Citation1992). Quercetin was served as the standard compound for the preparation of calibration curve.
Assay of antioxidant activities
Antioxidant activity of different tea extracts was determined using the following methods:
2, 2-diphenyl-1-picrylhydrazyl (DPPH) radical assay
Scavenging effect of DPPH radical was measured by the method of Chou et al. (Citation2009). A volume of 0.1 ml of 1 mM methanol solution of DPPH was incubated with various concentrations of each tea extract and sucrose (50 and 100 µg/ml). After 30 min incubation periods at room temperature, absorbance of the resulting solution was recorded at 517 nm. In addition, we measured the color of tea extract without DPPH. DPPH radical scavenging activity was expressed as the inhibition percentage and was calculated as: absorbance of control–absorbance of sample/absorbance of control × 100. Standard butylated hydroxyl anisole (BHA) was used for comparison and we calculated the dose–response curve of promising extract at different concentrations.
2, 2′-azino-bis [ethylbenzthiazoline-6-sulfonic acid] (ABTS) radical cation scavenging assay
This assay was based on the ability of different substances to scavenge ABTS radical cation in comparison to a standard (BHA, at 50 and 100 µg/ml). The radical cation was prepared by mixing a 7 mM ABTS stock solution with 2.45 mM potassium persulfate (1/1, v/v) and leaving the mixture for 4–16 h until the reaction was completed and the absorbance was stable. The ABTS+ solution was diluted with ethanol to an absorbance of 0.700 ± 0.05 at 734 nm for measurements. The photometric assay was conducted on 0.9 ml of ABTS+ solution and 0.1 ml of tested tea samples (50 and 100 µg/ml in MeOH solution) and mixed for 45 s, then measurements were recorded at 734 nm after 1 min. In addition, we measured the color of tea extract without ABTS. The antioxidant activity of the tested samples and sucrose was calculated by determining the decrease in absorbance at different concentrations by using the following equation: E = ((Ac−At)/Ac) × 100, where: At and Ac are the respective absorbance of tested samples and ABTS+ (Re et al. Citation1999).
Fourier transform infrared (FTIR) spectrometer analysis
In order to investigate the functional groups involved in the antioxidant activity of phenolic compounds in the tea samples, FTIR analysis was carried out. Infrared spectra of tea samples with and without sugar were analyzed. The samples were dried and mixed with KBr (1:20; 0.02 g of sample with KBr at a final weight of 0.4 g). Infrared spectra were obtained using a FTIR spectrometer {Perkin Elmer FTIR spectra (system 2000) USA} within a scanning range of 400–4000 cm−1.
Separation and quantification of phenolic compounds and caffeine
Separation and determination of tea extracts phenolic were performed by reverse phase HPLC (RP-HPLC)/diode array detection (DAD) (Hewlett Packard 1050) using a column Alltima C18, 5 mm (150 mm × 4.6 mm id) with a guard column Alltima C18, 5 mm (Alltech). The solvent system used was a gradient of A (CH3COOH 2.5%), B (CH3COOH 8%) and C (acetonitrile). The best separation was obtained with the following gradient: at 0 min, 5% B; at 20 min, 10% B; at 50 min, 30% B; at 55 min, 50% B; at 60 min, 100% B; at 100 min, 50% B and 50% C; at 110 min, 100% C until 120 min. The solvent flow rate was 1 ml/min and separation was performed at 35°C. The volume injected was 10 ml. Phenolic compounds were assayed by external standard calibration at 280 nm and expressed as µg/100g dry matter (Goupy et al. Citation1999).
The combination index (CI)
The CI was calculated as previously described by Chou and Talalay (Citation1984). Briefly, ABTS radicals were treated with different concentrations of tea extracts and sucrose, and the CI was calculated from the formula:
The nature of sample interaction was identified as synergistic if CI < 0.8; and as antagonistic if CI > 1.2; and additive, if CI ranges from 0.8 to 1.2.
Statistical analysis
All experimental results were expressed as means ± SD. Analysis of variance was performed by ANOVA procedures. The results with p < .05 were regarded as statistically significant. Data were statistically analyzed using Co state Statistical Package (Anonymous Citation1989).
Results and discussion
DPPH radical
The DPPH and ABTS radical assay were used for the evaluation of radical scavenging activity of 16 green and black tea samples with/without sweeteners. The results concerning the antioxidant activity of tea samples against DPPH radical are presented in Table . The data revealed that the antioxidant activity was concentration dependent at 50 and 100 µg/ml. The antioxidant activity of green tea was higher than that of black tea (93.8% and 86.8%, respectively, at 100 µg/ml) when compared with that of BHA as synthetic standard (92.5%). These findings were previously mentioned but with different antioxidant assays (Unachukwu et al. Citation2010; Jeska-Skoeron et al. Citation2015).
Table 1. Antioxidant activity of different tea extracts against DPPH and ABTS radicals.
Correlating the antioxidant activity with the chemical parameters, it was observed that the antioxidant activity in green teas correlated significantly (p < .01) positively with the concentration of total phenolic and flavonoids compounds as shown in Table . Total polyphenol levels were generally higher in green tea than in black tea (0.40% and 0.17%, respectively); furthermore, total flavonoids also were significantly (p < .01) higher in green tea than in black tea (0.29% and 0.16%, respectively). Hence, it is supposed that those antioxidant activities may be due to high level of total phenolic compounds and flavonoids (r = 0.245 and 0.310, respectively). These results are in agreement with the results obtained by Hwang et al. (Citation2010), Afify et al. (Citation2011), Korir et al. (Citation2014) and Turumtay et al. (Citation2014) who mentioned that antioxidant activity of green tea was higher than black tea and these were positively correlated with phenolic and flavonoids content.
Table 2. Total phenolic compounds and flavonoids content (g/100g) in different tea extracts.
ABTS radical
Data on antioxidant activity of different tea samples against ABTS radical are presented in Table . The antioxidant activity was shown to be concentration dependent. The obtained results illustrated that the antioxidant activities of tea samples against ABTS were higher than those of DPPH. Green tea was marginally higher than that of black tea (95.8% and 87.0%, respectively) and these correlated with phenolic and flavonoids content as shown in Table .
The difference between the data obtained with DPPH and ABTS methods is possibly due to the nature of the radicals (stable free radical of DPPH, cation radical of ABTS). However, Jeska-Skowron et al. (Citation2015) found that the strong correlation between ABTS and DPPH assays was observed.
The dose–response curves of green and black tea compared with standard compound (BHA) were analyzed and the results shown in Figure revealed that there is positive correlation between the concentration of tea sample and antioxidant activity against DPPH radical.
Figure 1. The dose–response curve of promising sample (green and black tea) compared with standard compound (BHA).
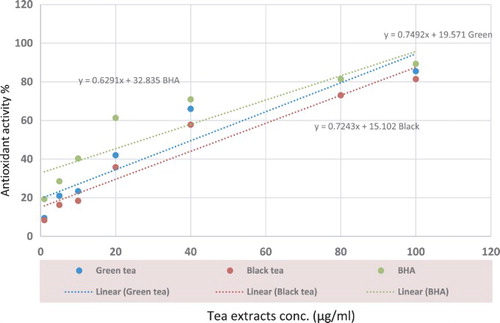
The results also revealed that the antioxidant activity significantly decreased with increasing sucrose concentration in green tea (from 93.8% to 90.6% against DPPH radical) and from 95.8% to 90.2% against ABTS radical at 100 µg/ml. A significant increase in antioxidant activity (p < .01) was recorded after addition of different concentration of sucrose (0.5–2.0%) in black teas (Table ). The antioxidant activities of black teas were increased after sucrose addition from 86.8% to 92.1% against DPPH radical and from 87.0 to 91.9 against ABTS radical at 100 µg/ml. The antioxidant activity of tea samples using aspartame was also assayed in this study. The data in Table show that the addition of 0.1, 0.2 and 0.4 g of aspartame had no significant influence on the antioxidant activity of both black and green teas against DPPH and ABTS radical.
Phenolic, flavonoid and caffeine compounds identified using HPLC/UV
The obtained results on the biochemical parameters in green and black tea samples using HPLC are presented in Table and Figure . Total phenolic contents were generally only higher in green tea than in black tea (1012.72 and 338.57 µg/100g, respectively) and these concentrations were increased to 13,469 in green tea mixed with 1.0% sucrose and to 2511.27 µg/100g in black tea mixed with the same sucrose concentration. and these results match with the results mentioned in Table , and this may be due to the effect of sucrose sugar on extraction of some phenolic compounds from tea samples when compared with green or black tea only without sucrose. This result in in agreement with the results obtained by Ananingsih et al. (Citation2013).
Figure 2. HPLC chromatogram obtained by the separation of green tea with aspartame extract.
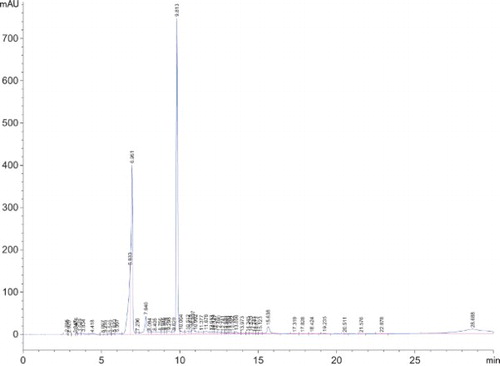
Table 3. Phenolic compounds and caffeine content (µg/100g) in different tea extracts.
The data also revealed that cinnamic acid showed the lowest content (0.21, 0.25, 0.19 and 0.18 µg/100g, respectively). Pyrogallol, catechol, epicatechin, ellagic, protocatchuic were significantly higher in green tea than in black tea. However, catechin, salycilic, coumarine levels were found to be relatively similar in both black and green teas. Syringic levels were significantly higher in black teas than in green teas (Table ).
Furthermore, some of phenolic compounds appeared in tea mixed with 1.0% sucrose eg: p-OH-benzoic acid (342 and 258 µg/100g in green and black tea, respectively). 4-amino-benzoic acid, catechin, caffeic, iso-ferullic, vanillic levels were significantly increased in tea samples mixed with sucrose (1%) than with aspartame (0.1%).
Also, from the purine alkaloids compounds, caffeine was the most predominant individual compounds in the assayed tea extract (6081.8, 8772.1, 6474 and 3755 µg/100g, respectively) in green and black tea without and with 1.0% sucrose.
IR results
Numerous functional groups have been proposed to be responsible for antioxidant activity in different tea samples (carboxyl, hydroxyl, amide, ether, etc.); their importance in scavenging different radicals (DPPH and ABTS) was investigated. FTIR was used to analyze the functional groups in the samples without or with added sugar (sucrose or aspartame). In the FTIR spectral analysis of green tea, we observed that characteristic bands corresponding to O–H stretching vibration at 3439 cm−1 shifted to 3436 in green tea mixed with sucrose and to 3434 in green tea mixed with aspartame. However, O–H stretching vibration at 3462 in black tea and shifted to 3435 in black tea mixed with sucrose or aspartame. The H–C–H was observed at 2926 in green and black teas mixed with aspartame. The absorption peaks at 1632 and 1637 assigned to –C=C– group in green and black tea, respectively, were shifted to 1641 and 1629 in green tea mixed with sucrose or aspartame, respectively, and shifted to 1632 and 13,631 in black tea mixed with sucrose or aspartame, respectively; 1502 and 1445 cm−1 assigned to aromatic alkene in green and black tea, respectively, shifted to 1510 and 1496 cm−1 in green tea mixed with sucrose and aspartame, respectively (Table and Figure ).
Figure 3. FTIR of tea extracts where, 1. green tea only, 2. green tea with sucrose, and 3. black tea only, 4. black tea with sucrose, 5. green tea with aspartame, and 6. black tea with aspartame.
Table 4. FTIR data of different tea extracts.
These changes could be attributed to the effective interaction between phenolic compounds in tea samples and sucrose or aspartame.
Accordingly, an increase in the peak intensity after treatments and appearing of new peaks (at 2926 cm−1) could be attributed also to the effective interaction of organic functional groups of tea extract with sugar (sucrose/aspartame).
The relation between phenolic compounds and sugar
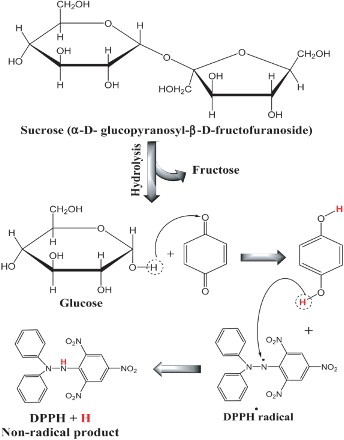
Most of green and black tea consumers prefer to sweeten their tea. The concentrations of the sweetening substance used in the current study were set to be similar to those that are normally added to tea during consumption. Aspartame is 300 times sweeter than sugar and known to exhibit some antioxidant activity (Abou-Arab et al. Citation2010) from the obtained data; no significant interactions occurred between aspartame glycosides and phenolic compounds in tea samples. However, addition of table sugar to green tea significantly decreased the antioxidant activity (Table ) against the two tested methods (DPPH and ABTS radical). Also Muthuiah et al. (Citation2009) went parallel with these results and they reported that addition of milk and sugar with tea significantly declines its free radical scavenging activity. These phenomena may be due to the condensation reaction between the hydroxyl group from phenolic compounds in green tea extracts and hydroxyl group in sucrose molecule and formation of glycoside (Figure ). These results are in agreement with the result obtained by Zhang et al. (Citation2009) who mentioned that complex compounds, such as pentagalloylglucose, tetragalloylglucose and trigalloylglucose, are likely to be formed as glucose interacts with the gallic acid in tea where the glucose hydroxyl groups are serially substituted by gallic acid. Also, Niederl and Maurmeyer (Citation1939) reported that polyhydric phenols, resorcinol, pyrogallol are capable of condensing with reducing monosaccharides.
Figure 4. The suggested reaction between sugar and phenols in green tea.
Furthermore, addition of table sugar to black tea significantly increased the antioxidant activity (Table ) and these may be due to the interaction between the oxidized phenolic compounds and sucrose molecule and formation of reduced form of phenolic compounds as shown in Figure . This reduced form can interact with DPPH or ABTS radicals and convert it to non-radical products. Also, may be the presence of sucrose (from 0.5% to 2.0%) in black tea increased the extraction efficiency by boiling water.
Figure 5. The suggested reaction between sugar and oxidized phenols (quinones) in black tea and possibility for scavenging of DPPH radical.
Combination index (CI)
The calculated CIs for different tea samples mixed with sucrose were 1.093 and 1.037, in green and black tea respectively, which is indicative of strong additive interaction characteristics in tea mixed with sucrose sugar (Table ).
Table 5. The nature of interaction between sugar and tea.
Correlation coefficient
Results on Table show the correlation matrix of antioxidant compounds in green and black teas and their antioxidant activities. It revealed that there was significant positive correlation between antioxidant activity against DPPH radical and ABTS radical (0.659). It also showed that phenolic compounds were positively correlated with flavonoid compounds (0.514). Antioxidant activity against ABTS had a positive significant association with the conc. of phenolic compounds (0.398) but more than the antioxidant activity against DPPH radical (0.245).
Table 6. Correlation matrix of tea compounds and antioxidant activities against DPPH and ABTS radicals.
Conclusion
From the obtained results, we can conclude that there were no significant interactions between the aspartame glycosides and phenolic compounds in tea samples. However, addition of table sugar to green or black tea significantly decreased or increased the antioxidant activity, and this may be due to the effect of sucrose on phenolic compounds extraction and its chemical structure as reported in IR figures. Therefore, the health benefit of tea was achieved when drinking green tea and black tea without and with sugar (sucrose), respectively.
Disclosure statement
No potential conflict of interest was reported by the authors.
References
- Abou-Arab A, Azza A, Ferial A. 2010. Physico-chemical assessment of natural sweeteners steviosides produced from stevia rebaudiana bertoni plant. Afr J of Food Sci. 4:269–281.
- Afify AMR, Shalaby EA, El-Beltagi HS. 2011. Antioxidant activity of aqueous extracts of different caffeine products. J Med Plant Res. 5:5071–5078.
- Alasalvar C, Topal B, Serpen A, Bahar B, Pelvan E, Gokmen V. 2012. Flavor characteristics of seven grades of black tea produced in Turkey. J Agric Food Chem. 60:6323–6332. doi: 10.1021/jf301498p
- Ananingsih VK, Sharma A, Zhou W. 2013. Green tea catechins during food processing and storage: a review on stability and detection. Food Res Int. 50:469–479. doi: 10.1016/j.foodres.2011.03.004
- Anonymous A. 1989. Cohort software corp. Costate user manual version 3.03. Barkley, CA.
- Atoui AK, Mansouri A, Boskou G, Kefalas P. 2005. Tea and herbal infusions: their antioxidant activity and phenolic profile. Food Chem. 89:27–36. doi: 10.1016/j.foodchem.2004.01.075
- Bae IK, Ham HM, Jeong MH, Kim DH, Kim HJ. 2015. Simultaneous determination of 15 phenolic compounds and caffeine in teas and mate using RP-HPLC/UV determination: method development and optimization of extraction process. Food Chem. 172:469–475. doi: 10.1016/j.foodchem.2014.09.050
- Chan EWC, Soh EY, Tie PP, Law YP. 2011. Antioxidant and bacterial properties of green, black and herbal teas of Camellia Sinensis. Pharmacognosy Res. 3:266–272. doi: 10.4103/0974-8490.89748
- Chou HJ, Kuo JT, Lin ES. 2009. Comparative antioxidant properties of water extracts from different parts of beefsteak plant (Perilla frutescens). J Food Drug Anal. 17:489–496.
- Chou TC, Talalay P. 1984. Quantitative analysis of dose-effect relationships: the combined effects of multiple drugs or enzyme inhibitors. Adv Enzyme Regul. 22:27–55. doi: 10.1016/0065-2571(84)90007-4
- Dufresne CJ, Farnworth ER. 2001. A review of latest research findings on the health promotion properties of tea. J Nut Biochem. 12:404–421. doi: 10.1016/S0955-2863(01)00155-3
- Goupy P, Hugues M, Boivin P, Amiot MJ. 1999. Antioxidant composition and activity of barley (Hordeum vulgare) and malt extracts and of isolated phenolic compounds. J Sci Food Agric. 79:1625–1634. 10.1002/(SICI)1097-0010(199909)79:12<1625::AID-JSFA411>3.0.CO;2-8 doi: 10.1002/(SICI)1097-0010(199909)79:12<1625::AID-JSFA411>3.0.CO;2-8
- Heo HJ, Kim YJ, Chung D, Kim DO. 2007. Antioxidant capacities of individual and combined phenolics in a model system. Food Chem. 104:87–92. doi: 10.1016/j.foodchem.2006.11.002
- Hwang P, Wu C-H, Gau S-Y, Chien S-Y, Hwang D-F. 2010. Antioxidant and immune-stimulating activities of hot-water extract from seaweed Sargassum hemiphyllum. J Mar Sci Technol. 18:41–46.
- Jeska-Skowron M, Krawczyk M, Zgola-Grzeskowiak A. 2015. Determination of antioxidant activity, rutin, quercetin, phenolic acids and trace elements in tea infusion: influence of citric acid addition on extraction of metals. J Food Compos Anal. 40:70–77. doi: 10.1016/j.jfca.2014.12.015
- Jiang H, Engelhardt UH, Thrane C, Maiwald B, Strak J. 2015. Determination of flavonol glycosides in green tea, oolong tea and black tea by UHPLC compared to HPLC. Food Chem. 183:30–35. doi: 10.1016/j.foodchem.2015.03.024
- Jin L, Li X, Tian D, Fang X, Yu Y, Zhu H, Ge Y, Ma G, Wanq W, Xiao W, Li M. 2016. Antioxidant properties and color parameters of herbal teas in China. Ind Crop Prod. 87:198–209. doi: 10.1016/j.indcrop.2016.04.044
- Khan N, Mykhtar H. 2007. Tea polyphenols for health promotion. Life Sci. 81:519–533. doi: 10.1016/j.lfs.2007.06.011
- Korir MW, Wachira FN, Wanyoko JK, Ngure RM, Khalid R. 2014. The fortification of tea with sweeteners and milk and its effect on in vitro antioxidant potential of tea product and glutathione levels in an animal model. Food Chem. 145:145–153. doi: 10.1016/j.foodchem.2013.08.016
- Kris-Etherton PM, Keen CL. 2002. Evidence that the antioxidant flavonoids in tea and cocoa are beneficial for cardiovascular health. Curr Opin Lipidol. 3:41–49. doi: 10.1097/00041433-200202000-00007
- Longo G, Karan M, Sharma PD, Rakesh DD, Vyas S, Vasisht K. 2008. Quantitative analysis of green tea polyphenosin Indian cultivars. In: Jain NK, Rahman F, Baker P, editors. Economic crisis in tea industry. Hauston: Studium Press LLC; p. 275–282.
- Manzocco L, Anese M, Nicoli MC. 1998. Antioxidant properties of tea extracts as affected by processing. LWTFood Sci Technol. 31:694–698.
- Muthuiah MJ, Thomas J, Kumar RR, Mandal AKA. 2009. Studies on radical scavenging activity of tea leaves and effect of additives on activities of black tea liquor. Int J Food Sci Technol. 44:2070–2074. doi: 10.1111/j.1365-2621.2009.02033.x
- Niederl JB, Maurmeyer RK. 1939. Sugar-phenol condensations. The condensation of D-glucose with phenol. J Am Chem Soc. 61:1005–1010. doi: 10.1021/ja01874a006
- Pinto MS. 2013. Tea: a new prospective on health benefits. Food Res Int. 53:558–567. doi: 10.1016/j.foodres.2013.01.038
- Rahim AA, Nofrizal S, Saad B. 2014. Rapid tea catechin and caffeine determination by HPLC using microwave-assisted extraction and silica monolithic column. Food Chem. 147:262–268. doi: 10.1016/j.foodchem.2013.09.131
- Re R, Pellegrini N, Proteggente A, Pannala A, Yang M, Rice-Evans C. 1999. Antioxidant activity applying an improved ABTS radical cation decolorization assay. Free Rad Biol Med. 26:1231–1237. doi: 10.1016/S0891-5849(98)00315-3
- Rossenthaler L. 1930. The chemical investigation of plants. Translated into English by Sudhamoy Ghosh from the Third German edition. London: Bell and Sons.
- Scharbert S, Holzmann N, Hofmann T. 2004. Identification of the astringent taste compounds in black tea infusions by combining instrumental analysis and human bioresponse. J Agric Food Chem. 52:3498–3508. doi: 10.1021/jf049802u
- Senanyake N. 2013. Green tea extract: chemistry, antioxidant properties and food applications – a review. J Funct Food. 5:1529–1541. doi: 10.1016/j.jff.2013.08.011
- Singleton VL, Orthofer R, Lamuela-Ravwntos RM. 1999. Analysis of total phenolics and other oxidation substrates and antioxidants by means of Folin-Ciocaltea reagent. Methods Enzymol. 299:152–178. doi: 10.1016/S0076-6879(99)99017-1
- Spencer JPE, Vauzour D, Rendeiro C. 2009. Flavonoids and cognition. The molecular mechanisms underlying their behavioural effects. Arch Biochem Biophys. 492:1–9. doi: 10.1016/j.abb.2009.10.003
- Turumtay EA, Islamoglu F, Cavus D, Sahin H, Turumtay H, Vanholme B. 2014. Correlation between phenolic compounds and antioxidant activity of Anzer tea (Thymus praecox Opiz subsp. Caucasicus var. caucasicus). Ind Crop Prod. 52:687–694. doi: 10.1016/j.indcrop.2013.11.042
- Unachukwu UJ, Ahmed S, Kzavalier A, Lyles JT, Kennelly EJ. 2010. White and green teas (Camellia sinensis var. sinensis): variation in phenolic, methylxanthin, and antioxidant profile. J Food Sci. 75:541–548. doi: 10.1111/j.1750-3841.2010.01705.x
- Velayutham P, Babu A, Liu D. 2008. Green tea catechins and cardiovascular health: an update. Curr Med Chem. 15:1840–1850. doi: 10.2174/092986708785132979
- Wang H, Provan GJ, Helliwell K. 2000. Tea flavonoids: their functions, utilization and analysis. Trends Food Sci Technol. 11:152–160. doi: 10.1016/S0924-2244(00)00061-3
- Widlansky ME, Duffy SJ, Hamburg NM, editors. 2005. Effects of black tea consumption on plasma catechins and markers of oxidative stress and inflammation in patients with coronary artery disease. Free Radic Biol Med. 38:499–506. doi: 10.1016/j.freeradbiomed.2004.11.013
- Zhang J, Li L, Sung-Hoon K, Ann H, Junxuan L. 2009. Anticancer, antidiabetic and other pharmacologic and biological activities of penta-galloyl glucose. Pharmaceutical Res. 26:1–27. doi: 10.1007/s11095-008-9646-8
- Zhuang XP, Lu YY, Yang GS. 1992. Extraction and determination of flavonoid in grinkgo. Chinese Herbal Medicine. 23:122–124.