
ABSTRACT
The dependence of plant health and crop quality on epiphytic microbial community has been universally addressed; however, little is known about the relations between the microbial communities from grapes and other plant tissues, such as leaves and roots. In this study, the bacterial and fungal communities on grape berries and leaves, as well as in vineyard soils were analyzed by 16S rRNA gene and fungal internal transcribed spacer high-throughput sequencing analysis. The results showed both the similarities and the differences in the diversity and structure of the microbial communities among tested samples. The highest richness and diversity of the microbial communities were found on grape berries, followed by that in soils and on leaves. The main bacterial genera, Blastococcus, Bacillus, and Arthrobacter, and the main fungal genera, Alternaria, Guehomyces, and Cladosporium, were present in all samples, but in different amounts, whereas some other genera were sample-specific. Cluster analysis defined generally two major groups: (1) the microbial communities on grapes and leaves, and (2) those originating from the soil. The results suggested that there was a correlation between the microbial communities on the below- and aboveground grape tissues.
Introduction
Microorganisms live in complex associations with grape tissues and play important roles in promoting plant health and productivity (Berg et al. Citation2005). The microbial flora that inhabit grapevine may be one of the key factors that influence the yields and the traits associated with the grape berries, which further influence the quality of the grape wine (Vincent et al. Citation2005; Bokulich et al. Citation2012). In recent years, much attention has been paid to the potential biotechnological applications of these microorganisms.
Until now, grapevine-associated microbial communities have broadly been studied with respect to pathogens (Panagopoulos Citation1969) and the grapevine endophytic bacteria (Martins et al. Citation2013). As for the epiphytic counterpart (the carposphere), most studies have focused on the oenological interest, especially acetic and lactic acid bacteria and yeast communities in grape fruit microflora (Lonvaud-Funel Citation1999; Lonvaud-Funel Citation2001; Sabate et al. Citation2002; Barata et al. Citation2012). However, little is known about the relations between the microbial communities from grapes and other plant tissues, such as leaves and roots. Applying the traditional cultivable method and T-RFLP, Martins et al. (Citation2013) revealed the relationships among the epiphytic bacterial communities on grapes, leaves, barks, and soil of the grapevine plants. By high-throughput sequencing analysis, another relevant study showed that the bacterial communities on grape leaves were greatly different, both in size and structure, from communities on grape berries (Bokulich et al. Citation2014). It was also reported that a large diversity of plant-growth-promoting bacteria, ubiquitously identified on grape leaves and berries, was significantly active against the identified grapevine pathogens (Gilbert et al. Citation2014).
In this study, high-throughput sequencing analysis was performed to characterize the microbial communities, including bacteria and fungi on grapevine berries and leaves, as well as in vineyard soil. The structure and diversity of these communities were examined and the results showed the relationship among epiphytic microorganisms in different vineyard ecosystems.
Materials and methods
Site description and sampling design
This study was performed in a grape plantation in Beijing (40.3°N, 116.6°E). This grape plantation was a private vineyard, where Kyoho grapes were planted. There was no bactericide or insecticide applied in the vineyard. And, there was also no chemical fertilizer; only farmyard manure was used. The physico-chemical characteristics of the soil are as follows (Table ). Kyoho grape samples were collected at veraison. In this period, grapes begins to color and enlarge, corresponding to stage 35 in the modified E-L system for identifying major and intermediate grapevine growth stages (Coombe Citation1995). Three sampling points were selected randomly in the vineyard, each corresponding to five vines.
Table 1. Physico-chemical characteristics of the soil samples.
Soil, leaves and grapes sampling
Soil samples were collected around each grapevine (depth 3–8 cm) and mixed in sterile plastic bags. Fresh soil was passed through a 1-mm sieve to remove plant residues and stones. At each sampling point, leaves were removed from the bunches and placed in sterile plastic bags. Healthy and undamaged grapes were collected from the same vines. All samples were transported to the laboratory in refrigerated boxes and processed within 12 h. To prevent cross contamination, sampling tools were sterilized with 75% ethanol before sampling.
DNA extraction
For each leaf and grape sample, 10 g were aseptically transferred into polypropylene tubes containing 100 mL washing solution (0.1 M potassium phosphate buffer, pH 7.0). Sonication was then performed at a frequency of 40 kHz for 7 min in an ultrasonic cleaning bath (Shanghai Kudos Instrument Co.) to dislodge the microbes from leaves and grapes. For each soil sample, 0.5 g was weighed for DNA extraction. Genomic DNA was extracted from all the samples mentioned above using the FastDNA SPIN Kit for Soil (MP, USA), in accordance with the manufacturer’s guidelines (Zhang et al. Citation2009).
PCR amplification and sequencing
PCR amplification was performed using the bacterial 16S rRNA gene V5-V7 region primers 799F (5′-AAC MGG ATT AGA TAC CCK G-3′; Chelius and Triplett Citation2001) and 1193R (5′-ACG TCA TCC CCA CCT TCC-3′; Bodenhausen et al. Citation2013). Fungal rRNA internal transcribed spacer ITS1 was amplified with primers 5′-CTT GGT CAT TTA GAG GAA GTA A-3′ and 5′-GCT GCG TTC TTC ATC GAT GC-3′ (Gardes and Bruns Citation1993). The reverse primers were modified to contain a barcode (Bodenhausen et al. Citation2013). A volume of 50 μL PCR reaction contained 5 μL 10 × Pyrobest Buffer (Takara, Japan), 1 μL DNA template, 2 μL of each primer (10 μmol/L), 4 μL dNTPs (2.5 μmol/L), 0.3 μL Pyrobest DNA Polymerase (2.5 U/μL, Takara, Japan), and 35.7 μL ddH2O. PCR reaction procedure consisted of an initial 94°C for 3 min, followed by 35 cycles of 94°C for 45 s, 50°C for 60 s and 72°C for 90 s, and a final extension of 72°C for 10 min. PCR products were cleaned using an Ultra Clean PCR clean-up kit (Mobio, USA). The amplicon libraries were constructed with the cleaned PCR products and then sequenced using an Illumina Hiseq instrument, using a PE250 paired-end (Hiseq 2500, PE250). The sequencing data have been deposited in the NCBI Sequence Read Archive (SRP080428).
Data analysis
HiSeq output data was analyzed with MOTHUR software provided in MOTHUR SOP (version 1.36.1) (Schloss et al. Citation2009). Raw sequence reads were quality trimmed with the following criteria: (a) sequences were not allowed any ambiguous bases and maximum homopolymer length was set to eight base pairs; (b) when aligning paired-ends, a maximum of two mismatches were allowed; (c) sequences were checked for chimeras. Sequences were split into operational taxonomic units (OTU) based on 0.03 cutoff value and classified using Silva reference database and Unite. Diversity within the samples (alpha diversity) was calculated using ACE, Chao 1, Shannon and Simpson indices, respectively. Diversity between samples (beta diversity) was estimated by a series of tests, including ANOVA and Tukey’s test, which were performed using Bray Curtis distances.
The core OTUs were defined as the OTUs whose sequences accounted for more than 1%, and aligned using BLAST with the NCBI. Dendrogram was calculated on core OTU data with Primer E package (Clarke and Gorley Citation2006). The statistical significance of the differences was tested by one-way ANOVA followed by Tukey’s test (p < .1), performed using SPSS 21.0.
Results
Richness and diversity analysis
The standard operating procedure from the software package MOTHUR (version 1.36.1) was applied, which includes a de-noising step (Schloss et al. Citation2009). On average, for bacterial communities, 47,179, 76,072, and 61,668 sequences were obtained from soil, leaves, and grapes, respectively (Table ). For fungal communities, 222,674, 86,699, and 282,519 sequences were obtained from soil, leaves (one of the leaf samples was not sequenced successfully), and grapes, respectively (Table ). Sequences were clustered into OTUs at the 0.03 distance cutoff, which is typically the species level (Schloss and Handelsman Citation2005).
Table 2. Richness and diversity indices of bacterial communities.
Table 3. Richness and diversity indices of fungal communities.
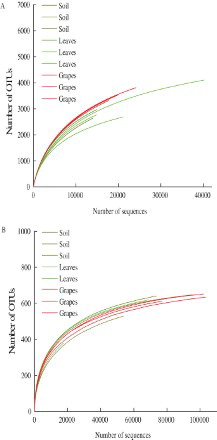
As shown in Figure , all the rarefaction curves began to level off, suggesting that the microbial communities were reasonably characterized with the sampling effort. The values of coverage for bacterial communities were larger than 92% for all the samples (Table ), and for fungal communities, they were as high as 99% (Table ). The results of ACE and Chao 1 showed that for both the bacterial (Table ) and fungal (Table ) communities, the microbial richness of grape samples was higher than that of the soil, followed by that of the leaf samples. However, there was no significant difference among these samples (p > .1). For the indices of Shannon and Simpson, the overall tendency was similar for both the bacterial (Table ) and the fungal (Table ) communities. Grapes showed the highest diversity, followed by the soil and the leaves, respectively, and there was also no significant difference among these samples (p > .1).
Figure 1. Rarefaction curves of (A) bacteria and (B) fungi in different samples. Dark yellow lines represent soil samples, green lines represent leaf samples, and red lines represent grape samples.
Microbial community analysis
Comparing the bacterial communities in soil, leaf, and grape samples, it was found that the main phyla and genera were present in all ecosystems, but in different amounts (Figure (A,B)), whereas others were sample-specific. The dominant 10 bacterial phyla in soil, leaves, and grapes were Actinomycetes, Proteobacteria, Firmicutes, Bacteroidetes, Gemmatimonadete, Acidobacteria, Nitrospirae, Chloroflexi, Verrucomicrobia, and Planctomycetes. Among them, the most abundant bacterial phylum in soil and on leaves was Actinomycetes (40%), whereas that most abundant on grapes was Proteobacteria (41%). The dominant 10 bacterial genera in soil, leaves, and grapes were Blastococcus, Bacillus, Arthrobacter, Gaiella, Pseudomonas, Nocardioides, Sphingomonas, Flavobacterium, Microvirga, and Kocuria. Among them, the most abundant bacterial genus in soil (3.6%), leaves (1.2%), and grapes (4.3%) was Blastococcus.
Figure 2. Comparison of bacterial communities in soil, leaves, and grapes. (A) Shows bacteria in phylum level; (B) shows bacteria in genus level; (C) shows the relationship among bacterial communities in soil, leaves, and grapes.
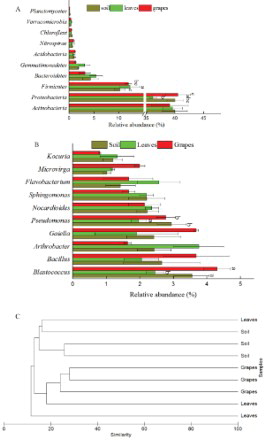
Although the main taxa distributed in all the three ecosystems, some of them were different significantly. As shown in Figure (A,B), the abundance of Proteobacteria was significantly different for leaves and grapes (p = .066, p < .1). And the abundance of Gemmatimonadete was higher on leaves than on grapes (p = .096, p < .1). Arthrobacter was higher on leaves than in soil (p = .048, p < .05) or on grapes (p = .006, p < .01). Pseudomonas was higher in soil than on leaves (p = .022, p < .05) or on grapes (p = .049, p < .05).
To assess the differences among ecosystems, all the samples were subjected to cluster analysis together. As shown in Figure (C), generally, two major groups were defined: grapes versus soil.
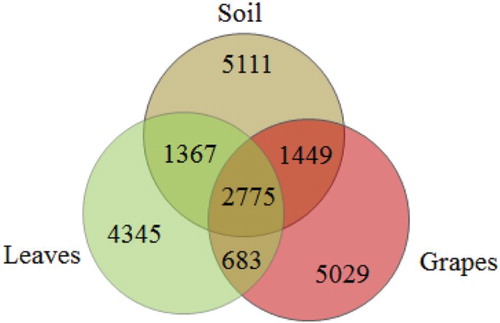
Comparison of the bacterial OTUs shared among the different sample types showed that the unique OTUs of soil, leaves, and grapes were 5111, 4345, and 5029, respectively, and the shared OTUs of soil with leaves, leaves with grapes, and soil with grapes were 4142, 3458, and 4224, respectively. The shared OTUs of the three types of samples were 2775, which took up 27.9% of the total OTUs (Figure ).
Figure 3. Venn diagram of OTUs at cutoff of 0.03 for the bacterial communities in the grapevine ecosystems of soil, leaves, and grapes. The numbers in the overlapping zones indicate how many of the OTUs were shared among samples.
Compared to that of the bacterial communities, the diversity of fungi in soil, leaves, and grapes was far less, whether at the phylum or genus level (Figure (A,B)). It was found that the fungi in all ecosystems distributed in only two phyla (except unclassified fungi): Ascomycota and Basidiomycota. Ascomycota was the most abundant fungal phylum in all the samples. The proportions were as high as 67%, 82%, and 77% in soil, leaves, and grapes, respectively. The dominant 10 fungal genera in soil, leaves, and grapes were Alternaria, Guehomyces, Cladosporium, Cryptococcus, Phoma, Acremonium, Fusarium, Chaetomium, Hydropisphaera, and Mycoarthris. Among them, Alternaria was the most abundant fungal genus in all samples, accounting for 17%, 22%, and 22% of fungi in soil, leaves, and grapes, respectively.
Figure 4. Comparison of fungal communities in soil, leaves, and grapes. (A) Shows fungi in phylum level; (B) shows fungi in genus level; (C) shows the relationship among fungal communities in soil, leaves, and grapes.
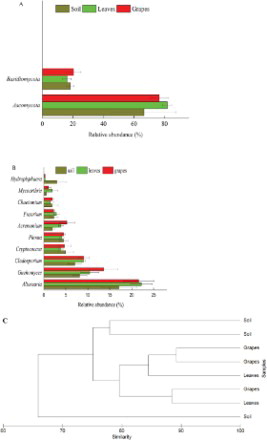
Samples were also subjected to cluster analysis to assess the impact of the ecosystem on the profiles. As shown in Figure (C), generally, two major groups were defined: (1) those on the leaves and grapes, and (2) those originating from the soil. The similarity of the fungal communities on leaves and grapes was 89%, and that of leaves and grapes to soil was 75%.
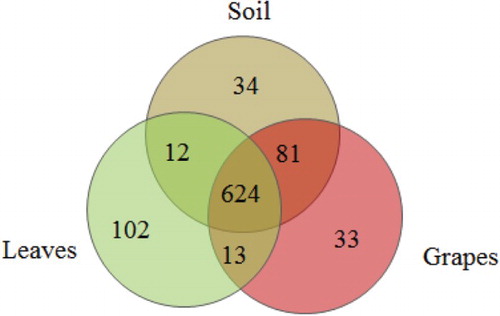
Comparison of the fungal OTUs shared among the different sample types showed that the unique OTUs of soil, leaves, and grapes were 34, 102, and 33, respectively, and the shared OTUs of soil with leaves, leaves with grapes, and soil with grapes were 636, 637, and 705, respectively. The shared OTUs of the three were 624, which accounted for 83.1% of the total OTUs (Figure ).
Figure 5. Venn diagram of OTUs at a cutoff of 0.03 for the fungal communities in the grapevine ecosystems of soil, leaves, and grapes. The numbers in the overlapping zones indicate how many of the OTUs were shared among samples.
Analysis of core OTUs and most similar species
The core OTUs were defined as the OTUs whose sequences accounted for more than 1% of all the sequences in the three habitats (soil, leaves, and grapes). Thirty bacterial core OTUs were found here, but in different abundance in each ecosystem (Table ). In soil, leaf, and grape samples, the core OTUs constituted 31.23%, 32.30%, and 31.02% of the total sequences, respectively. Among all the core OTUs, the relative abundance of the following three OTUs were found to be higher in these organs: uncultured Gemmatimonadales bacterium (OTU2, 6.1%), Arthrobacter sp. (OTU4, 4.5%), and Luedemannnella (OTU8, 4.3%). It was remarkable that among these 30 core OTUs, 18 were uncultured bacterial species.
Table 4. Core bacterial OTUs and most similar species in soil, leaves, and grapes.
These results highlighted that there was high overlap in the dominant bacterial taxa among soil, leaves, and grapes, meaning that many of the same microbial species can be found growing on different plant tissues. For example, some core OTUs were generalist OTUs, such as Bacillus sp. (OTU31, soil: 0.89%; leaves: 0.57%; grapes: 0.68%), Nocardioides sp. (OTU15, soil: 0.90%; leaves: 0.93%; grapes: 1.0%), and Virgibacillus sp. (OTU16, soil: 1.1%; leaves: 0.77%; grapes: 1.1%).
The phylogenetic tree of core bacterial communities in soil, leaves, and grapes is shown in Figure . The strains belonged to seven different bacterial phyla. There were some differences among the samples in the distribution of the taxonomic groups. Actinobacteria accounted for 12.55% in soil, 10.70% in leaves, and 9.02% in grapes. Firmicutes accounted for 10.16%, 9.91%, 11.66% in soil, leaves, and grapes, respectively, and Proteobacteria 2.00%, 1.46%, and 1.70%, respectively.
Figure 6. Phylogenetic tree of core bacterial communities in soil, leaves, and grapes.
There were 19 fungal core OTUs found in the three organs (soil, leaves, and grapes) (Table ). These OTUs constituted most of the sequences (soil: 70.89%; leaves: 75.26%; grapes: 74.28%). Among them, the relative abundance of the following three OTUs were found to be higher in these organs: Alternaria sp. (OTU1629, 60.61%), Cladosporium sp. (OTU1460, 21.73%), and Phoma sp. (OTU1680, 9.10%).
Table 5. Core fungal OTUs and most similar species in soil, leaves, and grapes.
The phylogenetic tree of core fungal communities in soil, leaves, and grapes is shown in Figure . The strains belonged to only three different fungal phyla. There were some differences among the samples in the distribution of the taxonomic groups. Ascomycota accounted for 20.70%, 32.39%, and 28.04% in soil, leaves, and grapes; Basidiomycota accounted for 49.59%, 40.50%, and 44.51%, respectively.
Figure 7. Phylogenetic tree of core fungal communities in soil, leaves, and grapes.
Discussion
There are some studies on the microbial populations of wine grapes, while little is known about the relations among epiphytic microorganisms of different grapevine tissues, such as leaves, as well as microbial communities in the vineyard soil. In this work, high-throughput sequencing analysis was performed to investigate the differences of epiphytic microbial communities inhabiting different grapevine tissues (grapes and leaves) as well as soil. This approach revealed both similarities and differences in population diversity and composition among different samples from the various ecosystems.
In this study, the results of alpha diversity showed that for the microbial communities, the richness and diversity (Tables and ) on the grape samples was higher than that in the soil, followed by that on the leaf samples. However, there was no significant difference among these samples (p > .1). Furthermore, comparison of the microbial communities in soil, leaf, and grape samples showed that the main phyla and genera were present in all ecosystems, but in different amounts (Figures and ), whereas others were sample-specific. For example, in this study, it was found that Pseudomonas and Bacillus existed in both grapes and soil (West et al. Citation2010; Compant et al. Citation2011), certain Pseudomonas species associated exclusively with leaves and other Pseudomonas were found more frequently on grape berries (Leveau and Tech Citation2011), whilst Bacillus may play a key role during alcohol fermentation (Li et al. Citation2015). Cluster analysis defined generally two major groups: (1) microbial communities on the leaves and grapes, and (2) those originating from the soil. The core OTU analysis identified the dominant microbial communities at the species level, which highlighted that there was high overlap in the dominant microbial taxa among soil, leaves, and grapes, but in different abundances (Tables and ).
Soil was the origin of the microbes
Our results showed that the microbial species found belowground (soil) were commonly also found aboveground (leaves and grapes). Despite this, the cluster analysis showed that the members of taxa in the soil differed from those on the leaves and grapes. It has been hypothesized that part of the plant epiphytic population may come from the soil that plants inhabit. This hypothesis is partially supported by the fact that the soil and various grapevine parts are usually physically close in proximity. In most of the grapevine-culturing plantation, some leaves and grapes are close to the ground soil, which makes the translocation of soil microorganisms to aerial tissues of the plants possible through various physical and biological processes (Martins et al. Citation2013). Therefore, the presence of plant pathogens in the vineyard soil will also affect the aerial tissues such as leaves, stems, and fruits (Leveau and Tech Citation2011). Microorganisms important for enology, such as Saccharomyces cerevisiae, the main yeast responsible for alcoholic fermentation, have also been isolated from vineyard soil (Tournas and Katsoudas Citation2005). Some studies have also associated the presence of soil bacterial species with the grape berries. For example, some lactic and acetic acid bacteria identified in wine have also been found in vineyard soil (Yanagida et al. Citation2008; Castañeda and Barbosa Citation2017). These findings indicate that vineyard soil may serve as an origin of primary inoculum (Zarraonaindia et al. Citation2015), which can play a role in shaping the structure of the microbial community inhabiting the aerial tissues of the vine, such as leaves and grapes. Additionally, it should be noted that leaves could also be a source of inoculum for grapes, as the leaves on the vine are in proximity to grapes and may even come into direct contact. Therefore, the leaves could also affect the microbial community on the grape berries.
Environmental variability promotes microbial diversity
A variety of factors can be involved in shaping the microbial community on plant tissues and in soil. Determining factors can be the availability of inoculum, physico-chemical environmental conditions, host plant phenology, or a combination of these.
In this study, grapes hosted a greater microbial diversity and richness than soil and leaves. Nutrient availability was one of the most important factors influencing the microbial communities in different ecosystems (Badri et al. Citation2009). Grape berries contain sugars and other nutrients from exudation or breakage, whereas soil usually contains a large amount of diverse carbon sources, such as organic acids and carbohydrates (Wawrik et al. Citation2005). Therefore, both environmental niches can provide rich nutrients to support the growth of a large number and diversity of microorganisms, while in contrast, the niches associated with leaves are generally considered nutrient-limited. The soil can keep the temperature and humidity more stable than the aerial parts of the grapevines; in addition, the soil blocks UV radiation (Leveau and Tech Citation2011). For the aerial parts of the grapevines, the leaves and grapes had to tolerate the dramatic fluctuation of the temperature and humidity during days or seasons (Lindow and Brandl Citation2003). Additionally, the leaves were radiated by UV during the daytime, whilst some grape berries may be shielded from irradiation by the leaves (Lindow and Leveau Citation2002).
Additionally, plant tissues aboveground can also be inhabited by epiphytic microorganisms from other plants, which may explain the presence of abundant species that were unique to the grapevine aboveground tissues (Compant et al. Citation2011; Lopez-Velasco et al. Citation2011).
Disclosure statement
No potential conflict of interest was reported by the authors.
ORCID
Zhihui Bai http://orcid.org/0000-0002-3818-527X
Additional information
Funding
References
- Badri DV, Weir TL, van der Lelie D, Vivanco JM. 2009. Rhizosphere chemical dialogues: plant-microbe interactions. Curr Opin Biotech. 20:642–650. doi: 10.1016/j.copbio.2009.09.014
- Barata A, Malfeito-Ferreira M, Loureiro V. 2012. The microbial ecology of wine grape berries. Int J Food Microbiol. 153:243–259. doi: 10.1016/j.ijfoodmicro.2011.11.025
- Berg J, Tom-Petersen A, Nybroe O. 2005. Copper amendment of agricultural soil selects for bacterial antibiotic resistance in the field. Lett Appl Microbiol. 40:146–151. doi: 10.1111/j.1472-765X.2004.01650.x
- Bodenhausen N, Horton MW, Bergelson J. 2013. Bacterial communities associated with the leaves and the roots of Arabidopsis thaliana. PLoS One. 8:e56329. doi: 10.1371/journal.pone.0056329
- Bokulich NA, Joseph CML, Allen G, Benson AK, Mills DA. 2012. Next-generation sequencing reveals significant bacterial diversity of botrytized wine. PLoS One. 7:e36357. doi: 10.1371/journal.pone.0036357
- Bokulich NA, Thorngate JH, Richardson PM, Mills DA. 2014. Microbial biogeography of wine grapes is conditioned by cultivar, vintage, and climate. PNAS. 111:E139. doi: 10.1073/pnas.1317377110
- Castañeda LE, Barbosa O. 2017. Metagenomic analysis exploring taxonomic and functional diversity of soil microbial communities in Chilean vineyards and surrounding native forests. Peerj. doi: 10.7717/peerj.3098
- Chelius MK, Triplett EW. 2001. The diversity of Archaea and Bacteria in Association with the roots of Zea mays L. Microb Ecol. 41:252–263. doi: 10.1007/s002480000087
- Clarke KR, Gorley RN. 2006. Primer v6: user manual/Plymouth Routines in Multivariate Ecological Research. Plymouth: Plymouth Marine Laboratory; p. 1–181.
- Compant S, Mitter B, Colli-Mull JG, Gangl H, Sessitsch A. 2011. Endophytes of grapevine flowers, berries, and seeds: identification of cultivable bacteria, comparison with other plant parts, and visualization of niches of colonization. Microb Ecol. 62:188–197. doi: 10.1007/s00248-011-9883-y
- Coombe BG. 1995. Growth stages of the grapevine: adoption of a system for identifying grapevine growth stages. Aust J Grape Wine Res. 1:104–110. doi: 10.1111/j.1755-0238.1995.tb00086.x
- Gardes M, Bruns TD. 1993. ITS primers with enhanced specificity for basidiomycetes – application to the identification of mycorrhizae and rusts. Mol Ecol. 2:113–118. doi: 10.1111/j.1365-294X.1993.tb00005.x
- Gilbert JA, Lelie DVD, Zarraonaindia I. 2014. Microbial terroir for wine grapes. PNAS. 111:5. doi: 10.1073/pnas.1320471110
- Leveau JHJ, Tech JJ. 2011. Grapevine microbiomics: bacterial diversity on grape leaves and berries revealed by high-throughput sequence analysis of 16S rRNA amplicons. Acta Horticulturae. 905:31–42. doi: 10.17660/ActaHortic.2011.905.2
- Li ZM, Chen L, Bai ZH, Wang DL, Gao LP, Hui BD. 2015. Cultivable bacterial diversity and amylase production in two typical light-flavor Daqus of Chinese spirits. Front Life Sci. 8:264–270. doi: 10.1080/21553769.2015.1041188
- Lindow SE, Brandl MT. 2003. Microbiology of the phyllosphere. Appl Environ Microbiol. 69:1875–1883. doi: 10.1128/AEM.69.4.1875-1883.2003
- Lindow SE, Leveau JH. 2002. Phyllosphere microbiology. Curr Opin Biotech. 13:238–243. doi: 10.1016/S0958-1669(02)00313-0
- Lonvaud-Funel A. 1999. Lactic acid bacteria in the quality improvement and depreciation of wine. Antonie van Leeuwenhoek. 76:317. doi: 10.1023/A:1002088931106
- Lonvaud-Funel A. 2001. Biogenic amines in wines: role of lactic acid bacteria. Fems Microbiol Lett. 199:9–13. doi: 10.1111/j.1574-6968.2001.tb10643.x
- Lopez-Velasco G, Welbaum GE, Boyer RR, Mane SP, Ponder MA. 2011. Changes in spinach phylloepiphytic bacteria communities following minimal processing and refrigerated storage described using pyrosequencing of 16S rRNA amplicons. J Appl Microbiol. 110:1203–1214. doi: 10.1111/j.1365-2672.2011.04969.x
- Martins G, Lauga B, Miot-Sertier C, Mercier A, Lonvaud A, Soulas ML, Soulas G, Masneuf-Pomarède I. 2013. Characterization of epiphytic bacterial communities from grapes, leaves, bark and soil of grapevine plants grown, and their relations. PLoS One. 8:e73013. doi: 10.1371/journal.pone.0073013
- Panagopoulos CG. 1969. The disease ‘tsilik marasi’ of grapevine: its description and identification of the causal agent (Xanthomonas ampelina sp. nov.). Annales De Linstitut Phytopathologique Benaki. 9:59–81.
- Sabate J, Cano J, Esteve-Zarzoso B, Guillamón JM. 2002. Isolation and identification of yeasts associated with vineyard and winery by RFLP analysis of ribosomal genes and mitochondrial DNA. Microbiol Res. 157:267–274. doi: 10.1078/0944-5013-00163
- Schloss PD, Handelsman J. 2005. Introducing DOTUR, a computer program for defining operational taxonomic units and estimating species richness. Appl Environ Microbiol. 71:1501. doi: 10.1128/AEM.71.3.1501-1506.2005
- Schloss PD, Westcott SL, Ryabin T, Hall JR, Hartmann M, Hollister EB, Lesniewski RA, Oakley BB, Thallinger GG, Van Horn DJ, et al. 2009. Introducing mothur: open-source, platform-independent, community-supported software for describing and comparing microbial communities. Appl Environ Microbiol. 75:7537–7541. doi: 10.1128/AEM.01541-09
- Tournas VH, Katsoudas E. 2005. Mould and yeast flora in fresh berries, grapes and citrus fruits. Int J Food Microbiol. 105:11–17. doi: 10.1016/j.ijfoodmicro.2005.05.002
- Vincent R, Olivier C, Aline L. 2005. Understanding the microbial ecosystem on the grape berry surface through numeration and identification of yeast and bacteria. Aust J Grape Wine Res. 11:316–327. doi: 10.1111/j.1755-0238.2005.tb00031.x
- Wawrik B, Kerkhof L, Kukor J, Zylstra G. 2005. Effect of different carbon sources on community composition of bacterial enrichments from soil. Appl Environ Microbiol. 71:6776–6783. doi: 10.1128/AEM.71.11.6776-6783.2005
- West ER, Cother EJ, Steel CC, Ash GJ. 2010. The characterization and diversity of bacterial endophytes of grapevine. Can J Microbiol. 56(3):209–216. doi: 10.1139/W10-004
- Yanagida F, Srionnual S, Chen YS. 2008. Isolation and characteristics of lactic acid bacteria from koshu, vineyards in Japan. Lett Appl Microbiol. 47:134–139. doi: 10.1111/j.1472-765X.2008.02398.x
- Zarraonaindia I, Owens SM, Weisenhorn P, West K, Hampton-Marcell J, Lax S, Bokulich NA, Mills DA, Martin G, Taghavi S, et al. 2015. The soil microbiome influences grapevine-associated microbiota. mBio. 6:e02527-14. doi: 10.1128/mBio.02527-14
- Zhang BG, Bai ZH, Hoefel D, Wang XY, Li BJ, Li ZM, Zhuang GQ. 2009. The impacts of cypermethrin pesticide application on the non-target microbial community of the pepper plant phyllosphere. Sci Total Environ. 407:1915–1922. doi: 10.1016/j.scitotenv.2008.11.049