
ABSTRACT
The aerial surface of the plant (phyllosphere) is the habitat of complex microbial communities and the structure of this microbiome may be dependent on plant genetic factors, local environment or interactions between them. In this study, we explored the microbial diversity present in the phyllosphere of a very diverse set of grapevine cultivars representing the three genetic pools of the species, grown on an experimental plot at Montpellier (French Mediterranean region). We assessed microbiome variation in the phyllosphere using amplicon sequencing of the 16S rRNA gene and of the internal transcribed spacer (ITS), according to the grapevine genetic pools or cultivars, and organs (i.e. leaves and grape berries). The observed microbiome was complex; out of 542 bacterial genera; Pseudomonas, Pantoea, Sphingomonas, and Acinetobacter were the most abundant and almost ubiquitously present across the samples, and out of 267 fungal genera; Aureobasidium, Alternaria, Mycosphaerella and Aspergillus were most represented. Our results illustrated that the microbial taxa were almost uniformly distributed among the genetic pools and only a few cultivar or genetic pool level differences were found, but a very clear differential taxa abundance was found between the leaf and berry samples. Some genus level associations were also observed with certain genetic pools.
Introduction
Vitis vinifera (subsp. vinifera L.), is the main grape species grown for fruit and wine production over the world. It is a natural host of a wide variety of prokaryotic and eukaryotic microorganisms that interact with grapevine, having either beneficial or phytopathogenic effects (Schulz et al. Citation1999). These microbes also play a major role in fruit yield, grape quality and, ultimately, in the pattern of grape fermentation and wine production (Compant et al. Citation2011; Bokulich et al. Citation2016; Belda et al. Citation2017).
The grapevine phyllosphere is rather less extensively studied as compared to the rhizosphere and endosphere (Vorholt Citation2012). The phyllosphere (in general) also harbors complex microbial communities involved in many crucial functions such as nitrogen fixation (Jones Citation1970), carbon sequestration (Bringel and Couée Citation2015), degradation of pesticides and organic pollutants (Brandl et al. Citation2001; Kishore et al. Citation2005; Bulgarelli et al. Citation2013). It is a significant and ubiquitous habitat for microorganisms and also an open system that microbes can invade by migration from the atmosphere, soil, other plants and insects (Lugtenberg et al. Citation2002; Williams et al. Citation2013). But microbial populations on phyllosphere are also known to live and thrive under harsh environmental factors such as UV radiation, air pollution, temperature fluctuations, water and nutrient availability (Andrews and Harris. Citation2000; Lugtenberg et al. Citation2002; Müller and Ruppel Citation2014).
A very fundamental question in microbial ecology is what drivers shape the microbiome on phyllosphere? Environmental conditions at the particular location and biotic factors such as leaf age have been identified as important drivers (Kadivar and Stapleton Citation2003; Ikeda et al. Citation2011, Copeland et al. Citation2015). Some reports on grapevine phyllosphere also suggested that the bacterial and fungal communities of the phyllosphere are minimally affected by the chemical and biological treatments tested, and they mainly differed according to the grapevine location (Gu et al. Citation2010; Bokulich et al. Citation2014; Perazzolli et al. Citation2014). Few authors suggested that in the tropical and temperate forests, the plant genotype is a major driver of the composition of the bacterial communities in the phyllosphere (Lambais et al. Citation2006; Redford et al. Citation2010). Another study on Arabidopsis thaliana also illustrated that the plant genetic factors may influence the community composition of the phyllosphere (Bodenhausen et al. Citation2014).
Until recently, there have been no scientific reports available, analyzing the effect of grapevine genetic factors on the microbiome structure of the phyllosphere. Considering that the microbial diversity present in phyllosphere could be relevant for plant health (Lugtenberg et al. Citation2002; Compant et al. Citation2005; Vorholt Citation2012), a better understanding of how the microbiota associated with grapevine phyllosphere is structured according to the grapevine genetic diversity available at a particular geographic location may provide unexpected opportunities to develop innovative and natural biocontrol methods or phytostimulators against plant pathogen or new breeding scheme for the creation of innovative resistant cultivars. As a first step towards this goal, we explored the bacterial and fungal diversity in the phyllosphere of leaf and berry samples from a set of rather diverse grapevine cultivars that belongs to the three genetic pools of the cultivated grapevine (Nicolas et al. Citation2016), in the French Mediterranean region. These experiments led us to address two major questions: (i) What microbial diversity is present in the phyllosphere of our Mediterranean vineyards and (ii) how this microbiome structure itself according to the grapevine genetic diversity and plant organs.
Materials and methods
Sample collection and DNA extraction
A total of 279 grapevine cultivars were grown in a completely randomized block design at Le Chapitre INRA Villeneneuve-Les-Maguelonne field station near Montpellier (French Mediterranean region). A panel of cultivars representing three genetic pools (western Europe, WW; from eastern Europe, WE; and table grape, TE) was constructed for genome-wide association studies while minimizing relatedness and retaining the main founders of modern cultivated grapevine to optimize the genetic diversity (Nicolas et al. Citation2016). Nine cultivars were randomly selected from each genetic pool and leaf (with sizes +1 to +4) samples were taken from four to five plants of each cultivar. Leaf samples were taken before spraying of pesticides; each plant had the same age. We collected the leaf samples in the Spring (mid-May 2016) and at the beginning of harvesting season, we also collected samples of berries from the same cultivars. A metadata table containing all the information about the samples and replicates can be downloaded from the GitHub repository (https://github.com/PrashINRA/MetaData_GrapevinePhyllo.git). All samples were washed with an isotonic solution of sodium chloride (0.15 M) containing 0.01% Tween 20 using a horizontal shaker for 1hr at 100 RPM. Afterward, samples were given an ultrasonic bath for 7–10 min using Ultrasonic Cleaner (Branson 5510) for maximum recovery of microbes from the sample surface. The remaining solution was centrifuged at 4,000 g and microbial pellets obtained in a 2-ml Eppendorf tube were collected and stored at −20°C. DNA was extracted from the pellets using the Meta-G-Nome Isolation Kit (Epicentre, Illumina) following the manufacturer’s instructions.
PCR amplifications and MiSeQ library preparation.
To access bacterial communities, the V4 region of the 16S ribosomal gene was amplified using primers 515F and 806R (Caporaso et al. Citation2011). Fungal community diversity and abundance were accessed using modified ITS9 and ITS4 primers targeting the ITS2 region (Blaadid et al. Citation2013; Lundberg et al. Citation2013). Two-step PCR was performed to prepare sequencing libraries. PCR1 was designed to perform amplification of the target regions and to add Illumina Nextera transposase sequence to the amplicons. Primers from Illumina kit for dual indexing of the amplicons was used in PCR2. Both forward and reverse primers for PCR1 were amended with frameshift (FS) sequences in their 5′ overhang to improve sequence diversity and overall read quality (de Souza et al. Citation2016). PCR1 was performed in 20 μL reactions with 30 ng of sample DNA using the Advantage 2 PCR kit (Clontech, 639206). PNA PCR clamps were also used to reduce host organelle contamination (de Souza et al. Citation2016). The same PCR1 was performed for ITS amplification except for the step of PNA annealing. Amplicon replicates were pooled, purified using Agencourt AMPure XP beads (Beckman Coulter) at a bead-to-DNA ratio of 0.7:1, resuspended in 30 μL MilliQ water and evaluated in agarose gels. In PCR2, each cleaned PCR1 product within the same sample received a unique combination of forward and reverse primers (respectively, N7 and S5 Illumina dual index oligos). Afterward, samples were again cleaned using AmPure XP magnetic beads, pooled in equimolar concentrations and sequenced using 2 × 250 bp MiSeq v2 sequencing (Illumina Inc., San Diego, CA, USA).
Data processing and analysis
All RAW data files were imported and processed in the R-environment (R Core Team, Citation2017) using various codes and inbuilt functions available in different R-packages. The whole dataset for 16S and ITS amplicon sequences were uploaded and available at the institutional server http://agap-ng6.supagro.inra.fr/inra. Data processing and further analysis were done in two phases. In phase-I, raw data files from both the datasets were filtered and trimmed using the fastqPairedFilter() function of the dada2 package (Callahan et al. Citation2016) and bases with low-quality scores were discarded. These filtered files were then processed using the Divisive Amplicon Denoising Algorithm (DADA) pipeline which included the steps of dereplication, core denoising algorithm and merging of the base pairs. Merging function provided global ends-free alignment between paired forward and reverse reads, and merged them together if they overlapped exactly and a table for ribosomal sequence variants (RSVs, a higher analog of operational taxonomic units-OTUs) was constructed, which records the number of times each amplicon sequence variant was observed in each sample. DADA infers sample sequences exactly and resolves differences of as little as one nucleotide (Callahan et al. Citation2016). Chimeras were removed using the removeBimeraDenovo() function of the dada2 package. OTU sequences were assigned a taxonomy using the RDP classifier and the UNITE database (Wang et al. Citation2007; Abarenkov et al. Citation2010) with assignTaxonomy() function of the same dada2 package for 16S and ITS sequences, respectively. Then, at the end of phase-I data processing, a phyloseq data object was created to initiate phase-II data analysis.
In phase-II, a phylogenetic tree for the taxa was constructed using the R-package ape (Paradis et al. Citation2004) and merged with the phyloseq data object of phase-I. Unassigned taxa and singletons were also removed using the subset_taxa() and prune_taxa() functions of the phyloseq package in R (McMurdie and Holmes Citation2013). This data object was then used to calculate microbial abundances, α, β diversity analysis and for other statistical tests using various functions in the phyloseq and vegan packages (McMurdie and Holmes Citation2013; Oksanen et al. Citation2017).
Prevalence plot for taxa abundances was made using ggplot() function of the ggplot2 package (Wickham Citation2009) using the entire 16S and ITS data-sets. Chao1 estimates of α diversity (Chao Citation1987) was measured within sample categories using estimate_richness() function of the phyloseq package. Relative abundances of microbial genera were also plotted using the ggplot2 package (Wickham Citation2009) on the above data, which were also rarified to even depth of 5,000 reads per sample.
Multidimensional scaling (MDS, also known as principal coordinate analysis; PCoA) was performed using Bray-Curtis dissimilarity matrix (Beals Citation1984) between samples and visualized by using their base functions in the phyloseq package (McMurdie and Holmes Citation2013).
Statistical analysis
We analyzed all the data from 16S and ITS amplifications separately in R version 3.3.4 using the dada2, phyloseq and vegan packages. CRAN packages plyr and ggplot2 (Wickham Citation2009; Wickham Citation2011) were also used to draw the figures. We assessed the statistical significance (P < 0.05) throughout and whenever necessary, we adjusted P-values for multiple comparisons according to the Benjamini and Hochberg method to control False Discovery Rate (Benjamini and Hochberg Citation1995) while performing multiple testing on taxa abundance according to sample categories. We performed an analysis of variance (ANOVA) among sample categories while measuring the Chao1 estimates of α-diversity. Stratified permutational multivariate analysis of variance (PERMANOVA) with 999 permutations was conducted on all principal coordinates obtained during PCoA with the adonis() function of the vegan package, to observe the statistical significance of clusters according to the sample categories.
Linear regression (parametric test), and Wilcoxon (Non-parametric) test (Hollander and Wolfe Citation1973) were performed on taxa abundances against genetic pools using their base functions in R (Myles and Douglas Citation1973; Bauer Citation1972).
Results
Quality assessment of the data
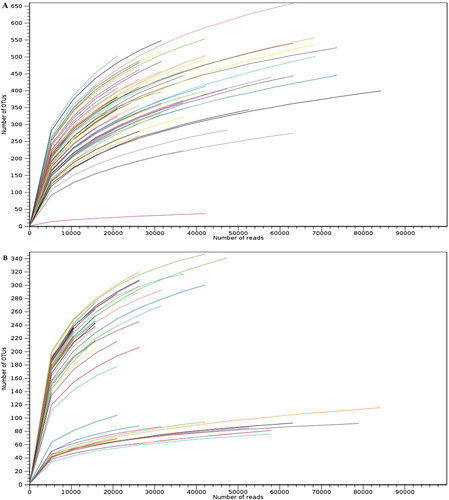
Raw demultiplexed sequence data files were generated using high-throughput amplicon sequencing of 16S and ITS ribosomal RNA genes and the number of reads per sample has been taken into account to obtain the depth of the sequencing. Rarefaction curves (number of reads vs number of OTUs) from both the datasets (Figure (A and B)) began to level off for most of the samples suggesting a good quality and coverage of both the data-sets and thus we can assume that the microbial communities were reasonably characterized with the sampling effort.
Figure 1. Rarefaction curves for (A) bacterial and (B) fungal datasets based on sequencing reads, describing the observed number of OTUs as a function of the sequencing reads per samples. Each color represents the sample (n = 80). Saturation of the curves represents the good coverage and quality of the data-sets.
Microbial diversity in the phyllosphere
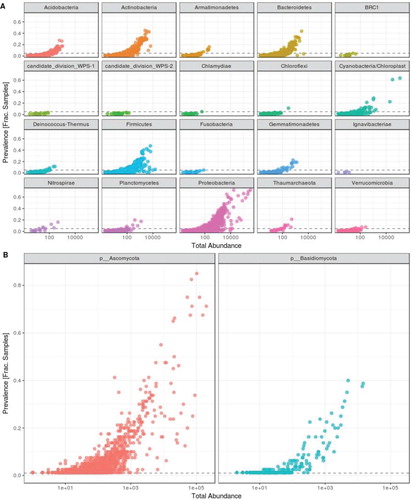
A total of 5,772,135 16S and 3,807,033 ITS amplicon sequences were generated from 80 samples covering two sample types (or organ types) and three genetic pools, respectively. We identified 12,875 unique bacterial and 3,413 unique fungal OTUs, in our phyllosphere samples. After removal of unassigned taxa (genus level assignment) and singletons, 6017 unique bacterial and 2075 unique fungal OTUs belonging to 542 bacterial and 267 fungal genera were recovered. Phylum level classification of bacterial and fungal communities was also identified (Figure (A and B)) using the feature prevalence of entire16S and ITS data-sets, which is the number of samples in which a taxon appeared at least once. For example, the phylum Ignavibacteriae had only five unique taxa with the cumulative abundance of thirty-eight and its presence is observed in less than 10% of the samples. Bacterial and fungal communities were heavily dominated by phylum Proteobacteria (relative abundance > 55%) and Ascomycota (> 65%) respectively.
Figure 2. Prevalence plot (taxa prevalence versus total count) for (A) bacterial and (B) fungal taxa representing the phylum level diversity across samples. Each point corresponds to a different or unique taxon. The y-axis represents the fraction of samples, these taxa are present.
Effects of genetic diversity on microbial communities in the phyllosphere
Multiple testing on each of bacterial 6017 and fungal 2075 OTUs (with adjusted p-values:adjp and controlling false discovery rates) was performed according to cultivars and genetic pools and apart from two bacterial taxon (OTU1309, genus: Gemmatimonas, adjp = 0.0209, FDR = 0.06017 and OTU120, genus: Hymenobacter, adjp = 0.036, FDR = 0.05), and one fungal taxon (OTU63, genus: Penicillium, adjp = 0.02, FDR = 0.028), which were differentially abundant between WW, and WE, we did not recover any taxa whose abundance is significantly different (statistically) among the genetic pools.
Relative abundances for the twenty most abundant genera were plotted as well for each cultivar within their genetic pools (Figure (A and B)) and microbial genera were quite uniformly abundant among the three genetic pools. This pattern was also the same when we analyzed the abundances in leaf and berry samples individually within these three genetic pools (Figure (A and B)), except for few cultivar level differences (e.g. bacterial genus Vagococcus in the cultivars of TE and fungal genus Pichia in the cultivars of WW genetic pool). To test the association of these genera with genetic pools, we performed a linear regression for abundances of these genera against genetic pools (parametric test). As the Pichia also seems more abundant in the phyllosphere of berries (Figure (B)), we also added this as confounders to the regression and the results indicated a highly significant association of these genera to TE and WW genetic pools, respectively (Tables and ). We also observed that the abundance data for these genera were not normally distributed and therefore performed a nonparametric test (Wilcoxon rank sum test), that confirmed the association.
Figure 3. Relative abundances of (A) bacterial and (B) fungal genera present on each cultivar, grouped within their genetic pools (9 cultivars per genetic pool, top 20 taxa, characterized to the genus level and datasets were rarified to 5000 sequence reads per sample). Chao1 estimates of α-diversity for (C) bacterial and (D) fungal data-sets for three genetic pools. PCoA plots using Bray-Curtis distance between samples for (E) bacterial and (F) fungal data-sets among three genetic pools, explaining >60% variations with first two axes (taxa with variance < 1e-05 were trimmed).
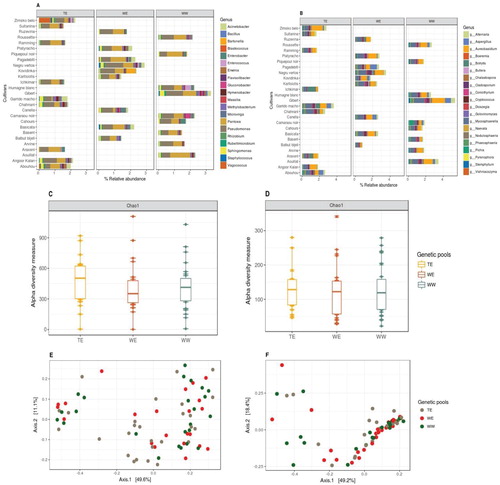
Figure 4. Relative abundances of (A) bacterial and (B) fungal genera present on leaf and berry samples, also grouped within their genetic pools (top 20 taxa, characterized to the genus level, datasets were rarified to 5000 sequence reads per sample). Chao1 estimates of α-diversity for (C) bacterial and (D) fungal data-sets for both the organ types. PCoA plots using Bray-Curtis distance between samples for (E) bacterial and (F) fungal data-sets as per leaf and berry samples based on Bray-Curtis distance matrices, explaining >60% variations with first two axes (taxa with variance < 1e-05 were trimmed).
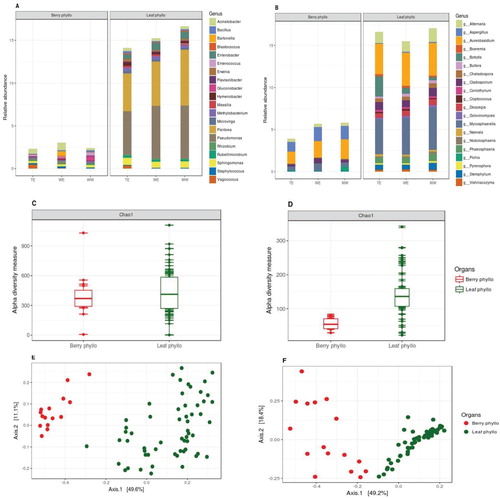
Table 1. Summary of association tests for bacterial genus Vagococcus against three genetic pools.
Table 2. Summary of association tests for fungal genus Pichia against three genetic pools.
The Chao1 estimator of alpha diversity was also measured and plotted according to the genetic pools (Figure (C and D)) and again we did not observe a very significant genetic pool wise differences in these estimates (ANOVA, for 16S data: Chao1, P = 0.033; for ITS data: Chao1, P = 0.041).
Microbial community structure assemblages among the three genetic pools were also compared using PCoA to look for the genetic pool wise patterns of microbiota present in the phyllosphere. Taxa in both the PCoA plot (Figure (E and F)) were clustered together (PERMANOVA, for 16S data: at F = 0.971, R2 = 0.285, P = 0.408; for ITS data: at F = 0.991, R2 = 0.172, P = 0.394), which also indicated the impact of genetic diversity is less evident. Results were the same when PCoA was performed on the data-sets grouped within 27 grapevine cultivars (Supplementary data S1).
Effect of organs on phyllosphere microbiome
Multiple testing on taxa abundances in the phyllosphere of leaves and berries gave 17 bacterial and 33 fungal OTUs whose abundance was significantly different between these two organs. The data revealed the organ-specific patterns of phyllosphere microbiota in these grapevine cultivars. Tables and are provided for 16S and ITS data respectively to display various bacterial and fungal OTUs (along with their respective genera) with their false discovery rates (FDRs) and adjusted p-values. According to the corrected p-values and FDRs, 5 bacterial (e.g. Pseudomonas and Pantoea. adjusted P-value; adjp = 0.0038 & FDR = 0.00118) and 31 fungal genera (e.g. Aspergillus and Mycosphaerella. adjp = 0.0005 & FDR = 0.000129) were most differed between leaf and berries were, respectively.
Table 3. Bacterial OTUs with differential abundance between leaf and berry samples with their respective genera, adjusted p-values, and FDRs.
Table 4. Fungal OTUs with differential abundance between leaf and berry samples with their respective genera, adjusted p-values, and FDRs.
Relative microbial abundances for top twenty taxa was also calculated on leaf and berry samples (also grouped in genetic pools; Figure (A and B)) and differential abundances on both sample type were clearly visible. Leaf phyllosphere was heavily occupied by bacterial and fungal genera of Pseudomonas and Pantoea & Aureobasidium, Mycosphaerella, respectively. On the other hand, berry surfaces mainly comprised of bacterial genera of Acinetobacter and Sphingomonas & with fungal genera of Aureobasidium, Aspergillus and Pichia.
To investigate the influence of leaves and berries, we also compared Chao1 estimates of alpha diversity between leaf and berry samples (Figure (C and D)) and these estimates were also significantly different (ANOVA, for 16S data: Chao1, P = 0.007; for ITS data: Chao1, P = 4.53e-08).
PCoA also indicated the same as it identified clear, separate clusters (Figure (E and F)) corresponding to both organs (PERMANOVA; for 16S data: at F = 45.384, R2 = 4.121, P = 0.001; for ITS data: at F = 48.306, R2 = 2.539, P = 0.001).
Discussion
Our analysis based on high throughput 16S and ITS profiling identifies the presence of complex microbiota in the phyllosphere of leaves and fruits (berries) of grapevine cultivars grown in our Mediterranean vineyard and it is dominated by bacterial genera of Pseudomonas, Sphingomonas, Enterobacter and the fungal genera of Aureobasidium, Alternaria, Cladosporium, respectively which is concordant with the findings of other grapevine related studies (Zarraonaindia et al. Citation2015; Zhang et al. Citation2017). High relative abundances of some other microbial genera such as Pantoea and Mycosphaerella have also been identified in this study, which has been reported in few grapevine cultivars before as endophytes (Bell et al. Citation1995; Baldan et al. Citation2015). This is not uncommon as epiphytes and endophytes are separated by a thin boundary between their habitats and due to vertical and horizontal microbial transfers (Frank et al. Citation2017) sharing of the major chunk of OTUs are inevitable (Bodenhausen et al. Citation2013). The bacterial genus Vagococcus has also not been widely reported in plants by research communities except rhizosphere and phyllosphere of Rice (Mwajita et al. Citation2013). Hence, the specific abundance of this genus must be further identified to have the preliminary view of its functionality in the Mediterranean vineyards. The reason for its abundance could be the interaction between plant genetic factors and environmental conditions at this specific geographic location of the vineyard. Epiphytes (the phyllosphere microbes) associated with grapevine have been suggested to originate from soil, but are distinct from those in the rhizosphere microbiome (Zarraonaindia et al. Citation2015); this is most likely a consequence of the physio-chemical composition and surrounding environment which strongly modulates microbial community structure and its dynamics (Wagner et al. Citation2016). Other reports also evidenced that both environment and the plant genotype could be the major drivers for epiphytic community structuring (Redford et al. Citation2010; Turner et al. Citation2013).
Our preliminary study based on random sampling of 27 cultivars (from three genetic pools) also indicated that there is probably an impact of grapevine genetic diversity over the microbial composition in the phyllosphere, but it is not quite evident as we found only a few microbial OTUs were differentially abundant among genetic pools. Sampling from cultivars (among these genetic pools) which are more distant in the context of their genetic relatedness must be done in the future to further explore the impact of this genetic diversity. Few genera were also found specifically associated with some cultivars of certain genetic pools (e.g. Vagococcus with the genetic pool TE) and this association (if further confirmed with above mentioned sampling strategies), should be taken into account in developing new selective breeding strategies in order to have the putative beneficial role of the phyllosphere as a performance trait of the cultivars. Moreover, environmental control in shaping microbiome in these genetically diverse grapevine cultivars should also be further investigated by sampling at different geographic locations displaying variable climatic conditions.
On the other hand, leaf and berry samples clearly displayed very distinct microbial patterns. Type of genera present and their taxa abundances was significantly different in both the organs. The physical features of berry surface like the number of waxy layers (or bloom, which prevent water loss from the skin) and their thicknesses are cultivar-specific (Knoche and Lang Citation2017). These physical features could influence the contact and permeability of the grape berry cuticle to different microorganisms as observed for some pathogens, such as Botrytis cinerea (Herzog et al. Citation2015) and could be the reason for organ-specific microbiome differences and deserve further investigations.
This finding is also consistent with the few other findings, in which organ-specific microbial patterns have been reported in sugarcane (de Souza et al. Citation2016) and in some commercially important grapevine cultivars (Bokulich et al. Citation2014). Our leaf samples were majorly occupied by the bacterial and fungal genus Pseudomonas, Pantoea and Sphingomonas & Aureobasidium, Mycosphaerella and Cladosporium. At the other end, berry surfaces displayed higher abundances of bacterial genus like Acinetobacter, Gluconobacter, Enterobacter, but major fungal abundances were similar in both leaf and fruit surfaces except the genus of Aspergillus and Pichia. Pichia (a yeast, family Saccharomycetaceae) was also found specifically abundant in berries of grapevine cultivars of the genetic pool WW. Taxonomy of Pichia is not fully resolved, and thus, a large diversity of roles in winemaking may be expected within this genus with some species inducing potential faults in winemaking (Fugelsang and Edwards Citation2010). Therefore the information regarding its association with certain genotypes should further be investigated in the context of wine fermentation.
A richly diverse fungal component of the grapevine microbiome has also been uncovered in this work and it could also be particularly significant because there is not sufficient information on the potential risks or benefits of plant-fungi associations. Grapevine associated microbial communities are relevant to industrial fermentation processes for wine production. Based on our results it can be assumed that grape juice used for wine production harbors a diverse bacterial and fungal community originating from its phyllosphere as well (e.g. Pantoea and Aspergillus).
Some species of most abundant microbial genera we found (e.g. Pseudomonas and Mycosphaerella) have been previously reported for acting as biocontrol agents or BCAs (Kurose et al. Citation2016; Jousset et al. Citation2006). An interesting question would be to evaluate how to integrate microbial community studies into traditional biocontrol approaches? This integration could provide a better understanding of how microbial communities are interacting with each other, with the host plant, pathogen or with BCAs, which would be definitely helpful for designing a novel biocontrol method. This also suggests that there is an open field for further studies of the possible role of bacterial and fungal colonizers in plant growth, development and response to biotic and abiotic stress.
A whole-genome shotgun sequencing followed by metagenomic analysis (Qin et al Citation2010) can add a more detailed layer of information to the taxonomical characterization of a wide variety of grapevine samples, by generating information on the gene composition of the bacteria and fungi present. This information can, in turn, be used to discover new genes and to formulate putative functional pathways and modules, thus could provide insight into functional and genetic microbiome variability. Apart from metagenomics, the use of additional tools such as RNA-Seq (for meta-transcriptomics) may offer a more informative perspective as it can reveal details about populations that are transcriptionally active and not just identify the taxa and genetic content of microbial populations. Moreover, the integration of different omic approaches (e.g. meta-transcriptomics & meta-proteomics) may open a window into discovering the regulatory mechanisms orchestrating observed gene expressions, thereby uncovering how host-microbe and microbe-microbe interactions that regulate microbiome activity.
Acknowledgements
We thank Audrey Weber & Valerie Laucou of INRA for their assistance in experimental procedures of sequencing library preparation. We are also grateful to Philippe Chatelett for providing aid to edit this manuscript. Author contribution: Prashant Singh, Jean-Pierre Péros and Patrice designed this research; Prashant Singh and Sylvain Santoni performed the lab experiments; Prashant Singh and Alex Gobbi analyzed the data; Prashant Singh, Jean-Pierre Péros and Patrice wrote this paper.
Disclosure statement
No potential conflict of interest was reported by the authors.
ORCID
Prashant Singh http://orcid.org/0000-0003-0807-4314
Additional information
Funding
References
- Abarenkov K, Henrik Nilsson R, Larsson KH, Alexander IJ, Eberhardt U, Erland S, Høiland K, Kjøller R, Larsson E, Pennanen T, et al. 2010. The UNITE database for molecular identification of fungi –recent updates and future perspectives. New Phytol. 186:281–285. doi: 10.1111/j.1469-8137.2009.03160.x
- Andrews JH, Harris RF. 2000. The ecology and biogeography of microorganisms on plant surfaces. Annu Rev Phytopathol. 38:145–180. doi: 10.1146/annurev.phyto.38.1.145
- Baldan E, Nigris S, Romualdi C, D’Alessandro S, Clocchiatti A, Zottini M, Stevanato P, Squartini A, Baldan B, Mergaert P. 2015. Beneficial bacteria isolated from grapevine inner tissues shape Arabidopsis thaliana roots. PLoS ONE. 10(10):e0140252. doi: 10.1371/journal.pone.0140252
- Bauer D. 1972. Constructing confidence sets using rank statistics. J Am Stat Assoc. 67:687–690. doi: 10.1080/01621459.1972.10481279
- Beals AW. 1984. Bray-Curtis ordination: an effective strategy for analysis of multivariate ecological data. Adv Ecol Res. 14:1–55. doi: 10.1016/S0065-2504(08)60168-3
- Belda I, Zarraonaindia I, Perisin M, Palacios A, Acedo A. 2017. From vineyard soil to wine fermentation: microbiome approximations to explain the “terroir” concept. Front Microbiol. 8:821. doi: 10.3389/fmicb.2017.00821
- Bell CR, Dickie GA, Harvey WLG, Chan JWYF. 1995. Endophytic bacteria in grapevine. Can J Microbiol. 41(1):46–53. doi: 10.1139/m95-006
- Benjamini Y, Hochberg Y. 1995. Controlling the false discovery rate: a practical and powerful approach to multiple testing. J Roy Stat Soc. 57:289–300.
- Blaalid R, Kumar S., Nilsson R. H., Abarenkov K., Kirk P. M., Kauserud H. 2013. ITS1 versus ITS2 as DNA metabarcodes for fungi. Mol Ecol Resour. 13:218–224. doi: 10.1111/1755-0998.12065
- Bodenhausen N, Bortfeld-Miller M, Ackermann M, Vorholt JA. 2014. A synthetic community approach reveals plant genotypes affecting the phyllosphere microbiota. PLoS Genet. 10(4):e1004283. doi: 10.1371/journal.pgen.1004283
- Bodenhausen N, Horton MW, Bergelson J. 2013. Bacterial communities associated with the leaves and the roots of Arabidopsis thaliana. PLoS ONE. 8(2):e56329. doi: 10.1371/journal.pone.0056329
- Bokulich NA, Collins TS, Masarweh C, Allen G, Heymann H, Ebeler SE, Mills DA. 2016. Associations among wine grape microbiome, metabolome, and fermentation behavior suggest microbial contribution to regional wine characteristics. mBio. 7(3):e00631-16. doi: 10.1128/mBio.00631-16
- Bokulich NA, Thorngate JH, Richardson PM, Mills DA. 2014. Microbial biogeography of wine grapes is condi-tioned by cultivar, vintage, and climate. PNAS. 111:E139. doi: 10.1073/pnas.1317377110
- Brandl MT, Quinones B, Lindow SE. 2001. Heterogeneoustranscription of an indoleacetic acid biosynthetic gene in Erwinia herbicola on plant surfaces. Proc Natl Acad Sci USA. 98:3454–3459. doi: 10.1073/pnas.061014498
- Bringel F, Couée I. 2015. Pivotal roles of phyllosphere microorganisms at the interface between plant functioning and atmospheric trace gas dynamics. Front Microbiol. 6:486. doi: 10.3389/fmicb.2015.00486
- Bulgarelli D, Spaepen SS, Themaat EVL, Shulze-Lefert P. 2013. Structure and functions of the bacterial microbiota of plants. Annu Rev Plant Biol. 64:807–838. doi: 10.1146/annurev-arplant-050312-120106
- Callahan BJ, Mcmurdie PJ, Rosen MJ, Han AW, Johnson AJ, Holmes SP. 2016. DADA2: high-resolution sample inference from Illumina amplicon data. Nat Methods. 13:581–583. doi: 10.1038/nmeth.3869
- Caporaso JG, Lauber C. L., Walters W. A., Berg-Lyons D., Lozupone C. A., Turnbaugh P. J., Fierer N., Knight R. 2011. Global patterns of 16S rRNA diversity at a depth of millions of sequences per sample. Proc Natl Acad Sci USA. 108:4516–4522. doi: 10.1073/pnas.1000080107
- Chao A. 1987. Estimating the population size for capture-recapture data with unequal catchability. Biometrics. 43:783–791. doi: 10.2307/2531532
- Compant S, Duffy B, Nowak J, Clément C, Barka EA. 2005. Use of plant growth-promoting bacteria for biocontrol of plant diseases: principles, mechanisms of action, and future prospects. Appl Environ Microbiol. 71:4951–4959. doi: 10.1128/AEM.71.9.4951-4959.2005
- Compant S, Mitter B, Colli-Mull JG, Gangl H, Sessitsch A. 2011. Endophytes of grapevine flowers, berries, and seeds: identification of cultivable bacteria, comparison with other plant parts, parts, and visualization of niches of colonization. Microbial Ecol. 62:188–197. doi: 10.1007/s00248-011-9883-y
- Copeland JK, Yuan L, Layeghifard M, Wang PW, Guttman DS. 2015. Seasonal community succession of the phyllosphere microbiome. Mol Plant Microbe Interact. 28:274–285. doi: 10.1094/MPMI-10-14-0331-FI
- de Souza RSC, Okura VK, Armanhi JSL, Jorrín B, Lozano N, da Silva MJ, González-Guerrero M, de Araújo LM, Verza NC, Bagheri HC, et al. 2016. Unlocking the bacterial and fungal communities assemblages of sugarcane microbiome. Sci Rep. 6:28774. doi: 10.1038/srep28774
- Frank AC, Saldierna Guzmán JP, Shay JE. 2017. Transmission of bacterial endophytes. Microorganisms. 5(4):70. doi: 10.3390/microorganisms5040070
- Fugelsang K, Edwards C. 2010. Wine Microbiology, 2nd ed. New York (NY): Springer Science and Business Media. p. 3:28.
- Gu L, Bai Z, Jin B, Hu Q, Wang H, Zhuang G, Zhang H. 2010. Assessing the impact of fungicide enostroburin application on bacterial community in wheat phyllosphere. J Environ Sci. 22:134–141. doi: 10.1016/S1001-0742(09)60084-X
- Herzog K, Wind R, Töpfer R. 2015. Impedance of the grape berry cuticle as a novel phenotypic trait to estimate resistance to Botrytis cinerea. Sensors. 15:12498–12512. doi: 10.3390/s150612498
- Hollander M, Wolfe DA. 1973. Nonparametric statistical methods. New York: John Wiley & Sons; p. 115–120.
- Ikeda S, Anda M, Inaba S, Eda S, Sato S, Sasaki K, Tabata S, Mitsui H, Sato T, Shinano T, et al. 2011. Autoregulation of nodulation interferes with impacts of nitrogen fertilization levels on the leaf associated bacterial community in soybeans. Appl Environ Microbiol. 77:1973–1980. doi: 10.1128/AEM.02567-10
- Jones K. 1970. Nitrogen fixation in phyllosphere of Douglas Fir Pseudotsuga-Douglasii. Ann Bot. 34:239–244. doi: 10.1093/oxfordjournals.aob.a084358
- Jousset A, Lara E, Wall LG, Valverde C. 2006. Secondary metabolites help biocontrol strain Pseudomonas fluorescens CHA0 to escape protozoan grazing. Appl Environ Microbiol. 72:7083–7090. doi: 10.1128/AEM.00557-06
- Kadivar H, Stapleton AE. 2003. Ultraviolet radiation alters maize phyllosphere bacterial diversity. Microb Ecol. 45:353–361. doi: 10.1007/s00248-002-1065-5
- Kishore GK, Pande S, Podile AR. 2005. Biological control of late leaf spot of peanut (Arachis hypogaea) with chitinolytic bacteria. Phytopathology. 95:1157–1165. doi: 10.1094/PHYTO-95-1157
- Knoche M, Lang A. 2017. Ongoing growth challenges fruit skin integrity. CRC Crit Rev Plant Sci. 36:190–215. doi: 10.1080/07352689.2017.1369333
- Kurose D, Furuya N, Saeki T, Tsuchiya K, Tsushima S, Seier MK. 2016. Species-specific detection of Mycosphaerella polygoni-cuspidati as a biological control agent for Fallopia japonica by PCR assay. Mol Biotechnol. 58:626–633. doi: 10.1007/s12033-016-9962-x
- Lambais MR, Crowley DE, Cury JC, Bull RC, Rodrigues RR. 2006. Bacterial diversity in tree canopies of the Atlantic forest. Science. 312:1917–1917. doi: 10.1126/science.1124696
- Lugtenberg BJ, Chin-A-Woeng TF, Bloemberg GV. 2002. Microbe-plant interactions: principles and mechanisms. Antonie van Leeuwenhoek. 81:373–383. doi: 10.1023/A:1020596903142
- Lundberg DS, Yourstone S, Mieczkowski P, Jones CD, Dangl JL. 2013. Practical innovations for high-throughput amplicon sequencing. Nat Methods. 10:999–1002. doi: 10.1038/nmeth.2634
- McMurdie PJ, Holmes S. 2013. Phyloseq: An R package for reproducible interactive analysis and graphics of microbiome census data. PLoS ONE. 8:e61217. doi: 10.1371/journal.pone.0061217
- Müller T, Ruppel S. 2014. Progress in cultivation independent phyllosphere microbiology. Fems Microbiol Ecol. 87:2–17. doi: 10.1111/1574-6941.12198
- Mwajita MR, Murage H, Tani A, Kahangi EM. 2013. Evaluation of rhizosphere, rhizoplane and phyllosphere bacteria and fungi isolated from rice in Kenya for plant growth promoters. SpringerPlus. 2:606. doi: 10.1186/2193-1801-2-606
- Myles H, Douglas AW. 1973. Nonparametric statistical methods. New York (NY): John Wiley & Sons; p. 27–33 (one-sample), 68–75.
- Nicolas SD, Péros J-P, Lacombe T, Launay A, Le Paslier M-C, Bérard A, Mangin B, Valière S, Martins F, Le Cunff L, et al. 2016. Genetic diversity, linkage disequilibrium and power of a large grapevine (Vitis vinifera L) diversity panel newly designed for association studies. BMC Plant Biol. 16:74. doi: 10.1186/s12870-016-0754-z
- Oksanen JF, Blanchet FG, Friendly M, Kindt R, Legendre P, McGlinn D, Minchin PR, O'Hara RB, Simpson GL, Solymos P, et al. 2017. vegan: community Ecology Package. R package version 2.4-3. https://CRAN.R-project.org/package=vegan.
- Paradis E, Claude J, Strimmer K. 2004. APE: analyses of phylogenetics and evolution in R language. Bioinformatics. 20:289–290. doi: 10.1093/bioinformatics/btg412
- Perazzolli M, Antonielli L, Storari M, Puopolo G, Pancher M, Giovannini O, Pindo M, Pertot I, Drake HL. 2014. Resilience of the natural phyllosphere microbiota of the grapevine to chemical and biological pesticides. Appl Environ Microbiol. 80:3585–3596. doi: 10.1128/AEM.00415-14
- Qin J, Li R, Raes J, Arumugam M, Burgdorf KS, Manichanh C, Nielsen T, Pons N, Levenez F, Yamada T, et al. 2010. MetaHIT Consortium. A human gut microbial gene catalog established by metagenomic sequencing. Nature. 464(7285):59–65. doi: 10.1038/nature08821
- R Core Team. 2017. R: A language and environment for statistical computing. R Foundation for Statistical Computing, Vienna, Austria. https://www.R-project.org/.
- Redford AJ, Bowers RM, Knight R, Linhart Y, Fierer N. 2010. The ecology of the phyllosphere: geographic and phyllogenetic variability in the distribution of bacteria on tree leaves. Environ Microbiol. 12:2885–2893. doi: 10.1111/j.1462-2920.2010.02258.x
- Schulz B, Rommert AK, Dammann U, Aust HJ. 1999. The endophyte-host interaction: a balanced antagonism? Mycol Res. 103:1275–1283. doi: 10.1017/S0953756299008540
- Turner TR, James EK, Poole PS. 2013. The plant microbiome. Genome Biol. 14:209. doi: 10.1186/gb-2013-14-6-209
- Vorholt JA. 2012. Microbial life in the phyllosphere. Nat Rev Microbiol. 10:828–840. doi: 10.1038/nrmicro2910
- Wagner MR, Lundberg DS, Rio TG, Tringe SG, Dangl JL, Olds TM. 2016. Host genotype and age shape the leaf and root microbiomes of a wild perennial plant. Nat Commun. 7:12151. doi: 10.1038/ncomms12151
- Wang Q, Garrity GM, Tiedje JM, Cole JR. 2007. Naive Bayesian classifier for rapid assignment of rRNA sequences into the new bacterial taxonomy. Appl Environ Microbiol. 73:5261–5267. doi: 10.1128/AEM.00062-07
- Wickham H. 2009. Ggplot2: elegant graphics for data analysis. New York (NY): Springer-Verlag.
- Wickham H. 2011. The split-apply-combine strategy for data analysis. J Stat Softw. 40:1–29.
- Williams TR, Moyne AL, Harris LJ, Marco ML. 2013. Season, Irrigation, leaf Age, and Escherichia coli Inoculation influence the bacterial diversity in the Lettuce phyllosphere. PLoS ONE. 8:e68642. doi: 10.1371/journal.pone.0068642
- Zarraonaindia I, Owens SM, Weisenhorn P, West K, Hampton-Marcell J, Lax S, Bokulich NA, Mills DA, Martin G, Taghavi S, et al. 2015. The soil microbiome influences grapevine-associated microbiota. Mbio. 6:e02527–14. doi: 10.1128/mBio.02527-14
- Zhang S, Chen X, Zhong Q, Huang Z, Bai Z. 2017. Relations among epiphytic microbial communities from soil, leaves and grapes of the grapevine. Front Life Sci. 10:73–83. doi: 10.1080/21553769.2017.1365776