
Abstract
Objectives: To study the accuracy and reliability of two point of care devices (Hemocue 201 [HC201]) and Hemoglobin Colour Scale (HCS) with reference to automated laboratory analyser Sysmex XP 100 (LabSXP) and determine factors influencing their performances. To discuss certain design issues while ascertaining these parameters for its judicious use in both clinical context and disease burden studies.
Methods: Reliability and accuracy statistics were calculated for four population subgroups that were selected randomly using cluster sampling in a rural community of eastern India. Appropriate measures were taken to reduce biases in the study. Bland Altmann Plot was used to determine Bias and ROC curve analysis was used to suggest new cut-offs for HCS method.
Results: True prevalence varied across subgroups ranging from 12.56% in adolescent boys to 40.71% in adult women. Sensitivity for HC201 was lowest among boys (80.39%) and highest among adult females (92.82%), while specificity was highest among adult males (86.94%) and lowest among adult females (75.00%). The variation across subgroups was due to differences in distribution of underlying Hb values. HC201 has potential for use in clinical practice as well as disease burden estimation study. HCS was not suitable for use in clinical setting as the bias (−4.1 g/dl) was unacceptable. However, ROC analysis suggested certain cut-offs for different age groups and can be employed in poor resource settings for disease burden estimation study.
Conclusions: HC201 is better than HCS as per the study. However, accuracy parameters are likely to vary depending on the distribution of underlying Hb distribution. Thus, same machines can demonstrate different accuracy parameters in different settings. There is need for designing studies that could help estimate these parameters each time on a subsample which would go a long way in efficiently using technology be it for guiding clinical decisions or public health actions.
Introduction
Anemia is an invisible public health problem of global concern. In the year 2011, iron-deficiency anemia (IDA) alone was rated as third major cause of disability worldwide, and resulted into loss of 42.2 million disability-adjusted life years (DALYs) [Citation1]. In India, as per the current global burden of disease study estimates, IDA is the topmost contributor of years lived with disability, accounting for 11% of all disability, its effects being most severe among women. In terms of DALYs, it showed an increase in both rank (currently six) and health loss caused, suggesting a need for renewed policy attention to this cause [Citation2].
It is high time focus is shifted from preventive to cause specific curative action in anemia control. In its revised strategy, Ministry of Health and Family Welfare, Government of India, lays emphasis on treatment of IDA besides supplementation measures to control it [Citation3]. To identify patients that would require treatment, clinical methods like palmer and conjunctival pallor are being recommended. However, evidence suggests that pallor is only useful in severe anemia and its sensitivity is unacceptable in mild, moderate anemia [Citation4–10]. This would result in missed cases and delayed treatment. One way, is to replace these clinical methods with simple, cost-effective, user-friendly point of care diagnostic devices (POCDs) that have acceptable test accuracy parameters, and margin of error within ±1 g/dl of true hemoglobin value (as determined by reference tests).
Further, from public health point of view, it is also important to continuously monitor the trend of anemia prevalence, which would help the policy makers to adopt evidence-based public health action. In such a scenario, accurate estimates of disease burden cannot be overemphasized given the resource constraints in developing nations like ours. Currently POCDs are increasingly being used in community surveys to provide state wise estimates of anemia prevalence in different patient subgroups in India [Citation11–13].
In this article, we present the accuracy and reliability parameters of POCDs like Hemocue 201 (HC201) and Hemoglobin colour scale (HCS) with reference to automated laboratory analyser sysmex XP 100 (LabSXP) [Citation14]. The intended use of these POCDs could include screening, diagnosis, or surveillance. We discuss the determinants of accuracy parameters and certain design issues while ascertaining these parameters for its judicious use in both clinical context and disease burden studies.
Patient and methods
The institute has a field practice area in Tangi block, Khorda district, in the state of Odisha (eastern India) that has a population of 0.16 million and has six sectors each with a primary health centre. The study was carried out in its largest sector Bhusandapur that had a total population of approximately 56,000. It was decided to carry out a community-based cross-sectional study to determine anemia prevalence (using Hemoglobin values) among apparently healthy males and apparently healthy nonpregnant females each, in two age groups, that is, 10–19 years and 20–60 years, who were willing to participate in the study, provide informed consent, and not suffering from any major illness at the time of the study. These same patients were subjected to testing on selected POCDs to obtain accuracy parameters and study spectrum effects.
Assuming anemia prevalence of 75–78% among females, 24% among males, while accounting for 7–10% nonresponse, and design effect of 1.5 [Citation15], the sample size estimate for each sex group between 10–19 years and 20–60 years, respectively, would be 450 each. The sample size was powered to answer the diagnostic accuracy question reported in this article. All included subjects were tested using HC201, and HCS and compared with LabSXP.
Cluster sampling design was chosen to select 30 villages (cluster) using probability proportionate to size methodology and 15 subjects were chosen randomly from the respective age and sex group amounting to 60 people from each village. A bottle was spun in the centre of the village to select a random direction. Last house in that direction was selected as starting point and every subsequent house along the way, as investigators moved backwards towards the centre was visited to recruit eligible participants from each stratum. If more than one person was found eligible in a given household, KISH grid was used to select the person randomly. Study was carried out over 9 months between May 2017 and Feb 2018.
The study participants were simultaneously tested on HCS and HC201 (Index test) using capillary blood in that sequence to avoid HCS interpretation being affected by the Hemoglobin (Hb) results displayed on HC201 equipment. Capillary blood was collected following wicking method and using special lancets recommended for use with HC201. Later 5 ml of venous blood was drawn, within 5 min of performing the index test, and transferred in EDTA vial to central laboratory maintaining the cold chain (between 2 and 8 °C) during transit, for testing on a three-part differential instrument SYSMEX XP 100 autoanalyzer (reference test) available in the institute at the time of the study and determine the true Hb value. The average time lag between collection of blood sample from the field and its testing in the laboratory (reference test) was about 4 h. There were no adverse events from performing either the index or the reference tests. The output on reference test was automatic and, thus, did not interfere with fact that assessor had access to index test results. We, thus, ensured that none of the ratings got influenced by performance on any of the tests. A single trained Laboratory technician was utilised for testing all the participants to eliminate interrater variability.
Data analysis
Individuals were classified as anaemic based on WHO cut-offs for Hb for age and sex [Citation16]. Same cut-offs were applied to values on index and reference tests to differentiate anaemic from nonanaemic individuals. We calculated accuracy statistics like sensitivity, specificity, Likelihood ratios positive and negative (LR+, LR−) using standard definitions. We plotted receiver operating characteristics (ROC) curve to determine the area under curve (AUC) for both the POCDs and also establish a suitable cut-off for the HCS method.
Reliability of POCDs was determined by studying the degree of homogeneity between the Hb measurements by utilizing the intraclass correlation coefficient (ICC) for agreement and consistency. Bland–Altman plots accommodating the double measurements within subjects were used to capture bias and 95% limits of agreement.
All statistical analyses were performed using XLSTAT, Microsoft excel version 2016, and Epi-info version 7.2.2.6. The ICCs were interpreted as follows: <0, poor; 0.01–0.20, slight agreement; 0.21–0.40, fair agreement; 0.41–0.60, moderate agreement; 0.61–0.80, substantial agreement; and 0.81–1.00, almost perfect agreement.
Any missing data was removed at the time of the analysis. Whenever there was any error during measurement on HC201, the procedure was repeated one more time after trouble shooting the cause of error following standard guidelines. If error persisted, results were declared inconclusive. Every attempt was made to identifying the closest match while using HCS.
Quality control
The institute has a standard operating procedure for maintaining quality while processing samples on SYSMEX XP100. These guidelines were followed right from the time sample was collected, until it was processed. Six months internal quality control data is being used to calculate routine imprecision and updated annually. Stable controls are procured from commercial sources and data is plotted on control charts (L.J. charts). Laboratory uses 2 levels of controls at least once a day. For Hemocue 201+, the cuvettes are stored as per recommendations and standard techniques are used for periodic cleaning of the cuvette holder and optical sensor to ensure error free results.
Ethical considerations
Study was approved by the Institute ethics committee (Project code-IMF/27/2016). Informed consent was obtained and confidentiality was maintained in the Department of Community and Family Medicine. We observed the ethical principles suggested by Indian Council of Medical Research [Citation17] throughout the conduct of the study.
Results
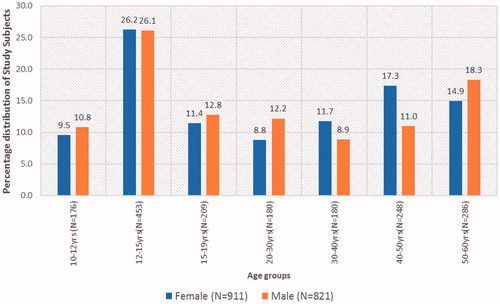
Overall 1732 participants were subjected to index tests. HC201 was inconclusive in 15 and reference tests results was not available in 4 due to withdrawal of consent for intravenous blood (). We had 408 males and 430 females in the age group 10–19 years, while 413 males and 481 females in the age group 20–60 years (). It was difficult to recruit adult males as most were working. Adult females were overrecruited due to their request that could not be denied in community settings.
Figure 1. STARD diagram reporting flow of participants through the study comparing HC201, HCS with SYSMEX XP100 for Hb estimation in rural population of Odisha, India 2017.
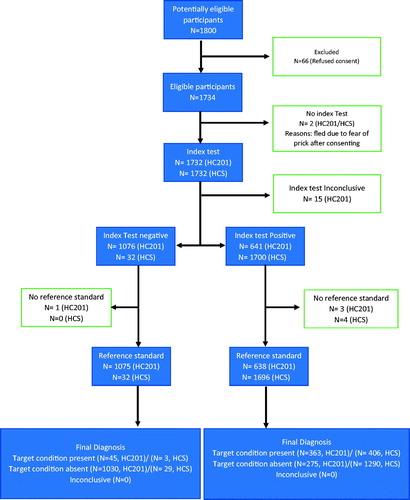
Figure 2. Age and sex distribution of subjects undergoing diagnostic accuracy testing in Tangi Rural Anemia diagnostic accuracy study, 2017.
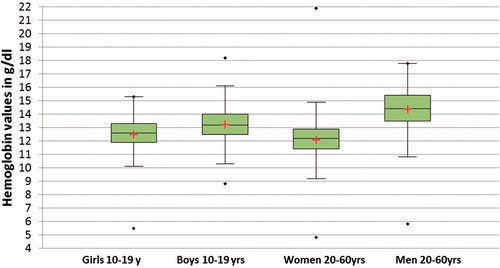
Hemoglobin was normally distributed in both sexes and age groups that underwent reference test (). The mean (SD) Hb values for adolescent boys, adolescent girls, adult males, and adult females were 13.23 g/dl (1.23), 12.47 g/dl (1.28), 14.36 g/dl (1.53), and 12.07 g/dl (1.52), respectively, and the difference was statistically significant. Overall in all samples combined 3.3% subjects had Hb <10 g/dl, 19% had Hb ≥10 and <12 g/dl, 27% with Hb from 12 g/dl to <13 g/dl, 40% between 13 g/dl and <15 g/dl, rest above 15 g/dl.
Figure 3. Box plots of population subgroups depicting distribution of true Hb values as determined by reference standard.
and provides accuracy statistics for both the index tests. At the WHO clinical cut-off for anemia, HCS provides very poor specificity of 2.2% that could lead to massive false positive diagnosis. On the contrary HC201 exhibits sensitivity and specificity of 89% and 79%, respectively, that would lead in missing 11% cases and over diagnosing 21% cases. True anemia proportion in the overall sample was 23.82%. With the calculated sensitivity and specificity of HC201 and HCS for the overall sample, the estimated proportion (i.e. all test positives with index tests contributing to the prevalence calculation in this scenario) of anemia within the sample would increase by 13.4% and 74% points above the true value thus overestimating the true prevalence suggested by the reference test.
Table 1. Accuracy parameters of index test (HC201) among study participants in Tangi Rural Anemia diagnostic accuracy study, 2017.
Table 2. Accuracy parameters for HCS at different cut-offs among study participants in Tangi Rural Anemia diagnostic accuracy study, 2017.
Most (79.22%) of the HC201 results fell within 1 g/dl of the sysmex values, 13.54% between −1 g/dl and −2 g/dl, 3.85%g/dl > −2 g/dl, and 3.39% >1 g/dl. Similarly, few (2.92%) of the HCS results fell within 1 g/dl of the sysmex values, 7.88% between −1 g/dl and −2 g/dl, 14.94% between −2 g/dl and −3 g/dl, While most (73.96%) < −3 g/dl and 0.29% > 1 g/dl.
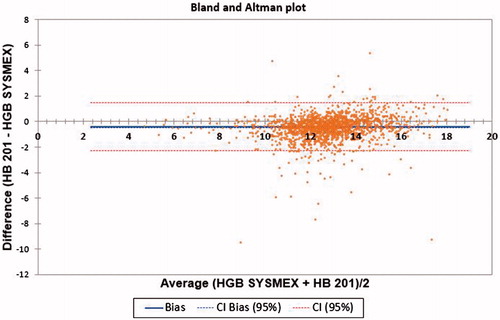
Intraclass correlation for agreement (ICC-A) between HC201 and SYSMEX XP100 was 0.903 (CI: 0.845–0.934), while ICC for consistency (ICC-C) was 0.917 (CI: 0.909–0.924). Average bias for HC 201 was −0.417 (CI: −0.462, −0.371) and limits of agreement between −2.302 and 1.468 ().
Figure 4. Bland Altman plot comparing HC201 with SYSMEX XP100 for Hb estimation in rural population of Odisha, India 2017.
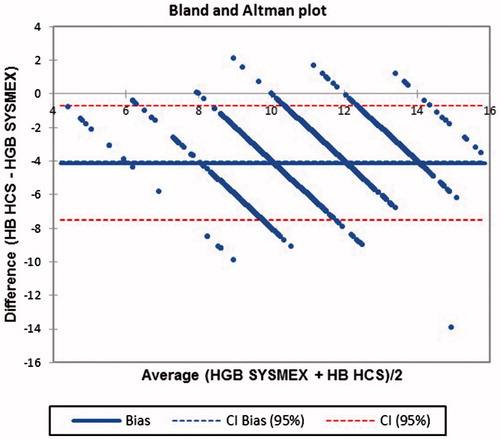
While, ICC-A between HCS and SYSMEX XP100 was 0.24 (CI: −0.158–0.604), ICC-C was 0.677 (CI: 0.645–0.706) and average bias for HCS was −4.121 (CI: −4.203, −4.039) with limits of agreement between −7.521 and −0.720 ().
Figure 5. Bland Altman plot comparing HCS with SYSMEX XP100 for Hb estimation in rural population of Odisha, India 2017.
ROC curve analysis details are provided in and plot in . Since the bias for HCS was not acceptable, we attempted to define a new cut-off for the test. It appears that perhaps at below score six subjects could be defined as having anemia, and this would have specificity of 88.85%, sensitivity 22.93%, LR + of 2.04 and LR− 0.87. However, accuracy statistics at various cut-offs are shown in .
Figure 6. ROC curve comparing HCS with HC201 for Hb estimation in rural population of Odisha, India 2017.
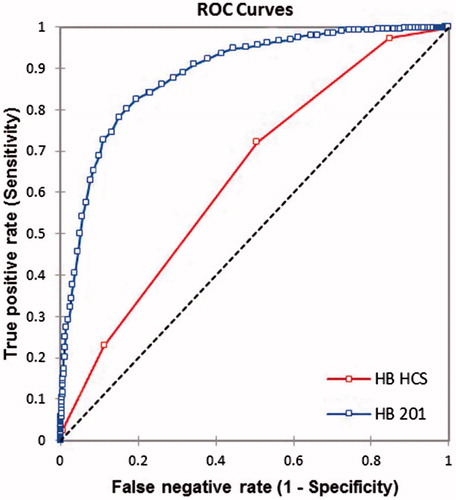
Table 3. ROC analysis parameters during comparison of HCS and HC201 for Hb estimation in rural population of Odisha, India 2017.
Discussion
POCDs in Hb estimation has utility in both clinical practice and public health surveillance. Inaccurate tests will not only affect treatment decisions but also provide inconsistent estimates of disease burden in the community. Presence of bias can lead to incorrect estimates of accuracy, while presence of source of variation would result in differences in true diagnostic accuracy across studies, thus limiting applicability to a specific clinical or public health question.
Number of biases and sources of variations have been identified [18–21] and one way of reducing it is by following recognized standards while designing such studies [22–24]. In our study, we examined the performance of POCDs like HC201 and HCS with respect to its accuracy and reliability in four different carefully selected population subgroups. We also computed these parameters in a combined sample (N = 1713; Tables 2 and 3) to demonstrate the presence of spectrum effects, further emphasizing the problems of spectrum and bias as suggested by Ransohoff and Feinstein [Citation19]. Our patients (Figures 2 and 3) were enrolled randomly using a cross sectional study design that included a broad spectrum of Hb values distributed normally in each age and sex group and these groups were representative of similar population groups encountered in primary care settings, as well as population-based surveys. This would minimize both selection and spectrum bias. Interpretations of every test were carried out independent of each other to tackle information bias. LABSXP values had a variation coefficient of 1.5% or less for Hb, when peripheral blood or control blood was analyzed more than 10 times continuously, minimizing possibility of classification bias due to reference test. Chances of disease progression bias were nil as samples for testing by test and reference methods were collected simultaneously, and every patient were subjected to both the tests eliminating incorporation bias or work up bias.
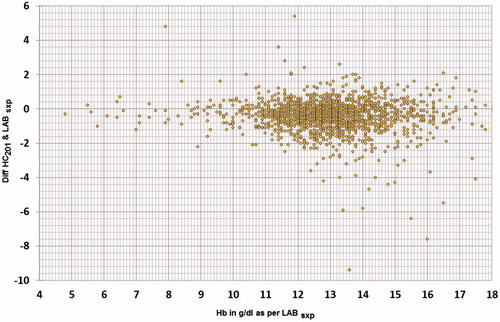
It is generally expected that a diagnostic device provides accurate estimates of underlying clinical trait; however, in real conditions we seldom achieve this due to disagreement between the measured value and underlying true value in addition to the reasons mentioned earlier. However, a near perfect agreement is always desirable. In Hb estimation, test methods are acceptable as long as at-least 95% of test values are within ±1 g/dl of reference values. A plot of differences between the methods against their mean helps to examine this expectation [Citation25]. In present study, the average bias of HC201 was −0.417 g/dl (), however the bias was not consistent throughout the Hb range (). It was −0.198 g/dl, −0.276 g/dl, and −0.467 g/dl for true Hb values ≤10 g/dl, ≤12 g/dl, >12 g/dl, respectively. This can particularly lead to misclassification bias, if the distribution of Hb values in other study samples differ and thus limit applicability. Misclassification is more likely to result among patients with values around the clinical cut-offs used for defining anemia. The distribution of Hb values were examined in four study groups () and were found to be statistically different based on Kruskal–Wallis test (p < .0001). We have thus provided group specific estimates of accuracy parameters to inform applicability in respective groups in other settings.
Figure 7. Scatter of difference of Hb values estimated by HC201 and Reference test against true Hb values provided by the reference test.
The estimates of accuracy parameters for HC201 differed in each group () due to variation in age/sex distribution, disease severity etc. However, since we have specified the spectrum and provided indices of accuracy in pertinent clinical subgroups, this will enhance its clinical applicability in similar patient groups. If we were to recommend use of accuracy parameters derived from the entire 1732 sample then spectrum effect (a phenomenon wherein the accuracy parameters differ in subgroups) would come into picture. The term was first introduced by Ransohoff and Feinstein [Citation19]. Whether spectrum effect leads to bias depends on its effects on the posttest probabilities and more importantly if this results into differences in clinical decisions [Citation26]. A number of methods have been described that could help distinguish spectrum effects from spectrum biases that result in variability of medical diagnostic test performance [Citation26,Citation27].
As expected in males the specificity was higher and in females’ sensitivity was higher, this being due to shift of mean values of Hb on either side of the spectrum. Except for the adult males with LR + of 6.4, rest LR + were comparable. LR − varied across the age and sex groups in comparison to overall sample. Ratio of LR + in various subgroups with that of the overall sample (from ) suggest marked deviation among adult males. While, ratio of subgroup specific LR − estimates with that of overall sample indicate deviation in all age and sex groups except adolescent girls.
Spectrum bias will result in clinically important differences in post-test probabilities under two circumstances: (1) presence of bias in the ratio of LR + and prevalence of disease is low, and (2) when bias exist in ratio of LR − and prevalence of disease is high [Citation26]. As per our findings (), such a situation exists among adult males and females (This is if we were to combine the whole sample instead of looking at subgroup specific estimates). Thus, spectrum effect is likely to result into spectrum bias in these subgroups, unless we use subgroup specific accuracy parameters in decision making. This further strengthens the argument that only those spectrum of patients’ needs to be included in diagnostic accuracy studies that will be similar to the population in which the test will be used in practice [Citation23].
While for purpose of clinical use it is always desirable to have very few false negatives and positives, we need to realize that the accuracy parameters estimated would also depend on the composition of study sample, besides measurement errors across Hb range. As a rule, for rare disease, positive test results should be cautiously interpreted among subgroups who differ from the sample used to determine accuracy parameters. The same caution applies to negative test results when the disease is more common [Citation28].
Thus, variations in accuracy parameters are known to occur due to differences in demographic features of study populations, disease prevalence, disease severity, interobserver variability, availability of clinical information, test technology, test execution, ands so forth [Citation18]. In our study, sensitivity increased while specificity decreased with rise in disease prevalence (). Similar findings have been reported in other disease conditions too [Citation18,Citation29]. With increasing anemia prevalence, the spectrum of Hb values would shift leftwards increasing numbers having more severe disease. This in turn would result in rise in sensitivity. Our findings provides further evidence challenging the popular belief that sensitivity, specificity, likelihood ratios are independent of disease prevalence [Citation30]. In fact, these parameters strongly depend on the distribution of the underlying traits relative to the diagnostic cut-point, which vary between populations or between subgroups within the same population and thus have important practical implications.
We further move our attention to how this would influence the disease burden estimates made by using POCDs that have varying accuracy estimates based on the factors discussed so far. Measures of disease frequency like prevalence, incidence typically represent the number of people who were tested positive for a diagnostic test rather than those who actually had the disease. Unless the false positives are equal to false negatives the estimates are unlikely to be accurate. If the disease prevalence is lower than 50%, specificity of the test needs to be greater than sensitivity. Conversely for diseases with higher prevalence, sensitivity has to be higher to obtain accurate estimates. So, the solution lies in either using appropriate diagnostic tests for a given true prevalence or estimating the necessary test statistic and provides corrected estimates. This has been nicely illustrated by Campbell et al. [Citation31].
With regards to HCS we would suggest a different approach. The values on the scale are expected to represent the true underlying Hb levels. But the bias obtained in the study was not clinically acceptable. So, we decided to run a ROC analysis instead and suggest a cut-point to distinguish people with and without disease amenable to further testing or estimating disease burden as discussed earlier. Based on the findings in , it does not seem reasonable to use HCS at any cut-off in diagnosis and treatment of patients, though cut-off of <7 for all the age and sex groups except adult males in whom cut-off <9 could be used for disease burden estimation and appropriate corrections could be used to get the true picture. Choice of HC201 or HCS for disease burden study would depend on availability of resources, though we would like to favour HC201 considering the degree of bias, and accuracy parameters. HC201 requires continuous supplies of cuvettes. These are often seen as limiting factors due to escalating operational costs of using POCDs. The prices of these cuvettes need to be regulated or subsidized for use in public health care system. Further studies are required to establish the cost-effectiveness of these POCDs and guide policy makers in their efforts to control and prevent anemia.
The strength of our study is that we have assembled a community-based sample to derive subgroups specific accuracy estimates. We have discussed the importance of taking into consideration the disease prevalence and population composition before applying the findings to people either in clinical settings or population studies. The revised cut-offs proposed for HCS for population-based surveys require further testing in different setting. Thus, being aware of reasons for variation in accuracy estimates for same machines in different settings, and the need for designing studies that could help estimate these parameters each time on a subsample as outlined by Campbell et al. [Citation31] could go a long way in efficiently using technology be it for guiding clinical decisions or public health actions.
Transparency
Declaration of funding
Intramural Research Grant No: IMF/27/2016 from AIIMS Bhubaneswar.
Declaration of financial/other relationships
The author have no financial or other relationships to declare. JME peer reviewers on this manuscript have no relevant financial or other relationships to disclose.
Author contributions
PBM designed the study, collected data, analyzed and wrote the first draft and approved it. SM collected the data, analyzed it and revised the manuscript and accepted the final version.
Acknowledgments
We would like to thank our Institute (AIIMS hubaneswar, Institute of National Importance under MoH&FW, Govt of India) for providing intramural grant (No: IMF/27/2016) to meet the cost of all reagents and consumables required for the conduct of the study as well other resources, such as printing and travel facilities to study site throughout the study duration. PBM was working as Associate Professor, Department of Community Medicine and Family Medicine at AIIMS Bhubaneswar at the time of submission of this manuscript.
References
- Mathers C, Stevens G, Ho J. WHO methods and data sources for global burden of disease estimates 2000–2011 [Internet]. Glob Heal. Estim Tech Pap. 2013;4:2013.
- Indian Council of Medical research, Public Health Foundation of India, and Institute for Health Metrics and Evaluation. India: Health of the Nation’s States- The India State-level Disease Burden Initiative. New Delhi, India: ICMR, PHFI, and IHME; 2017.
- Guidelines for Control of Iron Deficiency Anaemia [Internet]. 2013 [cited 2018 Feb 23]. Available from: http://www.pbnrhm.org/docs/iron_plus_guidelines.pdf
- Butt Z, Ashfaq U, Sherazi SFH, et al. Diagnostic accuracy of "pallor" for detecting mild and severe anaemia in hospitalized patients. J Pak Med Assoc. 2010;60:762–765.
- Kalantri A, Karambelkar M, Joshi R, et al. Accuracy and reliability of pallor for detecting anaemia: a hospital-based diagnostic accuracy study. PLoS One. 2010;5:e8545.
- Chalco JP, Huicho L, Alamo C, et al. Accuracy of clinical pallor in the diagnosis of anaemia in children: a meta-analysis. BMC Pediatr. 2005;5:46.
- Meda N, Dao Y, Touré B, et al. Assessing severe maternal anemia and its consequences: the value of a simple examination of the coloration of palpebral conjunctiva. Sante. 9:12–17.
- Luby SP, Kazembe PN, Redd SC, et al. Using clinical signs to diagnose anaemia in African children. Bull. World Health Organ. 1995;73:477–482.
- Kalter HD, Burnham G, Kolstad PR, et al. Evaluation of clinical signs to diagnose anaemia in Uganda and Bangladesh, in areas with and without malaria. Bull World Health Organ. 1997;75 (Suppl 1):103–111.
- Stoltzfus RJ, Edward-Raj A, Dreyfuss ML, et al. Clinical pallor is useful to detect severe anemia in populations where anemia is prevalent and severe. J Nutr. 1999;129:1675–1681.
- District Level Household & Facility Survey …. [Internet]. [cited 2018 Mar 4]. Available from: http://rchiips.org/DLHS-4.html
- National Family Health Survey [Internet]. [cited 2018 Mar 4]. Available from: http://rchiips.org/NFHS/index.shtml
- Annual Health Survey: Clinical, Anthropometric & Bio-chemical (CAB) Survey | Open Government Data (OGD) Platform India [Internet]. [cited 2018 Mar 4]. Available from: https://data.gov.in/catalog/annual-health-survey-clinical-anthropometric-bio-chemical-cab-survey
- XP Series | Sysmex India – Hematology Instrumentation [Internet]. [cited 2018 Mar 9]. Available from: http://www.sysmex.co.in/products/diagnostics/hematology/xp-series/
- Sharman A. Anemia testing in population-based surveys general information and guidelines for country monitors and program managers [Internet]. 2000; [cited 2018 Feb 24]. Available from: https://dhsprogram.com/pubs/pdf/od22/od22.pdf
- WHO. Haemoglobin concentrations for the diagnosis of anaemia and assessment of severity. Vitamin and mineral nutrition information system. Geneva: World Health Organization; [Internet]. 2011; (WHO/NMH/NHD/MNM/11.1) [cited 2018 Feb 24]. Available from: http://www.who.int/vmnis/indicators/haemoglobin.pdf
- Mathur R, editor. National ethical guidelines for biomedical and health research involving human participants. New Delhi: Director-General Indian Council of Medical Research; 2017; [cited 2018 Mar 20]. Available from: http://icmr.nic.in/guidelines/ICMR_Ethical_Guidelines_2017.pdf
- Whiting PF, Rutjes AWS, Westwood ME, et al. A systematic review classifies sources of bias and variation in diagnostic test accuracy studies. J Clin Epidemiol. 2013;66:1093–1104.
- Ransohoff DF, Feinstein AR. Problems of spectrum and bias in evaluating the efficacy of diagnostic tests. N Engl J Med. 1978;299:926–930.
- Schmidt RL, Factor RE. Understanding sources of bias in diagnostic accuracy studies. Arch Pathol Lab Med. 2013;137:558–565.
- Roever L. Types of bias in studies of diagnostic test accuracy. Evid Based Med Pract. 2016;22:e113.
- Bossuyt PM, Reitsma JB, Bruns DE, et al. STARD 2015: an updated list of essential items for reporting diagnostic accuracy studies. BMJ. 2015;351:h5527.
- Reid MC, Lachs MS, Feinstein AR. Use of methodological standards in diagnostic test research. Getting better but still not good. JAMA. 1995;274:645–651..
- Whiting PF, Rutjes AWS, Westwood ME, et al. QUADAS-2: a revised tool for the quality assessment of diagnostic accuracy studies. Ann Intern Med. 2011;155:529–536.
- Bland JM, Altman DG. Statistical methods for assessing agreement between two methods of clinical measurement. Lancet 1986;1:307–310.
- Goehring C, Perrier A, Morabia A. Spectrum bias: a quantitative and graphical analysis of the variability of medical diagnostic test performance. Stat Med. 2004;23:125–135.
- Elie C, Coste J. A methodological framework to distinguish spectrum effects from spectrum biases and to assess diagnostic and screening test accuracy for patient populations: application to the Papanicolaou cervical cancer smear test. BMC Med Res Methodol. 2008;8:2018–2027.
- Baron JA. Uncertainty in bayes. Med Decis Mak. 1994;14:46–51.
- Leeflang MMG, Bossuyt PMM, Irwig L. Diagnostic test accuracy may vary with prevalence: implications for evidence-based diagnosis. J Clin Epidemiol. 2009;62:5–12.
- Brenner H, Gefeller O. Variation of sensitivity, specificity, likelihood ratios and predictive values with disease prevalence. Stat Med. 1997;16:981–991
- Campbell H, Biloglav Z, Rudan I. Reducing bias from test misclassification in burden of disease studies: use of test to actual positive ratio–new test parameter. Croat Med J. 2008;49:402–414.